Room-noise criteria (NC / RC Mark II)
Standards: ANSI/ASA S12.2Key references: Beranek 1957Kosten & van Os 1962Blazier 1997
Steady background noise in an occupied room (from ventilation, diffusers or distant traffic) is rated against a family of octave-band criterion curves. ANSI/ASA S12.2-2019, Criteria for Evaluating Room Noise, defines two spectrum-in ratings that phonometry implements: the Noise Criteria (NC) rating (the NC-(SIL) designation of clause 5.2.2, with the tangency method when the spectrum exceeds it), and the Room Criteria Mark II (RC) rating with its rumble/hiss spectral tag. Both work on octave-band sound pressure levels over the ten bands from 16 Hz to 8000 Hz.
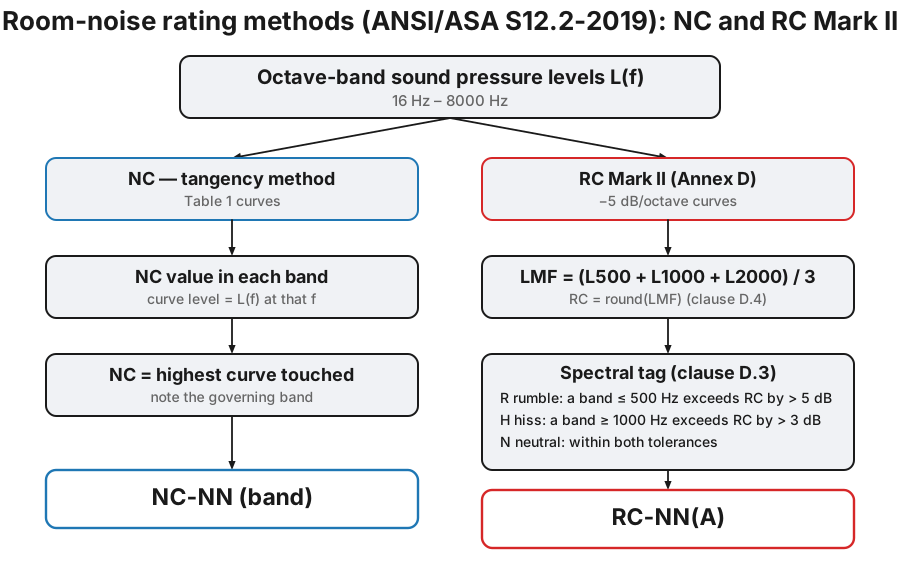
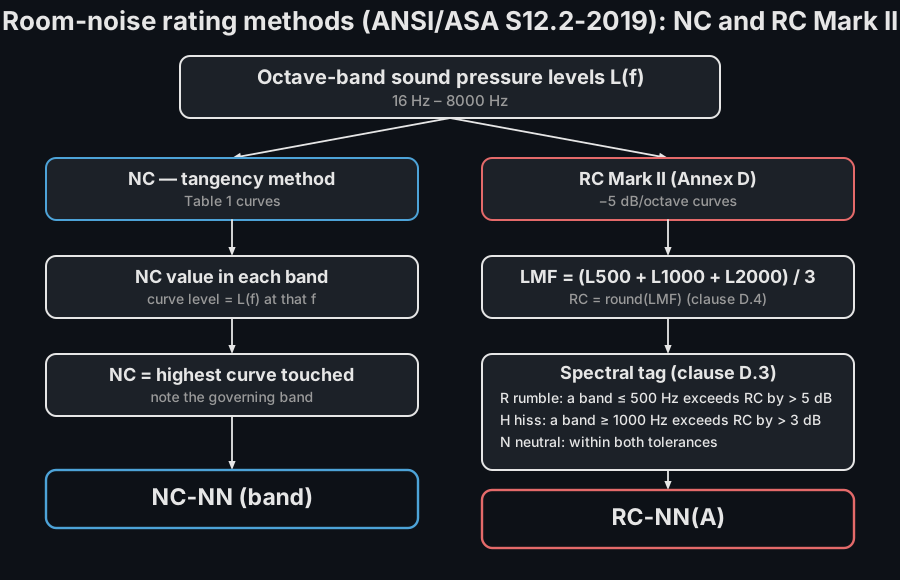
1. Noise Criteria: SIL designation and tangency
Section titled “1. Noise Criteria: SIL designation and tangency”The NC curves (ANSI/ASA S12.2-2019 Table 1) are a family of octave-band limits, each designated by its value at 1000 Hz (NC-15 up to NC-70). Clause 5.2.2 rates a spectrum in two steps. First the speech interference level (clause 3.2, the average of the 500/1000/2000/4000 Hz levels) selects the NC-(SIL) curve: if no octave band exceeds it, the spectrum is simply designated NC-(SIL). Only when the spectrum pokes above that curve does the tangency method (clause 5.2.3) take over: for each octave band, the NC index whose curve passes through the measured level is found, and the rating is the maximum across bands. The band where that maximum occurs, the one that pushes the spectrum up against the curves, is reported as the governing band.
import numpy as npfrom phonometry import room
# Octave-band SPL, 16 Hz - 8000 Hz (a ventilation-dominated room).spl = np.array([62.0, 62.0, 59.0, 57.0, 52.0, 42.0, 35.0, 29.0, 24.0, 19.0])
nc = room.noise_criterion(spl)print(round(nc.sil, 1))           # 32.5   (clause 3.2)print(nc.method)                  # 'tangency'  (the NC-32 curve is exceeded)print(round(nc.rating, 1))        # 42.5print(nc.governing_frequency)     # 250.0  (the tangent band)print(nc.label)                   # 'NC-42.5 (250 Hz)'nc.plot()   # the spectrum over the NC curve family (left panel below)
Because a tangency rating interpolates between the tabulated curves it is a
continuous number: an NC rating of sits half-way between NC-40 and
NC-45 (a SIL designation is always an integer). The tangency rating is kept
on tangency_rating even when the SIL designation applies. A subset of the
octave bands may be supplied together with their centre frequencies
(room.noise_criterion(levels, frequencies)); without the four SIL bands the
tangency rating alone sets the designation.
The Table 1 family ends at NC-70 and NC-15, and the standard defines no
rating beyond it. A spectrum above the NC-70 curve (or entirely below the
NC-15 curve) therefore gets rating = nan and an out_of_range flag of
"above" / "below", with nc.label reading '>NC-70 (63 Hz)' (the band
with the largest exceedance over NC-70 governs) or '<NC-15'; no NC-71 or
NC-14 style numbers are ever fabricated.
2. Room Criteria Mark II: rating and spectral tag
Section titled “2. Room Criteria Mark II: rating and spectral tag”The RC Mark II curves (ANSI/ASA S12.2-2019 Annex D, Table D.1) have a constant slope of −5 dB/octave, keyed to their value at 1000 Hz, with the 16 Hz level equal to the 31.5 Hz level and a low-frequency floor of 55 dB. The numerical rating is the mid-frequency average , the mean of the 500, 1000 and 2000 Hz levels, rounded to the nearest decibel (clause D.4):
A spectral tag then describes the character of the noise by how the spectrum deviates from the reference RC curve (clause D.3): rumble () when a band at or below 500 Hz exceeds the curve by more than 5 dB, hiss () when a band at or above 1000 Hz exceeds it by more than 3 dB, and neutral () when neither happens.
import numpy as npfrom phonometry import room
spl = np.array([62.0, 62.0, 59.0, 57.0, 52.0, 42.0, 35.0, 29.0, 24.0, 19.0])
rc = room.room_criterion(spl)print(rc.label)             # RC-35(R)   -  a rumbly roomprint(round(rc.lmf, 1))     # 35.3print(rc.classification)    # Rrc.plot()   # the spectrum over the RC reference (right panel below)
The strong low-frequency content of this spectrum lifts the 63–250 Hz bands well above the reference curve, so the noise is tagged (rumble): the subjective “throb” of an oversized air handler.
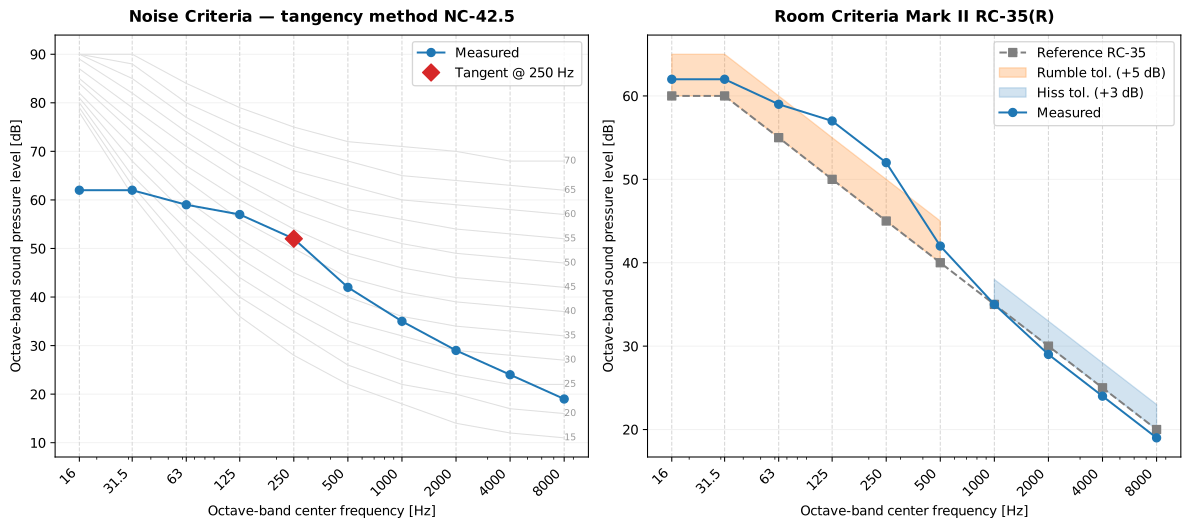
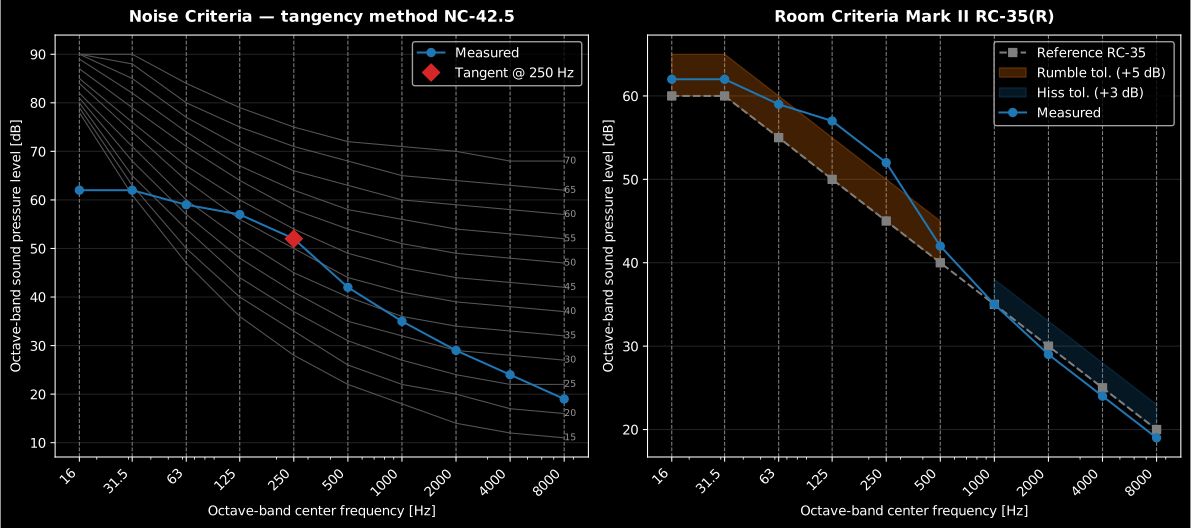
Show the code for this figure
import numpy as npimport matplotlib.pyplot as pltfrom phonometry import room
spl = np.array([62.0, 62.0, 59.0, 57.0, 52.0, 42.0, 35.0, 29.0, 24.0, 19.0])
# One line each:room.noise_criterion(spl).plot()room.room_criterion(spl).plot()plt.show()
# By hand, mirroring what NCResult.plot() / RCResult.plot() draw:from phonometry.room.room_noise import NC_CURVES, NC_INDICES, OCTAVE_BANDSnc, rc = room.noise_criterion(spl), room.room_criterion(spl)fig, (ax1, ax2) = plt.subplots(1, 2, figsize=(12, 5))
for row, idx in zip(NC_CURVES, NC_INDICES):    ax1.plot(OCTAVE_BANDS, row, color="#bbbbbb", lw=0.8)ax1.plot(OCTAVE_BANDS, spl, "o-", label="Measured")gov = spl[OCTAVE_BANDS == nc.governing_frequency][0]ax1.plot([nc.governing_frequency], [gov], "D", color="#d62728")ax1.set_xscale("log"); ax1.set_title(f"NC-{nc.rating:g}")
ref = rc.reference_curvelow, high = OCTAVE_BANDS <= 500, OCTAVE_BANDS >= 1000ax2.plot(OCTAVE_BANDS, ref, "s--", color="#7f7f7f", label=f"Reference RC-{rc.rating}")ax2.fill_between(OCTAVE_BANDS[low], ref[low], ref[low] + 5, color="#ffbb78", alpha=0.35)ax2.fill_between(OCTAVE_BANDS[high], ref[high], ref[high] + 3, color="#aec7e8", alpha=0.45)ax2.plot(OCTAVE_BANDS, spl, "o-", label="Measured")ax2.set_xscale("log"); ax2.set_title(rc.label)plt.show()
The NCResult carries the rating, the sil, the tangency_rating, the
method ('SIL' or 'tangency'), the governing_frequency, the
out_of_range flag and the measured levels, plus a convenience label
('NC-44', 'NC-51 (125 Hz)', '>NC-70 (63 Hz)'); the RCResult carries
the rating, the lmf, the classification, the reference_curve, an
out_of_family flag (Table D.1 tabulates RC-25 through RC-50 only) and a
convenience label in the RC-NN(A) form. Clause D.3.5 admits the tags
, , or ; when both the rumble and hiss deviations fire, the
library reports the combined RH as a diagnostic extension. Each result
exposes a .plot() that renders its panel above. Clause D.4 expects at
least the 31.5 Hz to 4000 Hz octave bands: a spectrum missing any of them
still rates, but emits a UserWarning because the absent bands are skipped
by the tag deviation tests.
The balanced noise criteria (NCB), the room noise criterion for fluctuating low-frequency noise (RNC, which needs a time series rather than a single spectrum), the vibration/rattle tag (, which needs the Table 6 test) and the numeric quality-assessment index (QAI, which the standard defers to external references) are not part of this module.
3. Choosing a criterion: NC, RC Mark II or NR
Section titled “3. Choosing a criterion: NC, RC Mark II or NR”The two ratings answer different questions, and a third family exists that this module deliberately does not implement:
- NC answers “does the room meet its limit, and which band breaks it?”. It is the compliance rating of North-American practice (specifications, codes, equipment schedules). The clause 5.2.2 SIL step anchors the designation to speech interference, but the moment any band exceeds the NC-(SIL) curve the tangency method takes over and is driven entirely by the single governing band. That is also its blind spot: two NC-40 rooms can sound completely different, one rumbly and one hissy, because tangency says nothing about spectral balance. Use NC when a specification cites it, and always report the governing band with a tangency rating, since it names the octave any fix must attack first.
- RC Mark II answers “how does the room sound, and what should be fixed?”. Its rating tracks speech interference through the mid-frequency average, and its reference slope of −5 dB per octave is the spectrum occupants describe as neutral, a bland ventilation background that is neither boomy nor sharp. The spectral tag then points at the offending frequency range. Reach for RC Mark II at HVAC design time, or to diagnose an installation that fails its NC limit.
- NR (Noise Rating), the curve family of Kosten & van Os (1962), is the European counterpart of NC: the same tangency logic over a slightly different curve family (more permissive at low frequency, stricter at high), common in European and international equipment and building specifications. phonometry does not implement NR; when a specification cites NR, rate against the NR curves themselves rather than substituting NC, because the two families diverge by several decibels away from the mid frequencies.
Reading the tag. The RC Mark II tag is a repair hint, not just a label.
A rumble tag (R, more than 5 dB over the reference at or below 500 Hz)
points at the air-handling plant: an oversized or starved fan, duct
rumble, or structure-borne vibration re-radiated by walls, and it is the
low-frequency energy that rattles lightweight construction and fatigues
occupants. A hiss tag (H, more than 3 dB over at or above 1000 Hz)
points at the terminal end: diffuser and grille face velocities or a
throttled damper close to the outlet, and it is the range that masks
speech. A neutral tag (N) means the level can still be wrong, but the
character is right: reduce the whole spectrum rather than reshape it.
4. Room-noise reports (.report())
Section titled “4. Room-noise reports (.report())”Both ratings render a one-page PDF room-noise assessment fiche.
NCResult.report(path) and RCResult.report(path) share the same layout: a
standard-basis line, an optional metadata header block, the measured
octave-band levels beside the measured spectrum plotted against the NC/RC curve
family (the result’s own .plot()), the boxed rating, an optional verdict row
and a footer with the fixed disclaimer. The NC box shows the NC-nn
designation with the SIL and, for a tangency rating, its governing band
(>NC-70 / <NC-15 when the spectrum falls outside the Table 1 family); the
RC box shows RC-nn(tag) with the mid-frequency average
and the spectral quality. A lower rating is quieter, so a
requirement on the metadata (read as the maximum acceptable NC or RC rating)
passes at or below the target. Setting verbose=True adds the per-band NC
contour value read by the tangency method (NC), or the reference RC Mark II
curve and the measured deviation from it (RC). Both use the same
ReportMetadata container as the other fiches; the room-specific room_volume
and area populate the header alongside client, test_room, specimen,
instrumentation, the climate fields, measurement_standard, test_date,
laboratory, operator and report_id. Passing metadata=None produces a
bare assessment fiche. Rendering needs reportlab
(pip install phonometry[report]); only engine="reportlab" is supported, and
language="es" renders a Spanish fiche (translated fixed strings and a comma
decimal separator).
import numpy as npfrom phonometry import room, ReportMetadata
spl = np.array([79.0, 69.0, 59.0, 51.0, 50.0, 39.0, 36.0, 34.0, 33.0, 32.0])metadata = ReportMetadata(    test_room="Office A", room_volume=180.0, area=60.0,    measurement_standard="ANSI/ASA S12.2",    laboratory="Phonometry Reference Laboratory",    requirement=40.0,              # adds a verdict against a target rating)room.noise_criterion(spl).report("nc_fiche.pdf", metadata=metadata)room.room_criterion(spl).report("rc_fiche.pdf", metadata=metadata)
The example fiches are regenerated with make reports and kept rendered in the
repository; click a preview to open the PDF.
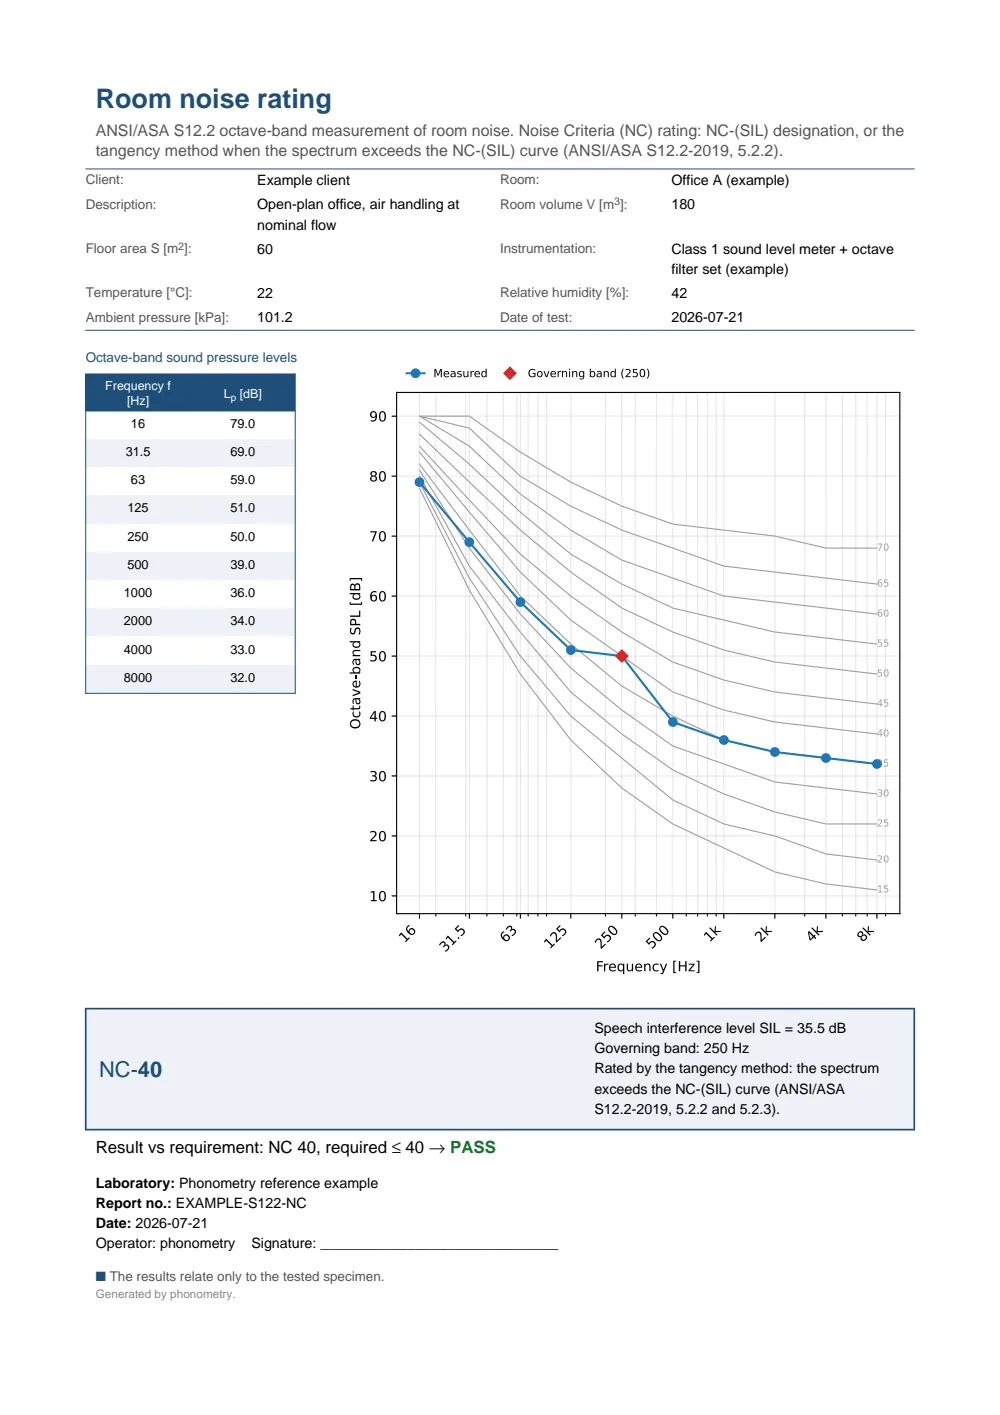
One-page room-noise assessment fiche: a metadata header (client, room, description, room volume, floor area, instrumentation and climate), the measured octave-band level table beside the measured spectrum over the NC curve family, and the boxed NC-40 rating with the 250 Hz governing band and a PASS verdict against a target of 40.
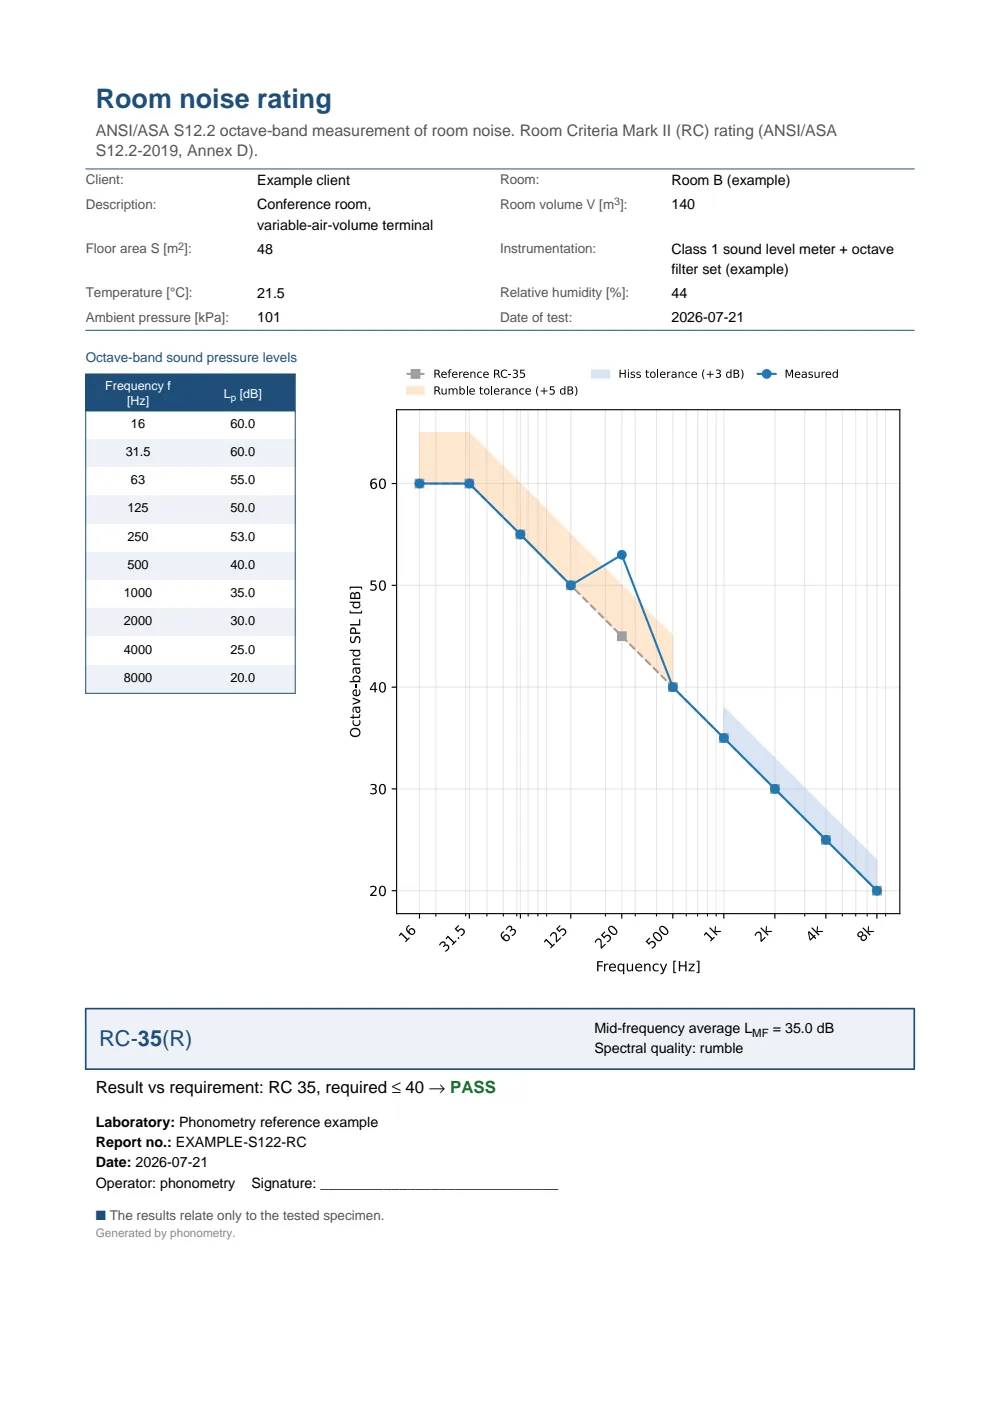
One-page room-noise assessment fiche: a metadata header, the measured octave-band level table beside the measured spectrum over the reference RC Mark II curve with the rumble and hiss tolerance bands shaded, and the boxed RC-35(R) rating with the mid-frequency average LMF and a rumble spectral quality.
See also
Section titled “See also”- API reference:
room.room_noise.
References
Section titled “References”- Acoustical Society of America. (2019). Criteria for evaluating room noise (ANSI/ASA S12.2-2019). The normative NC curves and tangency method (Table 1), plus, from the informative Annex D, the RC Mark II curves (Table D.1), the mid-frequency-average rating (clause D.4) and the neutral/rumble/hiss spectral tag (clause D.3), that this module implements.
- Beranek, L. L. (1957). Revised criteria for noise in buildings. Noise Control, 3(1), 19-27. https://doi.org/10.1121/1.2369239The paper that introduced the NC curves and the speech-interference reasoning behind them.
- Blazier, W. E. (1997). RC Mark II: A refined procedure for rating the noise of heating, ventilating, and air-conditioning (HVAC) systems in buildings. Noise Control Engineering Journal, 45(6), 243-250. https://doi.org/10.3397/1.2828446The refined RC procedure, with its neutral-spectrum rationale and the rumble/hiss regions, that ANSI/ASA S12.2 Annex D codifies.
- Kosten, C. W., & van Os, G. J. (1962). Community reaction criteria for external noises. The Control of Noise (National Physical Laboratory Symposium No. 12), 373-387. The paper that introduced the NR curve family the text contrasts with NC. Published by Her Majesty's Stationery Office; the linked record is the Open Library page.