phonometry
What this is
phonometry is a Python library for acoustic measurement, analysis and prediction. You give it a signal, a measured spectrum or a set of geometrical and material inputs; it gives you the quantity the standard defines, with the intermediate terms still visible.
Every result is a typed, frozen dataclass. It carries the inputs it was computed from, it draws its own figure with a one-line .plot() in English or Spanish, and where a standard defines a reporting format it renders a one-page PDF fiche with .report().
It is written and maintained by one person, published under the MIT licence on PyPI, archived with a DOI on Zenodo, and currently at version 4.0.0rc1. It needs Python 3.13 or newer with NumPy and SciPy. Optional extras add the rest: [plot] for the figures, [perf] for the faster impulse ballistics, [report] for the PDF fiches, and [full] for all three.
Who it is for
- Consultants and test laboratories who need the number a standard defines and the terms behind it, in a form that can go into a report.
- Researchers who need a readable, citable reference implementation rather than a black box, and who need to see which clause each formula came from.
- Audio, firmware and product engineers who need class 1 weighting and filters, distortion, loudness and speech metrics inside their own test rigs.
- Students and teachers, since every guide states the standard, the formula and the assumptions before the code.
What it is not
- Not a certified instrument. The conformance report is the library checking its own output against values published in the standards, not an accredited third-party calibration. Legal measurements still need type-approved hardware.
- Not a data-acquisition system. It processes arrays and files you supply; it does not talk to sound cards, microphones or analysers.
- Not a complete implementation of every standard it cites. Each guide states which clauses, methods and annexes are covered, and which are not.
What it looks like in use
Three things the library does that are hard to claim and easy to show: it computes wave fields and renders them, the result of an analysis draws itself, and where a standard prescribes a reporting layout, the same result renders that layout as a PDF.
An 800 Hz plane wavefront sweeps a 4 m rigid-walled hall filled with a staggered colonnade of rigid columns 10 to 17 cm across, simulated at 2.5 mm; every column diffracts the front and sheds a scattered wavelet, and the wavelets interfere until the whole hall is filled with structured energy that then drains through the absorbing ends.
An 800 Hz plane wavefront sweeps a 4 m rigid-walled hall filled with a staggered colonnade of rigid columns 10 to 17 cm across, simulated at 2.5 mm; every column diffracts the front and sheds a scattered wavelet, and the wavelets interfere until the whole hall is filled with structured energy that then drains through the absorbing ends.
An analysis, and the figure it draws
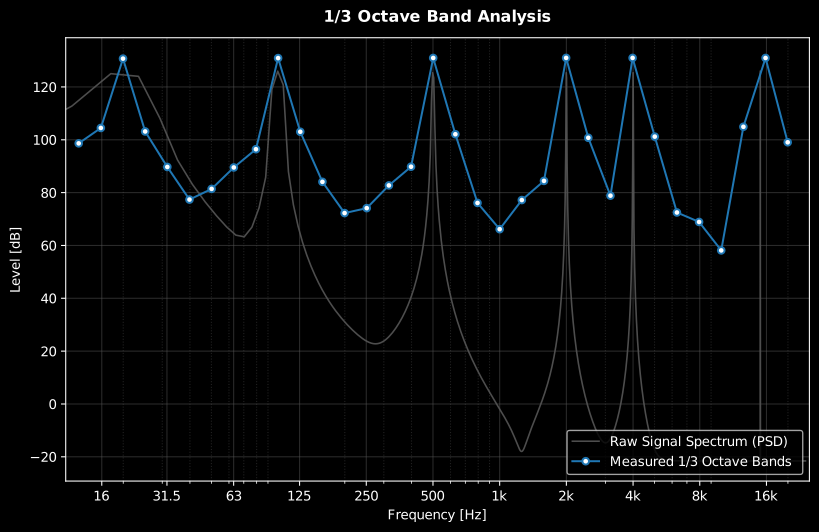
One-third-octave band levels per the IEC 61260-1 band edges, and the power spectral density of the same record — which is a result object, so one call draws it. The figure below is committed to the documentation, not a mock-up; it is drawn from a six-tone signal rather than the two-tone one in the snippet, so that the band structure is worth looking at.
import numpy as npfrom phonometry import filters, signals
fs = 48_000t = np.linspace(0, 1, fs, endpoint=False)signal = np.sin(2 * np.pi * 100 * t) + np.sin(2 * np.pi * 1000 * t)
spl, freq = filters.octave_filter(signal, fs=fs, fraction=3)
psd = signals.power_spectral_density(signal, fs=fs)ax = psd.plot()          # the result draws itself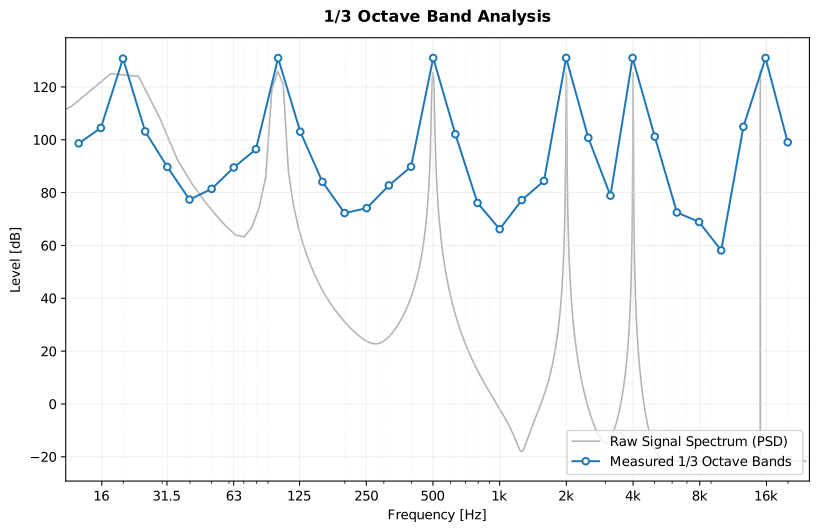
A rating, and the fiche it renders
The weighted airborne rating of ISO 717-1 over the 16 one-third-octave bands the rating uses, rendered in a laboratory report layout: metadata header, band table, the curve against the shifted reference, the boxed single-number result and the verdict against the requirement. The code is the call that renders the fiche beside it, with the metadata block cut to the fields discussed here. Reading the result: Rw is the value of the standard reference curve, at 500 Hz, after it has been shifted as far towards the measured curve as the unfavourable-deviation rule allows (their sum may reach 32.0 dB and here stops at 23.7 dB), so one number stands in for sixteen. The terms in brackets are the spectrum adaptation terms C and Ctr, which are added to Rw rather than replacing it and say how the same element performs against a pink-noise-like source and against urban road traffic: 30 and 28 dB for this pane. The verdict is a pass because the requirement was written against Rw alone; written against Rw + Ctr, as national codes for facades often are, the same pane would fail it.
import numpy as npfrom phonometry import building, ReportMetadata
freqs = np.array([100, 125, 160, 200, 250, 315,                  400, 500, 630, 800, 1000, 1250,                  1600, 2000, 2500, 3150])
R = building.single_panel_transmission_loss(    freqs, mass_per_area=15.0,    critical_frequency=2000.0, loss_factor=0.02,)
meta = ReportMetadata(    specimen="6 mm float glass pane",    laboratory="Phonometry reference example",    report_id="EXAMPLE-717-1",    requirement=30.0,  # adds the verdict row)
R.report("Rw_fiche.pdf", metadata=meta)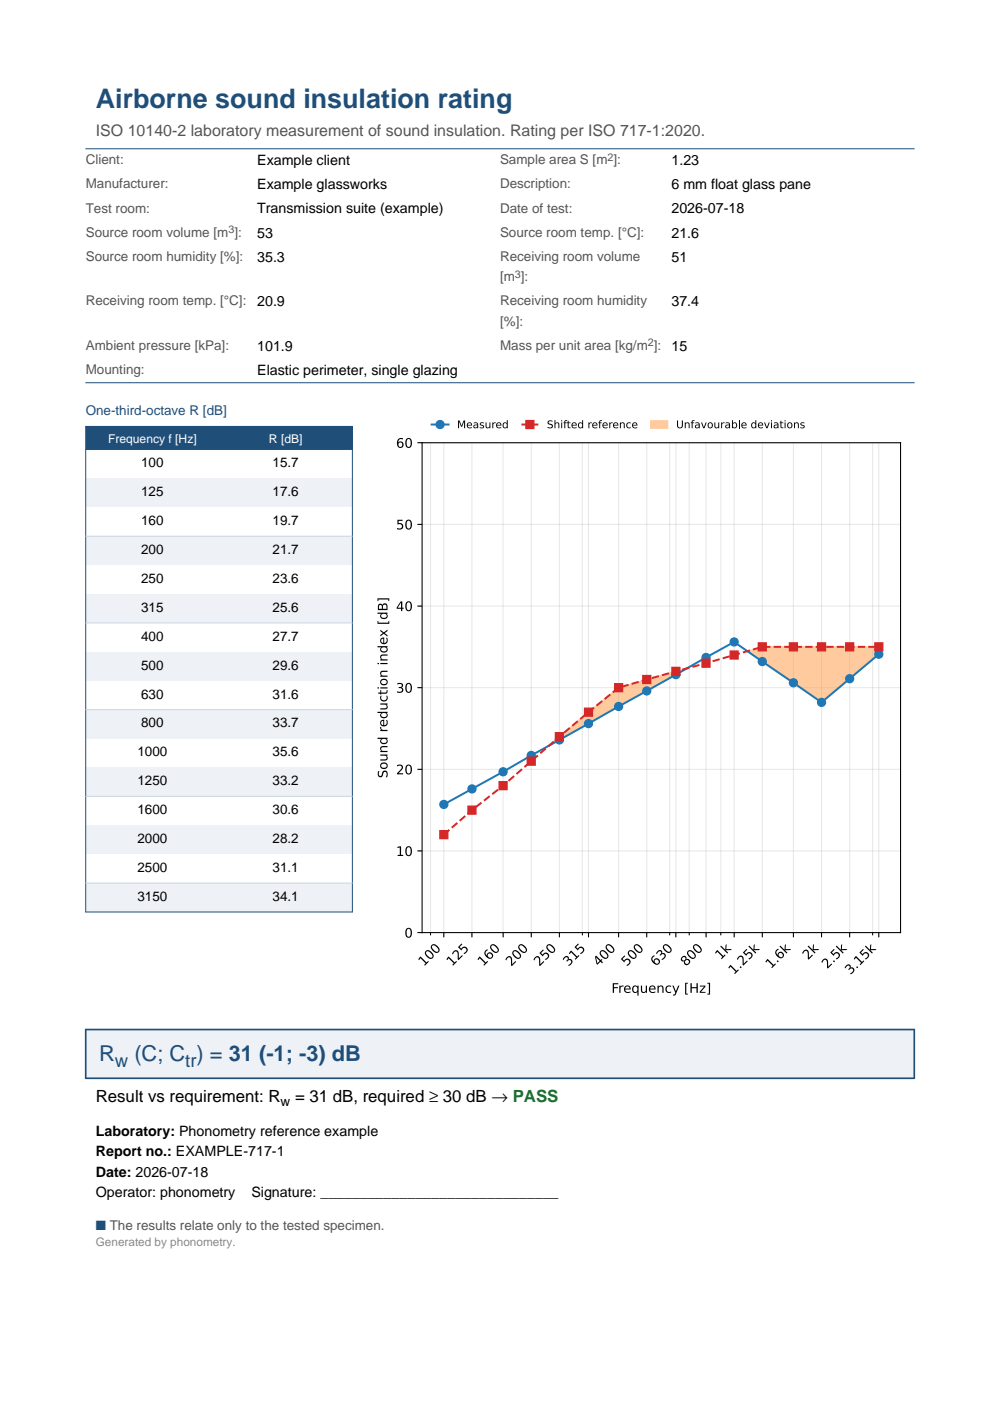
One-page airborne sound insulation fiche for a 6 mm float glass pane: a metadata header, the one-third-octave R table beside the plot of that curve against the shifted reference, the boxed result Rw (C; Ctr) = 31 (-1; -3) dB and a PASS verdict against the 30 dB requirement.
What it covers
Eleven documentation areas over nineteen import namespaces: 141 guides and 233 API reference pages. Each row links to the area overview; the designations are the standards actually implemented there, not a reading list.
| Area | Standards implemented |
|---|---|
| Signal analysisFilter banks, weighting, levels, spectra, calibration and uncertainty. | IEC 61260-1ANSI S1.11IEC 61672-1ISO 7196IEC 61252ISO 1996-1IEC 60942GUM |
| Audio filesMeasurement audio in and out: calibrated reading, provenance, streaming, BWF writing, lossless conversion. | EBU Tech 3285ITU-R BS.2088 |
| Hearing and perceptionLoudness, sound quality, speech intelligibility, hearing and exposure. | ISO 532-1/-2/-3ECMA-418-1/-2ISO 226DIN 45692IEC 60268-16ANSI S3.5DIN 45681ISO/PAS 20065ISO 7029ISO 389-7ISO 1999ISO 9612 |
| Rooms and buildingsRoom parameters, background noise, field and laboratory insulation, prediction. | ISO 3382-1/-2/-3ISO 16283-1/-2/-3ISO 10140ISO 10848ISO 15186-1/-2ISO 16251-1ISO 717-1/-2EN 12354-1…-6ISO 18233ISO 12999-1ISO 10052ANSI/ASA S12.2ASTM E413/E1414 |
| Materials and surfacesAbsorption, airflow resistance, impedance tube, porous and metamaterial models, diffusers, scattering. | ISO 354ISO 11654ISO 10534-1/-2ISO 9053-1/-2ISO 17497-1/-2ISO 13472-1/-2EN 29052-1ISO 12999-2 |
| Vibration and structure-borne soundMobility and FRFs, isolators, radiated power, junctions, human vibration. | ISO 7626-1/-2ISO 10846-1/-2/-3/-4/-5ISO 9611ISO/TS 7849-1/-2EN 15657EN 12354-5ISO 2631-1/-2/-4/-5ISO 5349-1/-2ISO 8041-1/-2 |
| Environment and transportOutdoor propagation, barriers, refraction, environmental indicators, traffic and wind-turbine sources. Of CNOSSOS-EU, the source side of Annex II: the propagation method of its section 2.5 is not implemented, and outdoor attenuation here goes through ISO 9613-2 instead. | ISO 9613-1/-2ISO 1996-1/-2ISO/PAS 1996-3NT ACOU 112CNOSSOS-EU (2002/49/EC Annex II, 2.2 and 2.3)IEC 61400-11 |
| Aircraft noiseCertification levels, airport contours and the rotorcraft hemisphere method. | ICAO Annex 16IEC 61265SAE ARP 866B/5534ECAC Doc 29ECAC Doc 32 |
| Underwater acousticsLevels re 1 µPa, ship radiated noise, pile driving, ambient noise, propagation loss. | ISO 18405ISO 17208-1/-2ISO 18406JOMOPANS-ECHO |
| Sources and devicesSound power, intensity, emission declarations, electroacoustics, programme loudness. | ISO 3741ISO 3744/3746ISO 3745ISO 9614-1/-2/-3IEC 61043ISO 4871IEC 60268-3/-4/-5ITU-R BS.1770-5EBU R 128 |
| Wave simulationDeterministic 2D FDTD solvers, acoustic and elastic P-SV, validated against analytic oracles rather than a standard. | no governing standard |
Starting from zero
Three steps, in order. The first two take a few minutes; the third is the part you keep coming back to.
Install it
Python 3.13 or newer. The base install pulls in NumPy and SciPy; the [full] extra adds the other three, [plot] for the figures, [perf] for the faster impulse ballistics and [report] for the PDF fiches.
Installation optionspip install phonometry[full]Run one analysis end to end
Getting Started splits a signal into one-third-octave bands, then anchors those bands to a calibrator tone so the levels are decibels re 20 µPa rather than decibels re nothing, and reduces them to one A-weighted level. Build a sound level meter carries the same chain to the end: the Fast ballistics, LAeq, SEL, LCpeak, the percentile levels and the class check of every stage.
Getting StartedBuild a sound level meterGo to the page for your job
What do you need to measure? is the same library indexed by the task instead of the subject: a job on the left, the guide that answers it and the standard it implements on the right. All guides is the full inventory, 141 of them grouped by topic. Each one opens with the standard it implements, the quantities that standard defines and the assumptions the implementation makes, then the runnable code and the figure it draws, and closes with a Covered / Not covered statement, so you know before you start what the page will and will not answer. When you need an exact signature rather than a method, the API reference has one page per module.
What do you need to measure?All guides