Field Insulation Measurement and Ratings
Standards: ISO 16283ISO 717ISO 12999ISO 10052Key references: Hopkins 2007Vigran 2008
This guide continues from the Room Acoustics guide: the same impulse response, measured either side of a partition, yields its sound insulation. This page covers insulation measured in the building: field airborne, impact and façade insulation with single-number ratings (ISO 16283-1/2/3, ISO 717-1/2), the measurement uncertainty that qualifies every rating (ISO 12999-1) and the quick ISO 10052 survey method. The laboratory characterisation of an element lives in Laboratory Insulation Measurement and the prediction of in-situ performance in Predicting Sound Insulation (EN 12354).
How do I compute Rw from third-octave sound reduction data in Python?
Section titled “How do I compute Rw from third-octave sound reduction data in Python?”Pass the 16 one-third-octave values from 100 Hz to 3150 Hz to
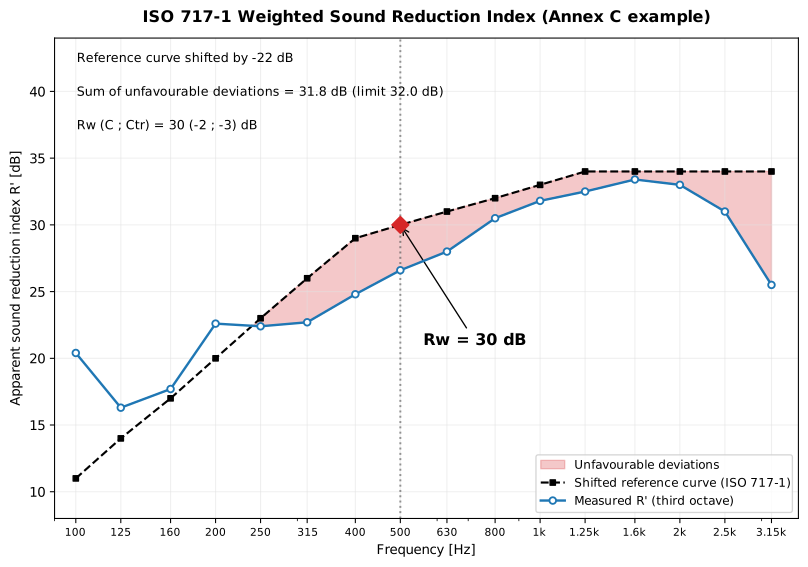
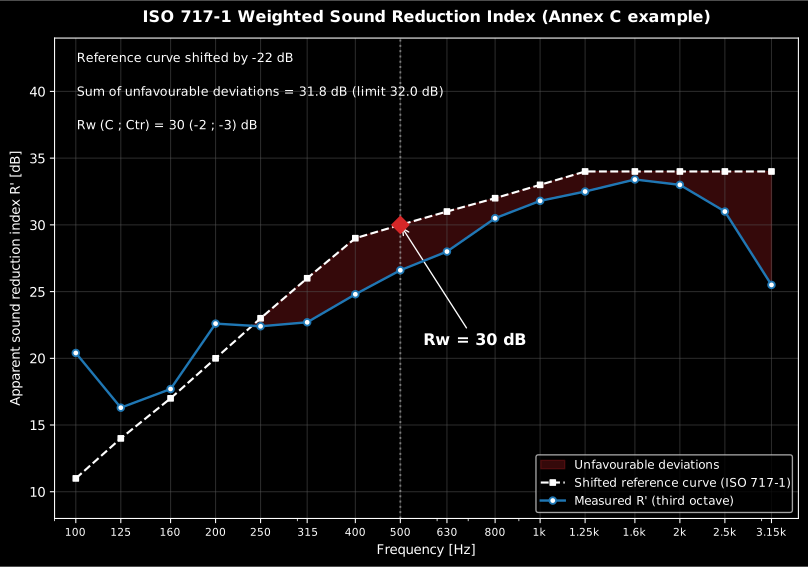
building.weighted_rating(R). It shifts the ISO 717-1 reference curve and
returns the rating read at 500 Hz, plus the spectrum adaptation terms C and
. For the measured spectrum used below, w.rating, w.c, w.ctr prints
30 -2 -3: . The same call rates , and
.
Field insulation and single-number ratings (ISO 16283-1, ISO 717-1)
Section titled “Field insulation and single-number ratings (ISO 16283-1, ISO 717-1)”To rate a wall or floor, measure the energy-average level in the source room () and the receiving room () per one-third-octave band and form the level difference . Two normalisations make it comparable between rooms. The standardized level difference references the receiving-room reverberation time to s (so with s, exactly), and the apparent sound reduction index normalises by the partition area and the Sabine absorption area :
Positions are energy-averaged with .
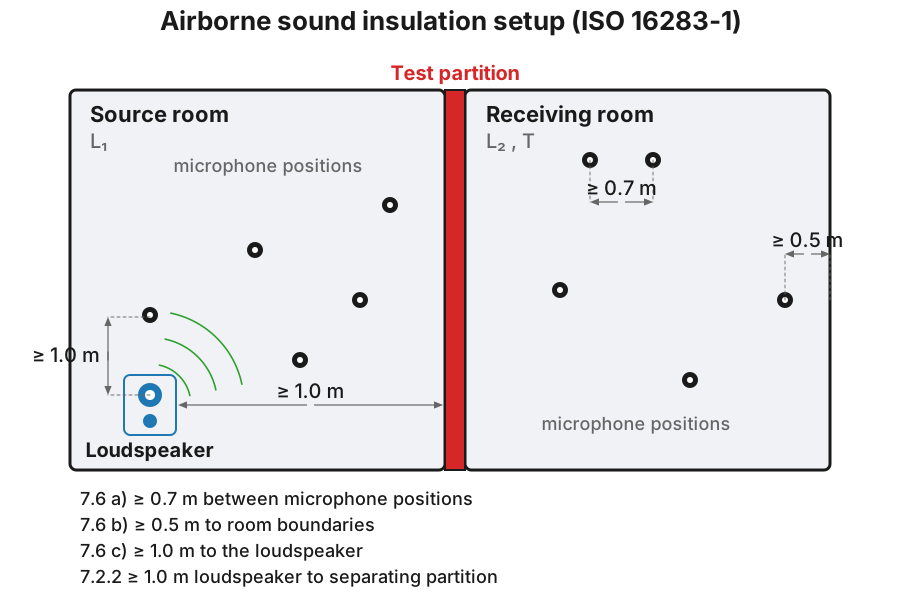
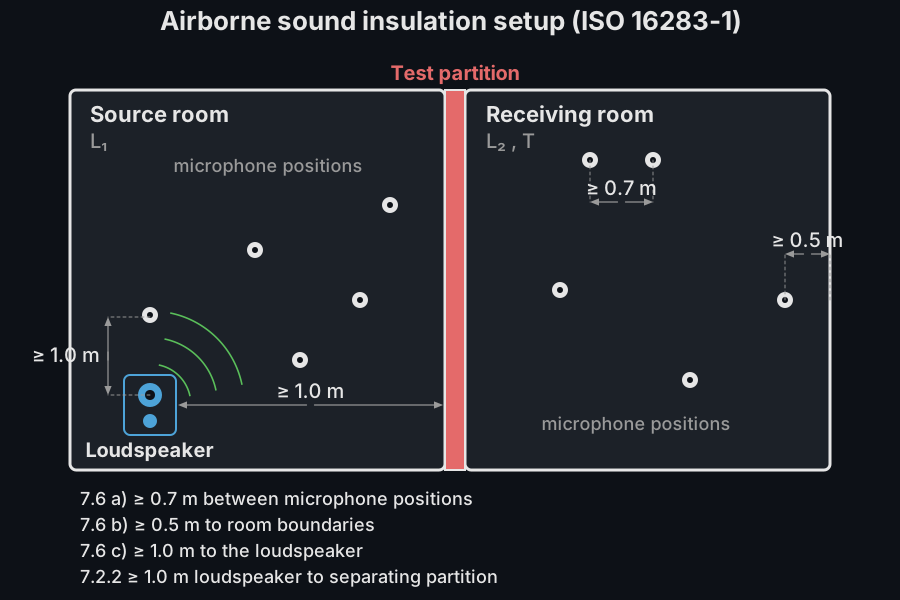
The prime on is a convention, not decoration: primed quantities (, , ) are measured in the building and include every flanking path, while the unprimed and are laboratory properties of the element alone, measured with flanking suppressed. The full lab-to-field map lives in Laboratory Insulation Measurement; the prediction that bridges the two is EN 12354.
The band spectrum is collapsed to one number by the reference-curve
method of ISO 717-1: a fixed reference curve is shifted in 1 dB steps
toward the measured curve until the sum of unfavourable deviations
(where the measurement falls below the reference) is as large as possible
but not more than 32.0 dB (16 one-third-octave bands) or 10.0 dB (5 octave
bands). The rating (Rw, R'w, DnT,w …) is the shifted reference read at
500 Hz. The spectrum adaptation terms (pink noise) and
(urban traffic) add the low-frequency penalty of a real source.
The two terms re-rate the same measured curve against the two source spectra of ISO 717-1 Annex A: against A-weighted pink noise, representative of living activities (speech, music, radio, television), and against A-weighted urban road traffic, whose energy sits at low frequency. They are defined so that the rating plus the term ( for a laboratory index, or for the field quantities of this guide, and likewise with ) is the A-weighted level difference achieved against that source. Reading them:
- stays small for most constructions (0 to −2 dB is typical): the pink spectrum is close to the weighting already implicit in the reference curve.
- punishes weak low-frequency insulation. A lightweight double leaf with its mass-air-mass resonance near 100 Hz can carry a of −5 to −10 dB, while a heavy monolithic wall with the same loses far less: two constructions with equal ratings can differ audibly against traffic.
- Design with the descriptor that matches the noise, carried by the field quantity the requirement rates: for a façade on a busy road, (or the plain rating, where the regulation says so) between dwellings, the two example requirements of ISO 717-1, 5.3.
import numpy as npfrom phonometry import building
# Energy-average several microphone positions in one room (dB)print(round(float(building.energy_average_level([60.0, 66.0])), 1))   # 64.0
# Field insulation per band; area S and volume V add R'l1 = np.full(16, 80.0)                                # source-room levelsl2 = np.full(16, 40.0)                                # receiving-room levelst2 = np.full(16, 0.5)                                 # receiving-room T (s)ins = building.airborne_insulation(l1, l2, t2, area=10.0, volume=50.0)print(round(float(ins.dnt[0]), 1))                   # 40.0  (= D since T = T0)print(round(float(ins.r_prime[0]), 1))               # 38.0
# Single-number rating from a measured 16-band R spectrum (ISO 717-1 Annex C)R = [20.4, 16.3, 17.7, 22.6, 22.4, 22.7, 24.8, 26.6,     28.0, 30.5, 31.8, 32.5, 33.4, 33.0, 31.0, 25.5]w = building.weighted_rating(R)print(w.rating, w.c, w.ctr)                          # 30 -2 -3  ->  Rw(C;Ctr) = 30(-2;-3)
w.plot()   # measured R' vs shifted ISO 717-1 reference, deviations shaded (needs matplotlib)
Show the code for this figure
import matplotlib.pyplot as pltfrom phonometry import building
# Single-number rating from a measured 16-band R spectrum (ISO 717-1 Annex C)R = [20.4, 16.3, 17.7, 22.6, 22.4, 22.7, 24.8, 26.6,     28.0, 30.5, 31.8, 32.5, 33.4, 33.0, 31.0, 25.5]w = building.weighted_rating(R)
# One line — measured curve vs the shifted ISO 717-1 reference, deviations shaded:w.plot()plt.show()
# By hand, from the band curve the result now carries:fig, ax = plt.subplots()ax.semilogx(w.band_centers, w.measured, "o-", label="Measured R'")ax.semilogx(w.band_centers, w.shifted_reference, "s--", label="Shifted reference")ax.fill_between(w.band_centers, w.measured, w.shifted_reference,                where=w.measured < w.shifted_reference, interpolate=True,                alpha=0.3, label="Unfavourable deviations")ax.set_xlabel("Frequency [Hz]")ax.set_ylabel("Sound reduction index [dB]")ax.set_title(f"Rw = {w.rating} dB  (C={w.c:+d}; Ctr={w.ctr:+d})")ax.legend()plt.show()
Compute l1, l2 and t2 on the same 16 one-third-octave bands from
100 Hz to 3150 Hz (obtain t2 from
room_parameters(ir, fs, limits=(100, 3150), fraction=3).t30, for example) and
pass them to airborne_insulation. Feed that function’s dnt (or r_prime)
spectrum to weighted_rating, so every band aligns index-by-index with the
ISO 717-1 reference curve.
airborne_insulation() parameters
Section titled “airborne_insulation() parameters”| Parameter | Type | Units | Range / default | Notes |
|---|---|---|---|---|
l1 | 1D or 2D array | dB | one/band, or (positions, bands) | Source-room levels (2D is energy-averaged) |
l2 | 1D or 2D array | dB | same band count | Receiving-room levels |
t2 | 1D array | s | > 0, one per band | Receiving-room reverberation time |
area | float, optional | m² | > 0, with volume | Partition area S (enables R') |
volume | float, optional | m³ | > 0, with area | Receiving-room volume V |
t0 | float | s | default 0.5 | Reference reverberation time T0 |
weighted_rating() parameters
Section titled “weighted_rating() parameters”| Parameter | Type | Units | Range / default | Notes |
|---|---|---|---|---|
values_by_band | 1D array | dB | 16 (thirds) or 5 (octaves) | Measured R, R', DnT … per band |
bands | str or None | — | 'third-octave' / 'octave' / None | None infers from the count |
airborne_insulation() returns an AirborneInsulationResult (d, dnt,
r_prime or None); weighted_rating() returns a WeightedRatingResult
(rating, c, ctr, unfavourable_sum, all integers except the sum).
Enlarged frequency ranges and one-decimal ratings
Section titled “Enlarged frequency ranges and one-decimal ratings”When the measurement covers more than the core 100–3150 Hz bands, ISO 717-1
Annex B defines additional adaptation terms with the range as a subscript
(, , and the
counterparts), computed with the Table B.1 spectra over the enlarged
range. weighted_rating_extended takes the band values with their centre
frequencies and returns the core rating plus every extended term the input
covers (the impact counterpart weighted_impact_rating_extended adds
). With one_decimal=True the reference curve shifts in
0.1 dB steps and all reductions keep one decimal: the variant ISO 717
prescribes “for the expression of uncertainty” and ISO 12999-1 Annex B
requires when stating the uncertainty of a single-number value.
from phonometry import building
# Single-number rating from a measured 16-band R spectrum (ISO 717-1 Annex C)R = [20.4, 16.3, 17.7, 22.6, 22.4, 22.7, 24.8, 26.6,     28.0, 30.5, 31.8, 32.5, 33.4, 33.0, 31.0, 25.5]
freqs = [50, 63, 80, 100, 125, 160, 200, 250, 315, 400, 500,         630, 800, 1000, 1250, 1600, 2000, 2500, 3150, 4000, 5000]r_ext = [18.7, 19.2, 20.0, *R, 26.8, 29.2]     # ISO 717-1 Annex C, Table C.2ext = building.weighted_rating_extended(r_ext, freqs)print(ext.rating, ext.c, ext.ctr, ext.c_50_5000, ext.ctr_50_5000)# 30 -2 -3 -2 -4   ->  Rw(C;Ctr;C50-5000;Ctr,50-5000) = 30(-2;-3;-2;-4)
one_dp = building.weighted_rating_extended(r_ext, freqs, one_decimal=True)print(one_dp.rating)   # 30.0, the 0.1 dB-step rating for uncertainty statements
ext.plot()   # enlarged-range curve vs the shifted core reference, Annex B terms in the title (needs matplotlib)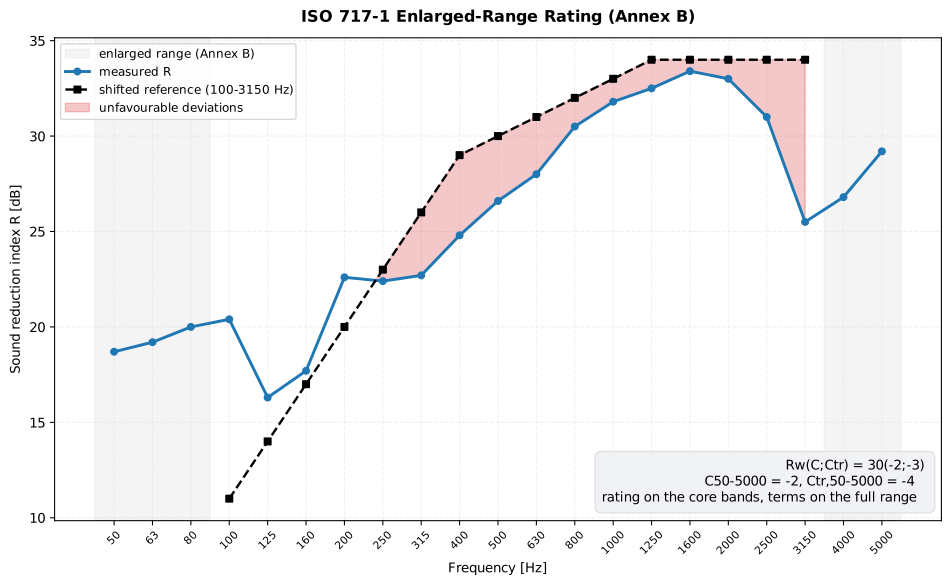
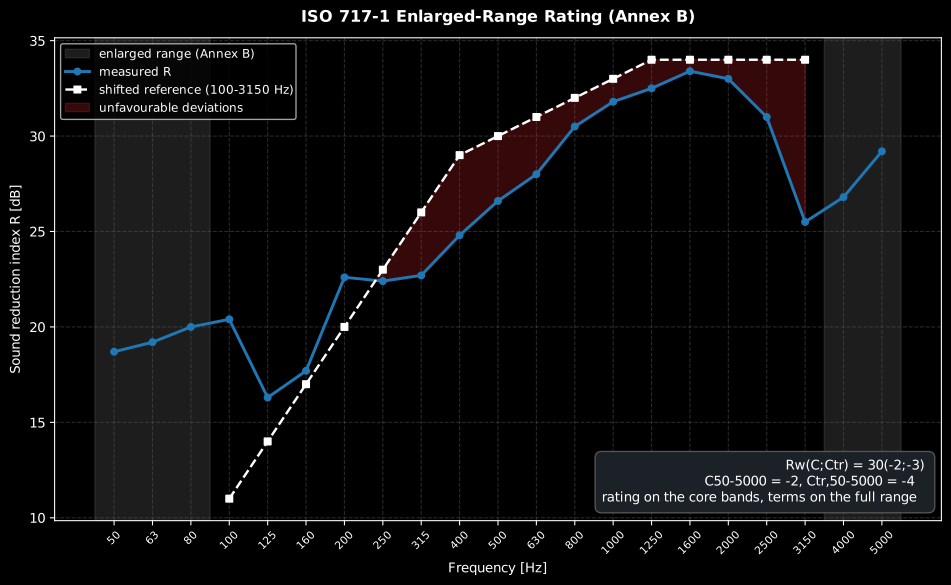
The rating itself is still evaluated on the 16 core bands (100–3150 Hz); the enlarged bands only enter the Annex B adaptation terms, so the shifted reference curve stops at the core-range edges while the measured curve continues into the shaded enlarged range.
Show the code for this figure
import matplotlib.pyplot as pltfrom phonometry import building
# Single-number rating from a measured 16-band R spectrum (ISO 717-1 Annex C)R = [20.4, 16.3, 17.7, 22.6, 22.4, 22.7, 24.8, 26.6,     28.0, 30.5, 31.8, 32.5, 33.4, 33.0, 31.0, 25.5]freqs = [50, 63, 80, 100, 125, 160, 200, 250, 315, 400, 500,         630, 800, 1000, 1250, 1600, 2000, 2500, 3150, 4000, 5000]r_ext = [18.7, 19.2, 20.0, *R, 26.8, 29.2]     # ISO 717-1 Annex C, Table C.2ext = building.weighted_rating_extended(r_ext, freqs)
# One line — the enlarged-range curve vs the shifted core reference:ext.plot()plt.show()
# By hand, from the band curves the result carries (the full enlarged-range# curve on ext, the core-band reference on ext.core):fig, ax = plt.subplots()ax.semilogx(ext.band_centers, ext.measured, "o-", label="Measured R")ax.semilogx(ext.core.band_centers, ext.core.shifted_reference, "s--",            label="Shifted reference (core bands)")ax.fill_between(ext.core.band_centers, ext.core.measured,                ext.core.shifted_reference,                where=ext.core.measured < ext.core.shifted_reference,                interpolate=True, alpha=0.3, label="Unfavourable deviations")ax.set_xlabel("Frequency [Hz]")ax.set_ylabel("Sound reduction index [dB]")ax.set_title(f"Rw = {ext.rating} dB  (C50-5000={ext.c_50_5000:+g}; "             f"Ctr,50-5000={ext.ctr_50_5000:+g})")ax.legend()plt.show()
Impact sound (ISO 16283-2, ISO 717-2)
Section titled “Impact sound (ISO 16283-2, ISO 717-2)”Footstep noise is rated the other way round. Instead of how much a floor blocks, impact insulation measures how much a standardized tapping machine on the floor above puts into the room below, so a higher number is worse. The energy-average impact sound pressure level in the receiving room is normalised like the airborne case, but with a sign flip on the reverberation term:
The standardized impact level ( s for dwellings) needs only the receiving-room , so with s it equals ; the normalized level (referenced to a 10 m² absorption area) also needs the receiving-room volume. Note the minus sign: more reverberation lowers , opposite to the airborne .
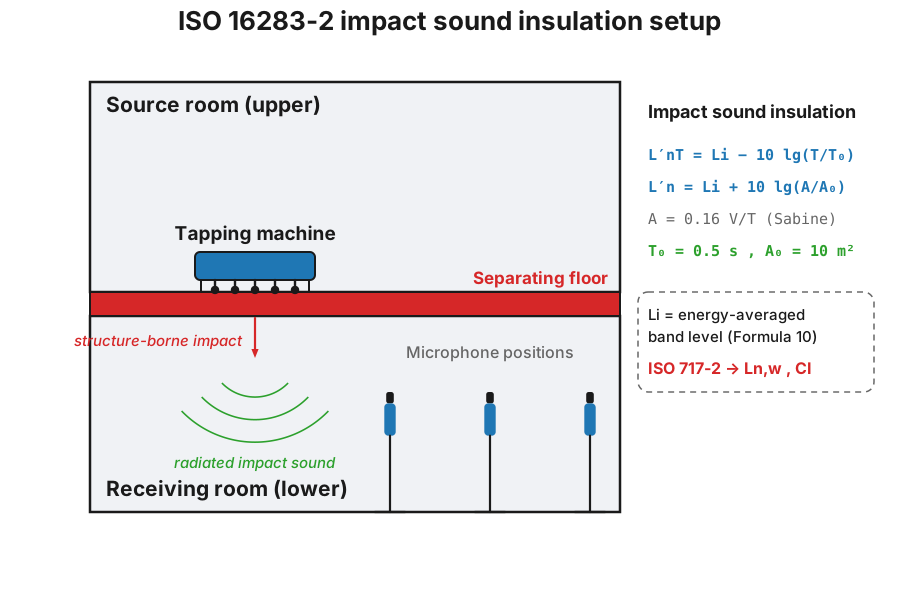
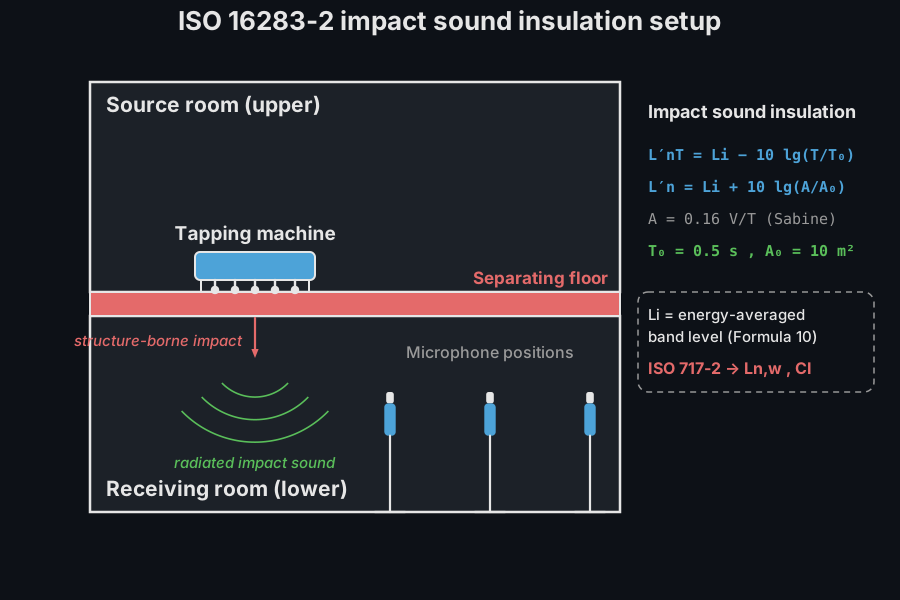
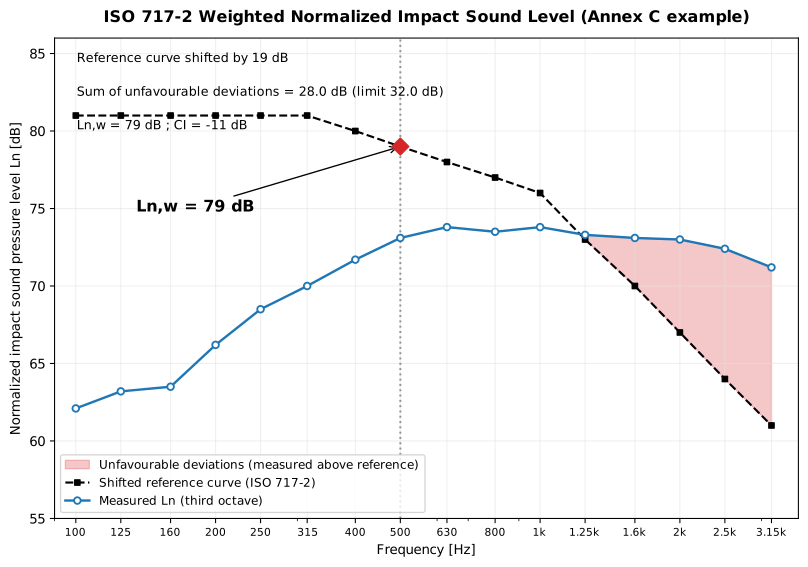
The single-number rating (ISO 717-2) shifts the same style of reference curve,
but an unfavourable deviation now occurs where the measurement exceeds the
reference (impact noise is worse when higher), the sign opposite to
ISO 717-1. The rating (Ln,w, L'n,w, L'nT,w) is the shifted reference read
at 500 Hz; for octave bands it is then reduced by 5 dB. The spectrum
adaptation term uses the energetic sum
over 100–2500 Hz (the first 15 thirds, excluding 3150 Hz) or 125–2000 Hz
(octaves).
For measurements extended down to 50 Hz,
weighted_impact_rating_extended additionally returns the enlarged-range
term (A.2.1 NOTE), and with one_decimal=True the
0.1 dB-step rating used in uncertainty statements (it reproduces the printed
dB and dB of A.2.2).
import numpy as npfrom phonometry import building
# 16 one-third-octave impact levels Li (100 Hz - 3150 Hz), dB, from the# ISO 717-2 Annex C worked example, and the receiving-room T per band.li = np.array([62.1, 63.2, 63.5, 66.2, 68.5, 70.0, 71.7, 73.1,               73.8, 73.5, 73.8, 73.3, 73.1, 73.0, 72.4, 71.2])t2 = np.full(16, 0.5)
imp = building.impact_insulation(li, t2, volume=50.0)print(round(float(imp.l_n_t[0]), 1))          # 62.1  (= Li since T = T0)print(round(float(imp.l_n[0]), 1))            # 64.1  normalized to A0 = 10 m^2
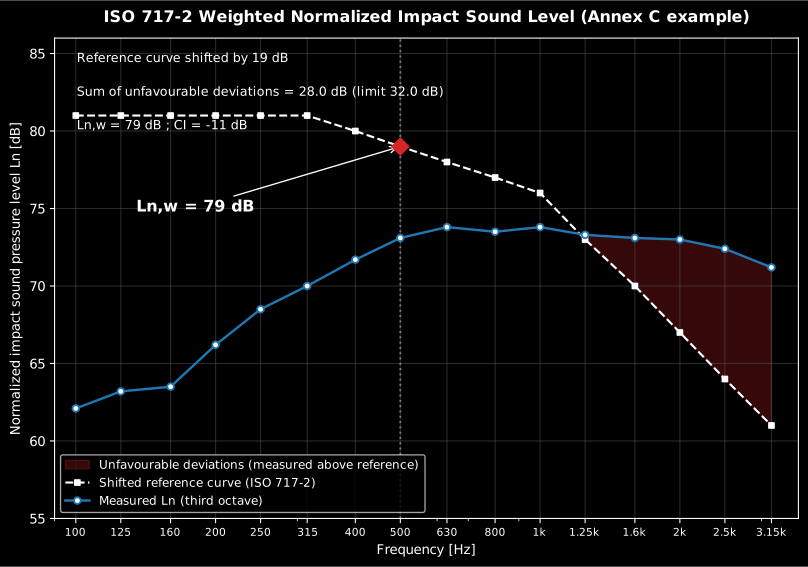
# Weighted impact rating + spectrum adaptation term CI (ISO 717-2)res_imp = building.weighted_impact_rating(imp.l_n_t)print(res_imp.rating, res_imp.ci, res_imp.unfavourable_sum)   # 79 -11 28.0  ->  L'nT,w(CI)=79(-11)
# Octave-band data carry the extra -5 dB reduction (Clause 4.3.2)octave = np.array([65.3, 64.5, 58.0, 55.8, 43.0])print(building.weighted_impact_rating(octave).rating)  # 54
res_imp.plot()   # measured L'nT vs shifted ISO 717-2 reference, measured-above shaded (needs matplotlib)
Show the code for this figure
import matplotlib.pyplot as pltimport numpy as npfrom phonometry import building
# 16 one-third-octave impact levels Li (100 Hz - 3150 Hz), dB, from the# ISO 717-2 Annex C worked example, and the receiving-room T per band.li = np.array([62.1, 63.2, 63.5, 66.2, 68.5, 70.0, 71.7, 73.1,               73.8, 73.5, 73.8, 73.3, 73.1, 73.0, 72.4, 71.2])t2 = np.full(16, 0.5)imp = building.impact_insulation(li, t2, volume=50.0)# Weighted impact rating + spectrum adaptation term CI (ISO 717-2)res_imp = building.weighted_impact_rating(imp.l_n_t)
# One line — measured L'nT vs the shifted ISO 717-2 reference (measured-above shaded):res_imp.plot()plt.show()
# By hand, from the band curve the result now carries (note the opposite sign:# an unfavourable deviation is where the MEASURED level exceeds the reference).# Here the input was l_n_t, so the rated quantity is the field level L'nT,w:fig, ax = plt.subplots()ax.semilogx(res_imp.band_centers, res_imp.measured, "o-", label="Measured L'nT")ax.semilogx(res_imp.band_centers, res_imp.shifted_reference, "s--", label="Shifted reference")ax.fill_between(res_imp.band_centers, res_imp.shifted_reference, res_imp.measured,                where=res_imp.measured > res_imp.shifted_reference, interpolate=True,                alpha=0.3, label="Unfavourable deviations")ax.set_xlabel("Frequency [Hz]")ax.set_ylabel("Impact sound pressure level [dB]")ax.set_title(f"L'nT,w = {res_imp.rating} dB  (CI={res_imp.ci:+d})")ax.legend()plt.show()
Feed impact_insulation’s l_n_t (or l_n) straight into
weighted_impact_rating; the rating and CI reproduce the ISO 717-2 Annex C
values (thirds L'nT,w = 79, CI = −11; octave 54, CI = 0).
impact_insulation() parameters
Section titled “impact_insulation() parameters”| Parameter | Type | Units | Range / default | Notes |
|---|---|---|---|---|
li | 1D or 2D array | dB | one/band, or (positions, bands) | Energy-average impact SPL (2D is averaged over positions) |
t2 | 1D array | s | > 0, one per band | Receiving-room reverberation time |
volume | float, optional | m³ | > 0 | Receiving-room V (enables L'n) |
t0 | float | s | default 0.5 | Reference reverberation time T0 |
weighted_impact_rating() parameters
Section titled “weighted_impact_rating() parameters”| Parameter | Type | Units | Range / default | Notes |
|---|---|---|---|---|
values_by_band | 1D array | dB | 16 (thirds) or 5 (octaves) | Measured Ln, L'n or L'nT per band |
bands | str or None | — | 'third-octave' / 'octave' / None | None infers from the count |
impact_insulation() returns an ImpactInsulationResult (l_n_t, l_n or
None); weighted_impact_rating() returns an ImpactRatingResult (rating,
ci integers, unfavourable_sum in dB).
ISO 717 report (.report())
Section titled “ISO 717 report (.report())”Both rating results render a one-page PDF fiche laid out like an
accredited-laboratory test report through a report(path) method: a
standard-basis line (measurement standard plus the ISO 717 rating part), an
optional metadata header block, the one-third-octave table beside the
measured-versus-shifted-reference plot (the result’s own .plot()), the boxed
single-number result, an optional verdict row and a footer with the fixed
disclaimer. WeightedRatingResult.report() labels the airborne ISO 717-1 fiche
(Rw (C; Ctr), deviations where the reference is above the measurement);
ImpactRatingResult.report() labels the impact ISO 717-2 fiche (Ln,w (CI),
deviations the opposite way). SoundReductionResult.report() is a convenience
that rates the predicted R(f) and writes its fiche in one call.
The report metadata is supplied as a ReportMetadata frozen dataclass (every
field optional; only the supplied fields are rendered, and the numeric fields
must be finite and positive). Passing metadata=None produces a lightweight
prediction fiche (body, result and disclaimer only). When
metadata.requirement is set, a verdict row is added: an airborne rating passes
when it is at or above the requirement, an impact rating when it is at or below
it (a lower impact level is better). Setting verbose=True swaps the two-column
f | value table for the ISO 717 Annex C columns (frequency, measured value,
shifted reference, unfavourable deviation).
Rendering needs reportlab, kept out of the runtime dependencies as the optional
phonometry[report] extra (pip install phonometry[report]); a missing
reportlab raises a clear ImportError with the install command, and the plot
still needs matplotlib (phonometry[plot]). Only engine="reportlab" is
supported; any other engine raises ValueError. The fiche renders in English by
default; pass language="es" for a Spanish fiche (translated fixed strings and
a comma decimal separator), e.g.
building.weighted_rating(R).report("Rw_fiche_es.pdf", language="es").
from phonometry import building, ReportMetadata
# Airborne rating from a measured 16-band R spectrum (ISO 717-1)R = [20.4, 16.3, 17.7, 22.6, 22.4, 22.7, 24.8, 26.6,     28.0, 30.5, 31.8, 32.5, 33.4, 33.0, 31.0, 25.5]metadata = ReportMetadata(    specimen="200 mm reinforced-concrete wall",    client="Acoustic Test Client Ltd.",    area=10.0, mass_per_area=460.0,    source_volume=53.0, receiving_volume=51.0,    temperature=21.5, relative_humidity=45.0, pressure=101.3,    test_room="Transmission suite T1",    measurement_standard="ISO 10140-2",    test_date="2026-07-18",    laboratory="Phonometry Reference Laboratory",    operator="J. M. Requena-Plens",    report_id="PHN-2026-0042",    requirement=42.0,          # adds the PASS/FAIL verdict row)building.weighted_rating(R).report(    "Rw_fiche.pdf", metadata=metadata)                                                           # Rw (C; Ctr)
# Impact rating from a measured 16-band L'nT spectrum (ISO 717-2)l_nt = [45.0, 47.0, 48.0, 49.0, 51.0, 52.0, 53.0, 54.0,        55.0, 56.0, 57.0, 58.0, 55.0, 52.0, 49.0, 46.0]building.weighted_impact_rating(l_nt).report("Lnw_fiche.pdf")  # Ln,w (CI)
Both example fiches are regenerated with make reports and kept rendered in the
repository; click either preview to open the PDF.
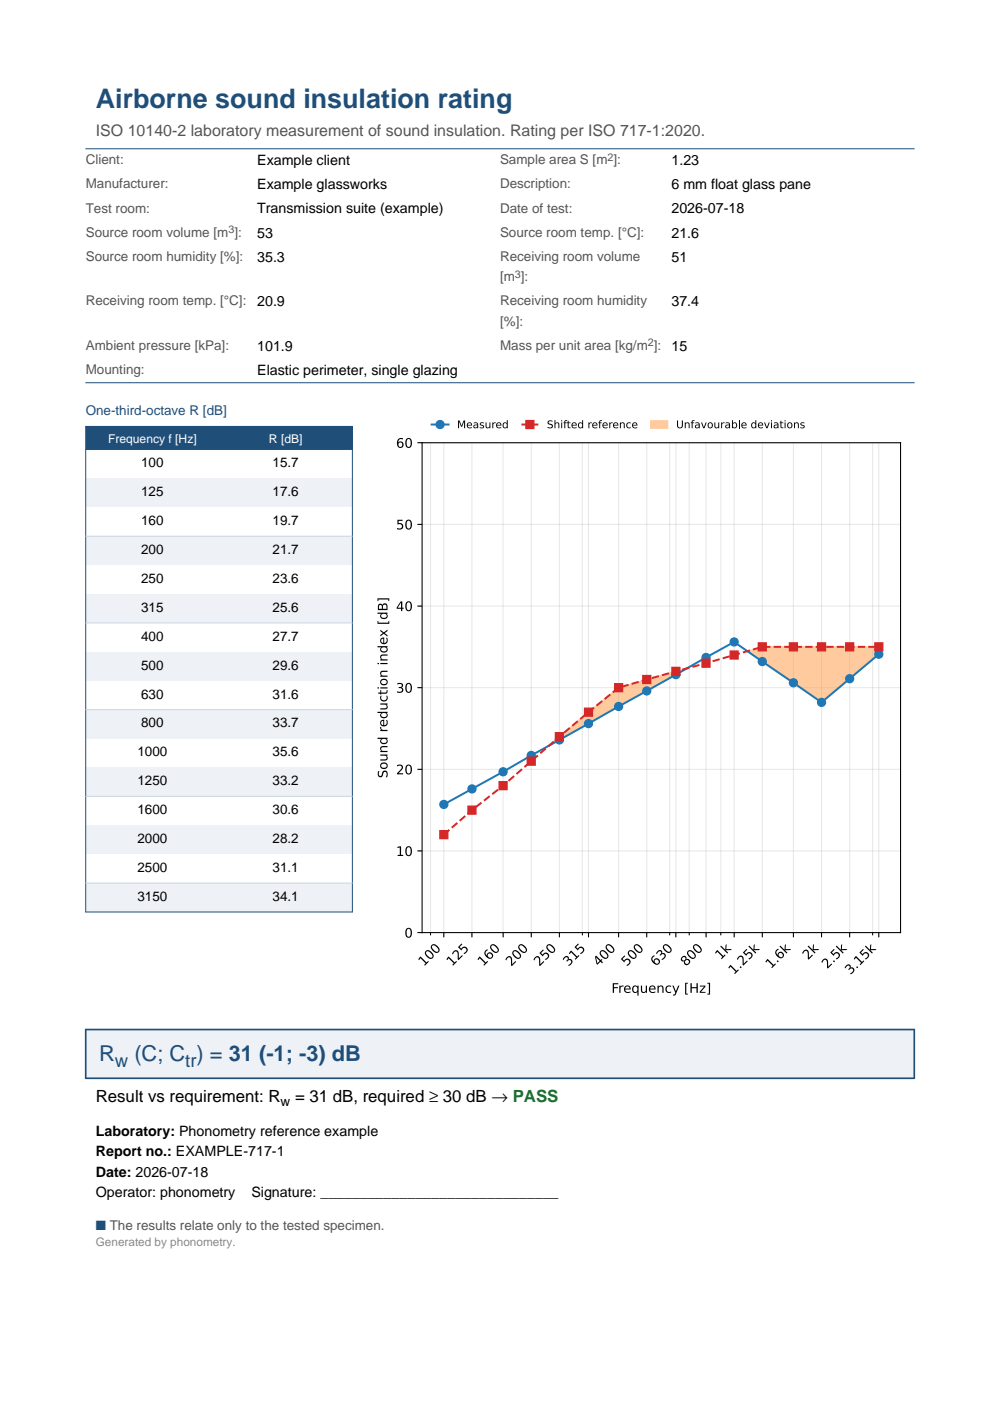
One-page airborne sound insulation fiche: a metadata header (client, specimen, sample area, room volumes, per-room temperature and humidity, ambient pressure and mounting), the one-third-octave R table beside the measured-versus-shifted-reference plot, the boxed Rw (C; Ctr) single-number result and a PASS verdict against the 30 dB requirement.
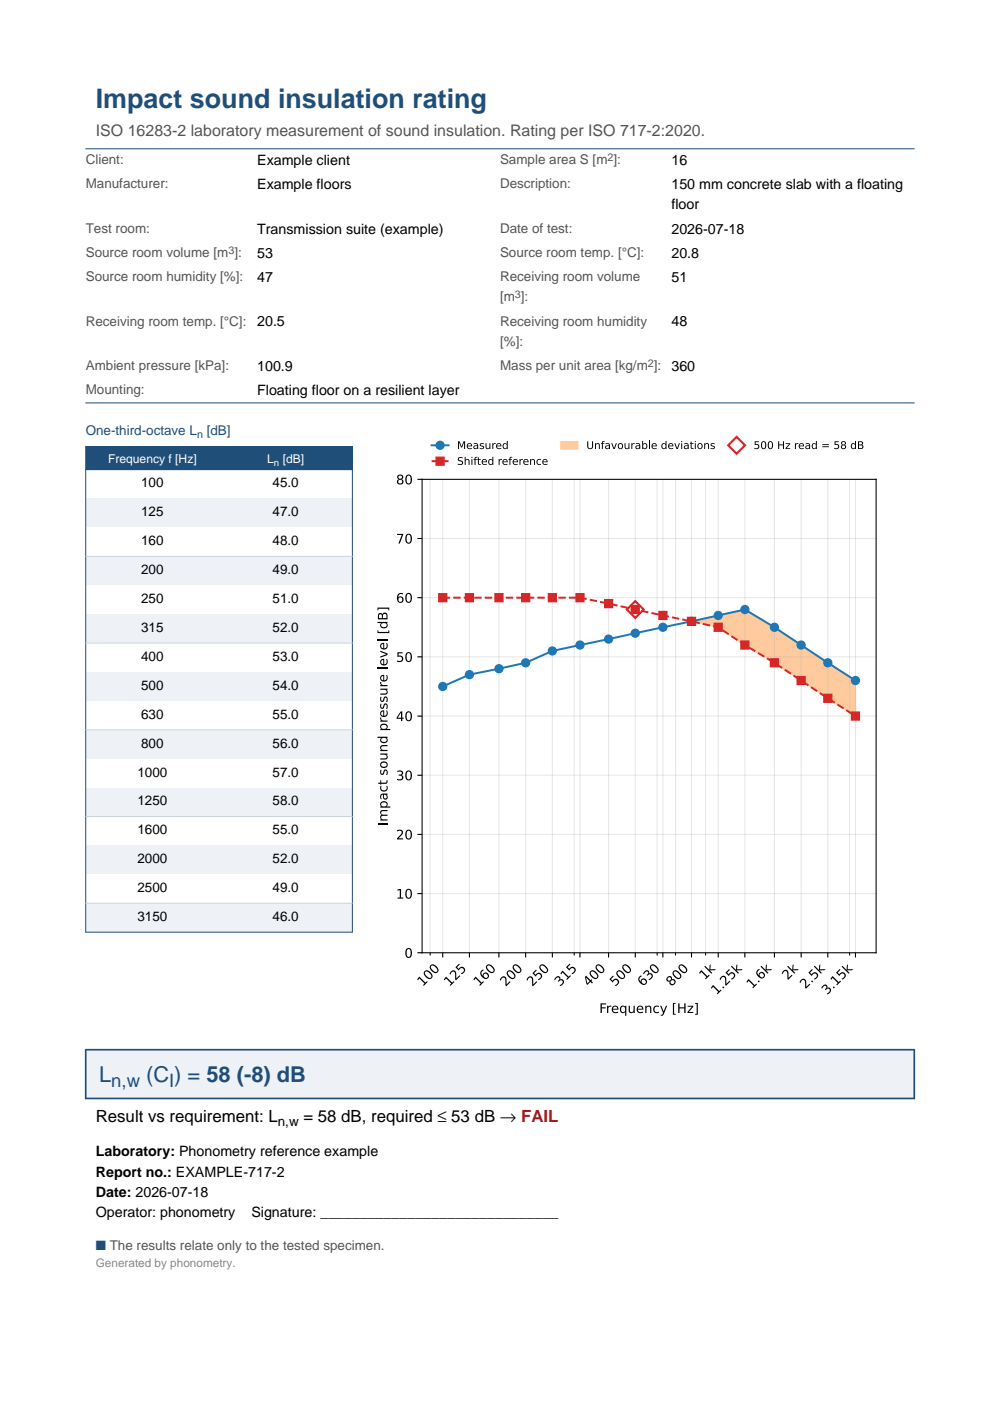
One-page impact sound insulation fiche in the same accredited layout for the normalized impact sound pressure level Ln: the metadata header, the one-third-octave Ln table beside the measured-versus-shifted-reference plot with the 500 Hz read-off, the boxed Ln,w (CI) single-number result and a FAIL verdict against the 53 dB requirement (a lower impact level is better).
Report metadata (ReportMetadata)
Section titled “Report metadata (ReportMetadata)”Every field is optional and only the supplied ones are rendered, so the same object drives a full accredited fiche and a lightweight prediction fiche. The numeric fields are validated on construction by physical range.
| Field | Type | Rendered as |
|---|---|---|
specimen, client, mounted_by, manufacturer | str | Header identity of the tested element and who it was tested for / mounted by |
area, mass_per_area | float > 0 | Sample area (m²) and measured mass per unit area (kg/m²) |
source_volume, receiving_volume | float > 0 | Room volumes (m³) |
temperature, relative_humidity, pressure | float | Single representative climate: air temperature (°C, any sign), relative humidity (0–100 %), ambient pressure (kPa, > 0) |
source_temperature, source_relative_humidity, receiving_temperature, receiving_relative_humidity | float | Per-room climate when source and receiving rooms are reported separately (same ranges as above) |
test_room, mounting, measurement_standard, test_date | str | Facility, mounting condition, the measurement standard (forms the standard-basis line) and the test date |
laboratory, operator, report_id, notes | str | Footer: institute, operator signature line, report number and free-form remarks |
requirement | float > 0 | Target single number; adds the verdict row (airborne passes at or above it, impact at or below it) |
ISO 16283 field test report (.report())
Section titled “ISO 16283 field test report (.report())”The per-band field results write the test report of ISO 16283-1:2014 /
ISO 16283-2:2020 Clause 14 directly, laid out like the recommended results
forms (Annex B / Annex C) and the accredited field reports built on them.
AirborneInsulationResult.report() renders the standardized level difference
fiche (Figure B.1) or, with quantity="r_prime", the apparent sound
reduction index fiche (Figure B.2); ImpactInsulationResult.report()
renders the standardized fiche (Figure C.1) or, with
quantity="l_n", the normalized fiche (Figure C.2). Each fiche names
the field standard in its basis line, evaluates the ISO 717-1 / ISO 717-2
single-number rating over the 16 core one-third-octave bands (100–3150 Hz),
states the quantity to one decimal place both in tabular form and as a curve
against the shifted reference curve (Clause 12), boxes the field rating
(DnT,w (C; Ctr), R'w (C; Ctr), L'nT,w (CI) or L'n,w (CI)) and prints
the mandatory statement that the evaluation is based on field measurement
results obtained by an engineering method.
verbose=True swaps the two-column table for the per-band measurement chain
(the energy-average and , or , and the reverberation time
beside the reported quantity), the content accredited field reports annex;
it needs a result built by airborne_insulation() / impact_insulation(),
which retain those inputs on the result (l1, l2/li, t2, t0).
Metadata, the requirement verdict (airborne passes at or above it, impact at
or below it), language="es" and the phonometry[report] extra behave
exactly as in the ISO 717 fiche above.
import numpy as npfrom phonometry import building, ReportMetadata
# Field airborne: source/receiving levels and T per one-third-octave bandl1 = np.array([92.3, 93.1, 94.0, 94.4, 94.8, 95.0, 95.2, 95.4,               95.3, 95.1, 94.8, 94.4, 93.9, 93.3, 92.5, 91.6])l2 = l1 - np.array([38.2, 40.1, 42.6, 45.2, 47.8, 50.1, 52.3, 54.0,                    55.6, 57.1, 58.2, 59.0, 59.6, 60.1, 60.3, 59.8])t2 = np.array([0.62, 0.58, 0.55, 0.53, 0.52, 0.50, 0.49, 0.48,               0.47, 0.46, 0.45, 0.45, 0.44, 0.43, 0.43, 0.42])field = building.airborne_insulation(l1, l2, t2, area=12.5, volume=30.4)field.plot()   # per-band DnT (and R') of the measured chain (needs matplotlib)metadata = ReportMetadata(    specimen="Separating wall, 240 mm brick with independent lining",    client="Example client",    area=12.5, source_volume=32.1, receiving_volume=30.4,    test_room="Dwelling A living room to dwelling B living room",    test_date="2026-07-20",    laboratory="Phonometry Reference Laboratory",    report_id="PHN-2026-0143",    requirement=50.0,               # DnT,w >= 50 dB -> PASS/FAIL row)field.report("DnTw_field.pdf", metadata=metadata)      # DnT,w (C; Ctr)field.report("Rpw_field.pdf", quantity="r_prime",             metadata=metadata)                        # R'w (C; Ctr)field.report("DnTw_chain.pdf", metadata=metadata,             verbose=True)                             # f | L1 | L2 | T | DnT
# Field impact: tapping-machine levels in the receiving roomli = np.array([58.0, 60.5, 62.0, 63.5, 65.0, 66.0, 66.5, 66.0,               65.5, 65.0, 64.0, 62.0, 59.0, 56.0, 53.0, 50.0])imp = building.impact_insulation(li, t2, volume=30.4)imp.report("LnTw_field.pdf",           metadata=ReportMetadata(requirement=58.0))  # L'nT,w (CI)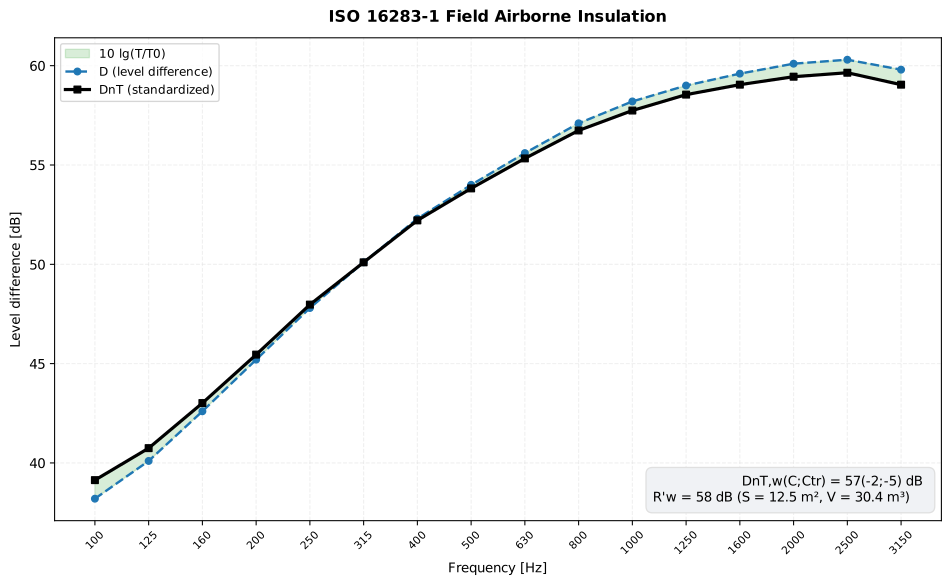
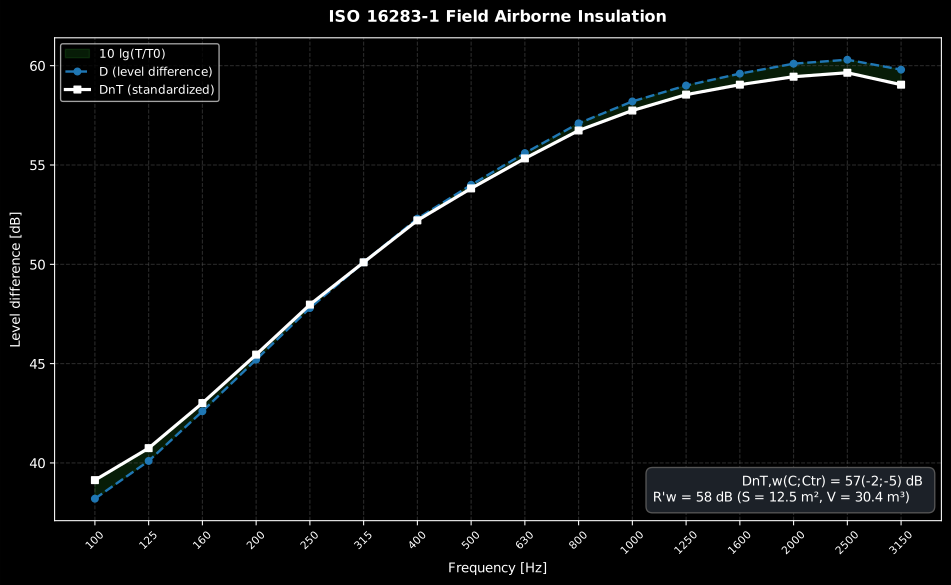
The receiving-room reverberation time turns the raw level difference into the standardized band by band; with above s across the range, the correction lifts the curve slightly. The rating box carries both single numbers of this measurement, and .
Show the code for this figure
import matplotlib.pyplot as pltimport numpy as npfrom phonometry import building
# Field airborne: source/receiving levels and T per one-third-octave bandl1 = np.array([92.3, 93.1, 94.0, 94.4, 94.8, 95.0, 95.2, 95.4,               95.3, 95.1, 94.8, 94.4, 93.9, 93.3, 92.5, 91.6])l2 = l1 - np.array([38.2, 40.1, 42.6, 45.2, 47.8, 50.1, 52.3, 54.0,                    55.6, 57.1, 58.2, 59.0, 59.6, 60.1, 60.3, 59.8])t2 = np.array([0.62, 0.58, 0.55, 0.53, 0.52, 0.50, 0.49, 0.48,               0.47, 0.46, 0.45, 0.45, 0.44, 0.43, 0.43, 0.42])field = building.airborne_insulation(l1, l2, t2, area=12.5, volume=30.4)
# One line — the per-band DnT (and R') of the measured chain:field.plot()plt.show()
# By hand, from the result's fields:bands = [100, 125, 160, 200, 250, 315, 400, 500,         630, 800, 1000, 1250, 1600, 2000, 2500, 3150]x = np.arange(len(bands))w = building.weighted_rating(field.dnt)fig, ax = plt.subplots()ax.fill_between(x, field.d, field.dnt, alpha=0.2, label="10 lg(T/T0)")ax.plot(x, field.d, "--o", label="D (level difference)")ax.plot(x, field.dnt, "-s", label="DnT (standardized)")ax.set_xticks(x, [str(b) for b in bands], rotation=45)ax.set(xlabel="Frequency [Hz]", ylabel="Level difference [dB]",       title=f"DnT,w = {w.rating} dB  (C={w.c:+d}; Ctr={w.ctr:+d})")ax.legend()plt.show()
Both example fiches are regenerated with make reports and kept rendered in
the repository; click either preview to open the PDF.
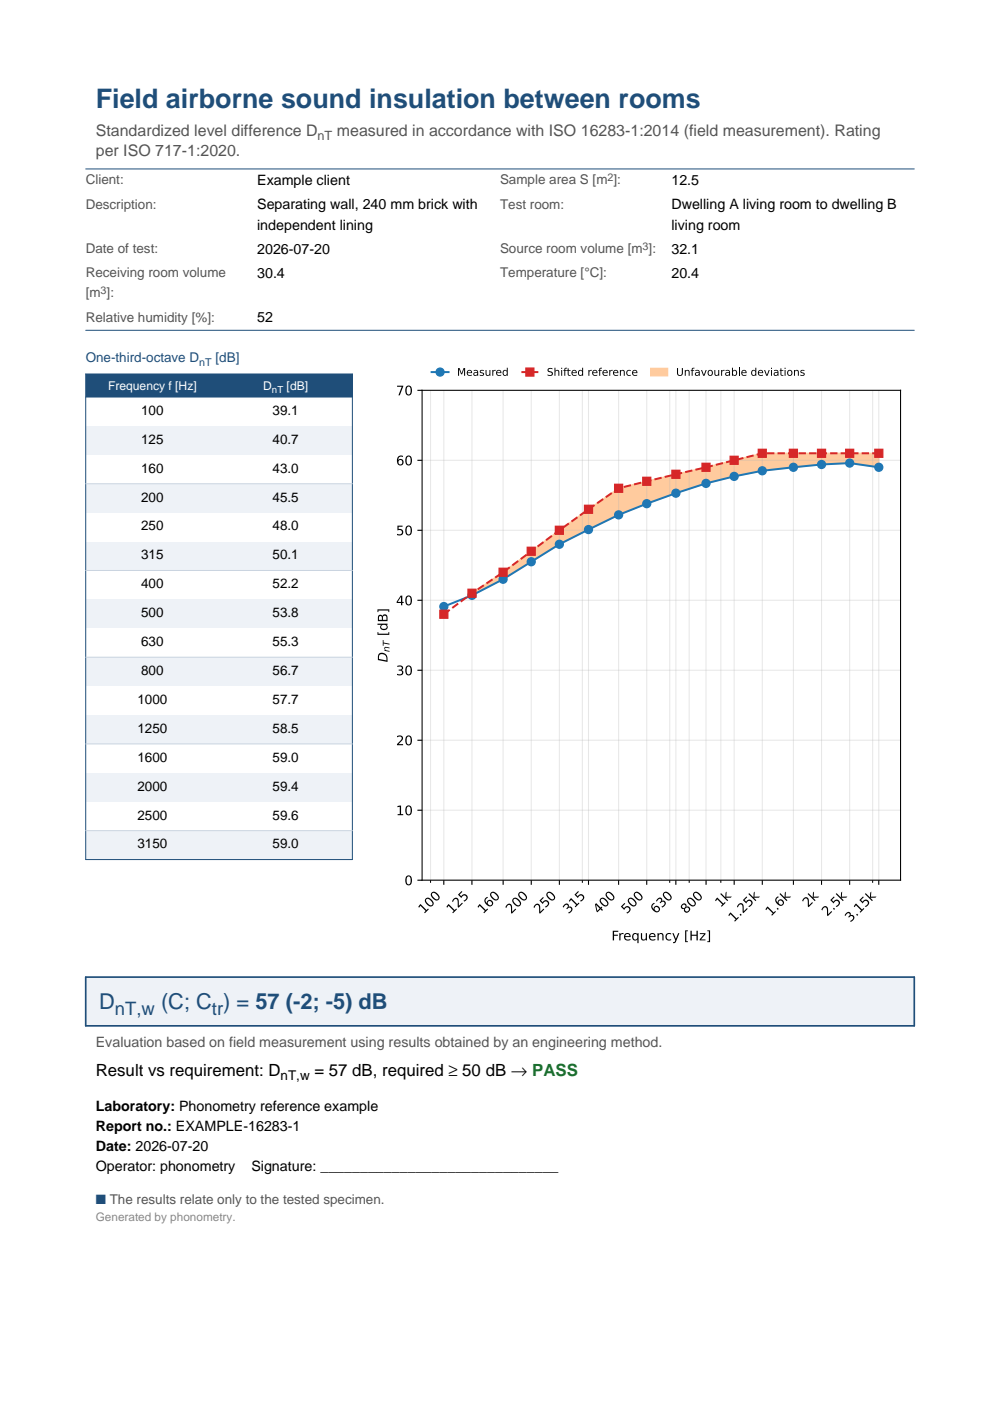
One-page field airborne sound insulation test report between dwellings: the metadata header (client, construction description, partition area, room volumes, climate), the one-third-octave DnT table beside the measured-versus-shifted-reference curve, the boxed DnT,w (C; Ctr) field rating, the engineering-method statement and a PASS verdict against the 50 dB requirement.
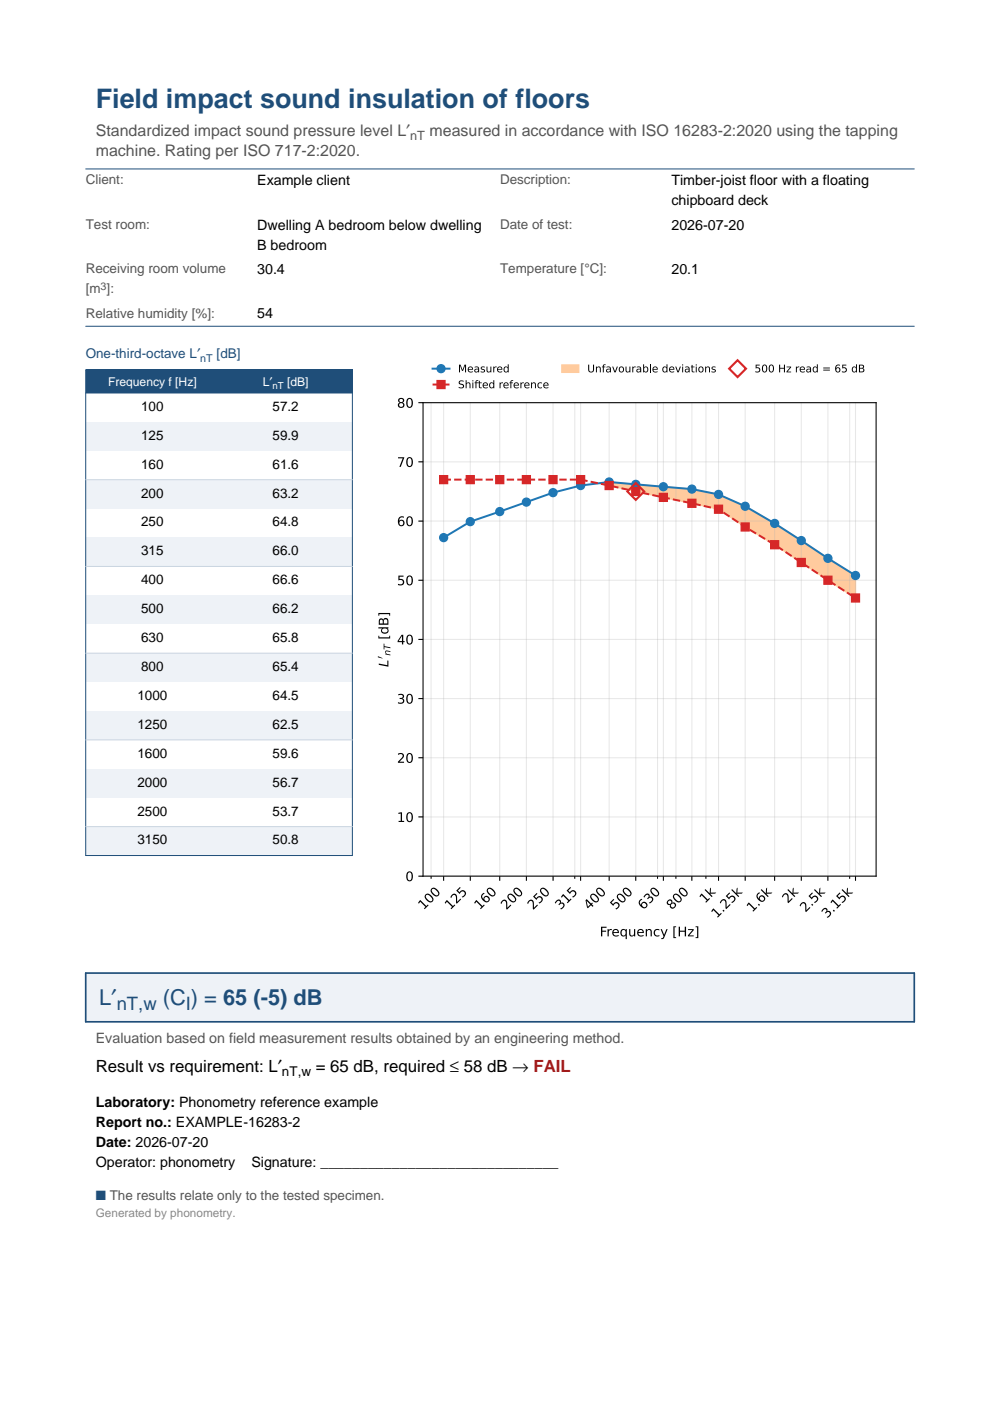
One-page field impact sound insulation test report for a floor under tapping-machine excitation: the metadata header, the one-third-octave L'nT table beside the measured-versus-shifted-reference curve with the 500 Hz read-off, the boxed L'nT,w (CI) field rating, the engineering-method statement and a FAIL verdict against the 58 dB requirement (a lower impact level is better).
Field façade insulation (ISO 16283-3)
Section titled “Field façade insulation (ISO 16283-3)”The same source/receiver logic reaches the building façade, but now the source is outdoors: a loudspeaker at 45° or the road traffic itself. Rather than a level difference across an internal partition, ISO 16283-3 references the receiving-room level to the level 2 m in front of the façade , giving the level difference and, exactly as in the airborne case, its standardized and normalized forms:
with s, m² and (dwellings). When the microphone sits on the test element (surface level ) the element method also yields an apparent sound reduction index, carrying a fixed angle-of-incidence correction: dB for the 45° loudspeaker method, dB for the all-angle road-traffic method:
The façade quantity is airborne, so its single-number rating uses the
ISO 717-1 reference curve through weighted_rating unchanged (Annex F).
import numpy as npfrom phonometry import building
# Outdoor level 2 m in front of the façade, receiving-room level and T per# one-third-octave band; surface_level is the microphone on the test element.l1_2m = np.full(16, 75.0)                              # L1,2m outdoorsl2 = np.full(16, 33.0)                                 # receiving-room L2t2 = np.full(16, 0.5)                                  # receiving-room T (s)
fac = building.facade_insulation(l1_2m, l2, t2, volume=50.0, area=11.5,                        surface_level=np.full(16, 78.0), method="loudspeaker")print(round(float(fac.d_2m[0]), 1))                    # 42.0  D2m = L1,2m - L2print(round(float(fac.d_2m_nt[0]), 1))                 # 42.0  (= D2m since T = T0)print(round(float(fac.d_2m_n[0]), 1))                  # 40.0  normalized to A0 = 10 m^2print(round(float(fac.r_prime[0]), 1))                 # 42.1  R'45deg (loudspeaker, -1.5 dB)
# The road-traffic element method carries the -3 dB all-angle correction insteadtr = building.facade_insulation(l1_2m, l2, t2, volume=50.0, area=11.5,                       surface_level=np.full(16, 78.0), method="road_traffic")print(round(float(tr.r_prime[0]), 1))                  # 40.6  R'tr,s (traffic, -3 dB)
# The façade quantity is airborne: rate D2m,nT with the ISO 717-1 engineprint(building.weighted_rating(fac.d_2m_nt).rating)             # 42  Dls,2m,nT,w
fac.plot()   # per-band D2m,nT with D2m, D2m,n and R' overlaid (needs matplotlib)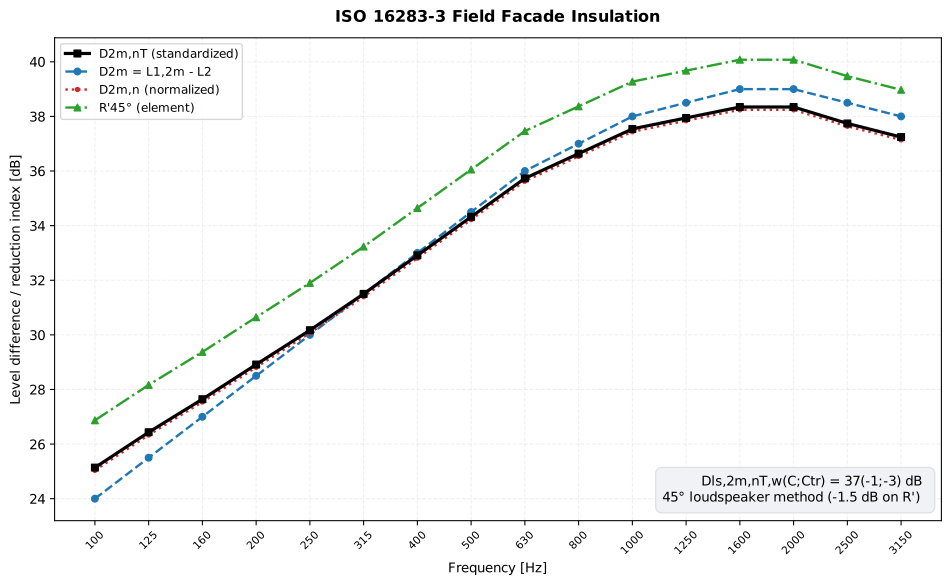
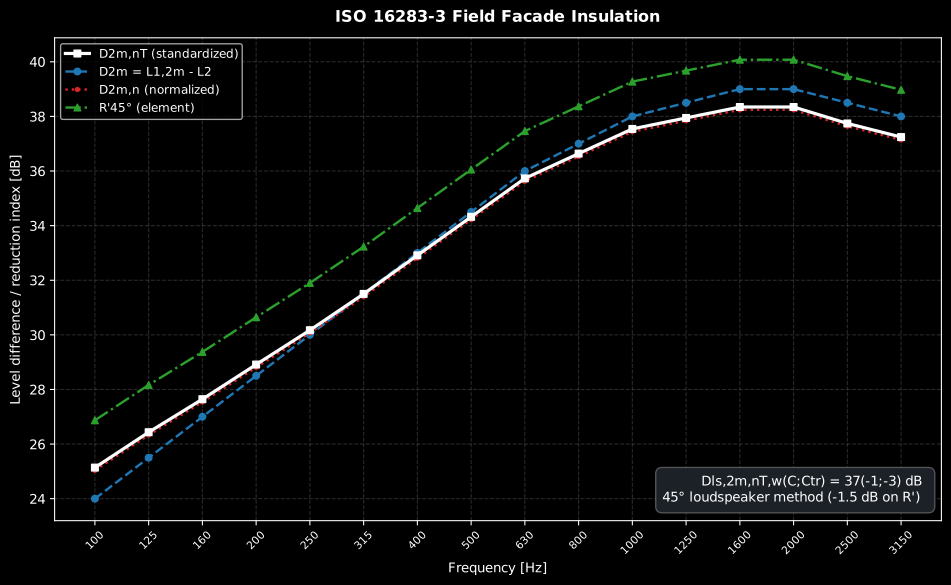
The four façade quantities of one measurement: the raw , its standardized and normalized forms, and the element carrying the −1.5 dB angle-of-incidence correction. The rating box reads the single number obtained by feeding to the ISO 717-1 engine.
Show the code for this figure
import matplotlib.pyplot as pltimport numpy as npfrom phonometry import building
# A dwelling façade, 45° loudspeaker method: outdoor level 2 m in front,# receiving-room level and T per one-third-octave band.bands = np.array([100, 125, 160, 200, 250, 315, 400, 500,                  630, 800, 1000, 1250, 1600, 2000, 2500, 3150], float)l1_2m = np.array([76.0, 77.0, 78.0, 78.5, 79.0, 79.0, 79.0, 79.0,                  78.5, 78.0, 77.5, 77.0, 76.5, 76.0, 75.0, 74.0])d2m = np.array([24.0, 25.5, 27.0, 28.5, 30.0, 31.5, 33.0, 34.5,                36.0, 37.0, 38.0, 38.5, 39.0, 39.0, 38.5, 38.0])t2 = np.array([0.65, 0.62, 0.58, 0.55, 0.52, 0.50, 0.49, 0.48,               0.47, 0.46, 0.45, 0.44, 0.43, 0.43, 0.42, 0.42])fac = building.facade_insulation(l1_2m, l1_2m - d2m, t2, volume=32.0,                                 area=10.8, surface_level=l1_2m + 3.0,                                 method="loudspeaker", frequencies=bands)
# One line — D2m,nT with D2m, D2m,n and R' overlaid per band:fac.plot()plt.show()
# By hand, from the result's fields:w = building.weighted_rating(fac.d_2m_nt)fig, ax = plt.subplots()ax.semilogx(bands, fac.d_2m_nt, "-s", label="D2m,nT (standardized)")ax.semilogx(bands, fac.d_2m, "--o", label="D2m")ax.semilogx(bands, fac.d_2m_n, ":", label="D2m,n (normalized)")ax.semilogx(bands, fac.r_prime, "-.", label="R'45°")ax.set_xlabel("Frequency [Hz]")ax.set_ylabel("Level difference / reduction index [dB]")ax.set_title(f"Dls,2m,nT,w = {w.rating} dB (C={w.c:+d}; Ctr={w.ctr:+d})")ax.legend()plt.show()surface_level, area and volume are all optional: with only l1_2m, l2
and t2 the function returns d_2m and d_2m_nt; add volume for d_2m_n;
add surface_level and area and volume for r_prime. Positions are
energy-averaged with the surface-level formula (Clause 9.5.1); band levels are
assumed already corrected for background noise.
facade_insulation() parameters
Section titled “facade_insulation() parameters”| Parameter | Type | Units | Range / default | Notes |
|---|---|---|---|---|
l1_2m | 1D or 2D array | dB | one/band, or (positions, bands) | Level 2 m in front of the façade L1,2m |
l2 | 1D or 2D array | dB | same band count | Receiving-room levels |
t2 | 1D array | s | > 0, one per band | Receiving-room reverberation time |
area | float, optional | m² | > 0, with surface_level, volume | Test-element area S (enables R') |
volume | float, optional | m³ | > 0 | Receiving-room V (enables D2m,n; required for R') |
surface_level | 1D/2D array, optional | dB | same band count | Surface level L1,s on the element (enables R') |
method | str | — | 'loudspeaker' (−1.5 dB) / 'road_traffic' (−3 dB) | Angle-of-incidence correction of R' |
t0 | float | s | default 0.5 | Reference reverberation time T0 |
frequencies | 1D array, optional | Hz | — | Band centres carried on the result for plotting |
facade_insulation() returns a FacadeInsulationResult (d_2m, d_2m_nt,
d_2m_n or None, r_prime or None, frequencies); feed any 16-band façade
quantity to weighted_rating for its ISO 717-1 single number.
ISO 16283-3 field façade report (.report())
Section titled “ISO 16283-3 field façade report (.report())”FacadeInsulationResult.report(path) writes the one-page ISO 16283-3 field
façade test report: the standard-basis line, an optional metadata header, the
one-third-octave table beside the measured-versus-shifted-reference curve, the
boxed field rating D2m,nT,w (C; Ctr), the engineering-method statement, an
optional requirement verdict (a level difference passes at or above it) and a
footer. quantity="d_2m_nt" (default) reports the standardized level
difference; "d_2m_n" the normalized one; "r_prime" the apparent sound
reduction index R'45. verbose=True, metadata, language="es" and the
phonometry[report] extra behave exactly as in the fiches above.
fac.report("D2mnTw_facade.pdf") # D2m,nT,w (C; Ctr)fac.report("Rp45_facade.pdf", quantity="r_prime") # R'45,w (C; Ctr)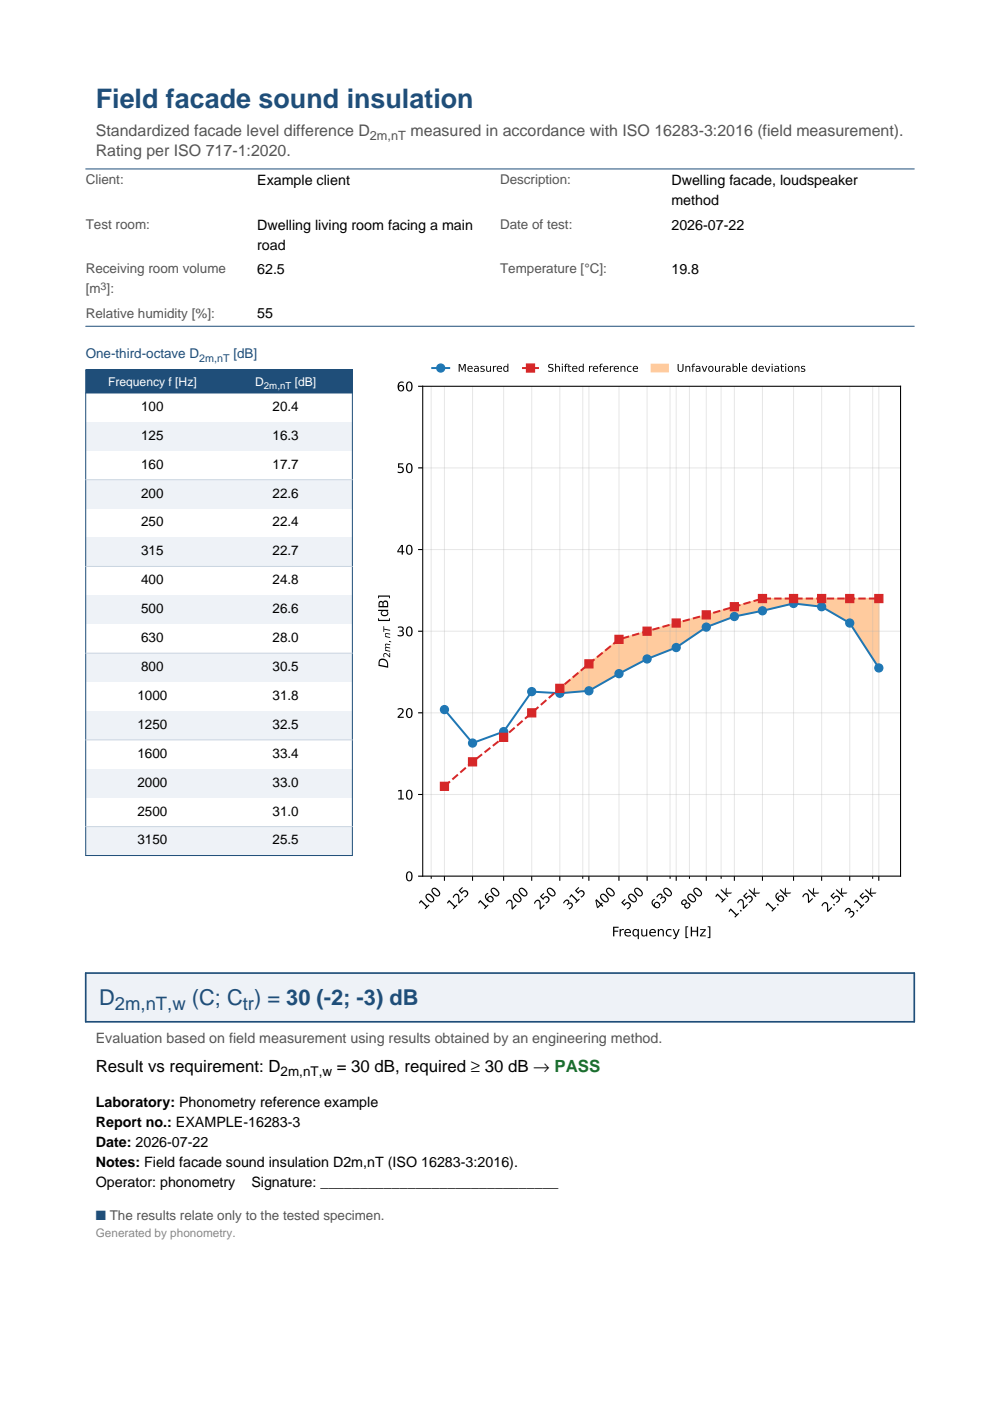
One-page field façade sound insulation test report: the metadata header, the one-third-octave D2m,nT table beside the measured-versus-shifted-reference curve, the boxed D2m,nT,w (C; Ctr) field rating, the engineering-method statement and a PASS verdict.
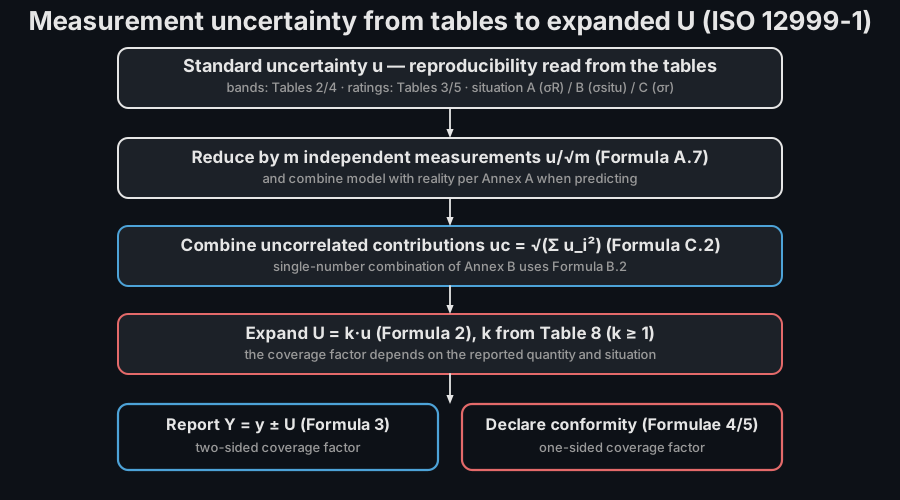
Measurement uncertainty (ISO 12999-1)
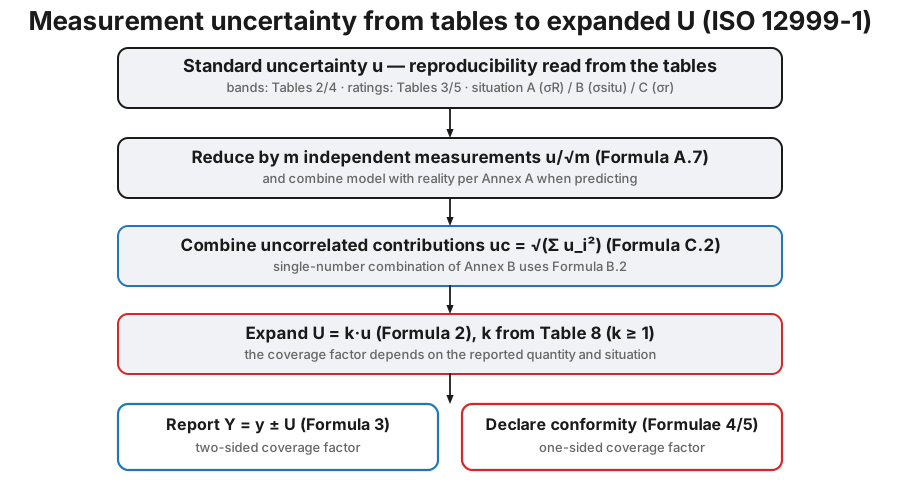
Section titled “Measurement uncertainty (ISO 12999-1)”A rating without an uncertainty is only half a result. ISO 12999-1 does not re-measure anything; it tabulates the standard uncertainty of every sound-insulation quantity, derived from inter-laboratory tests, and prescribes how to expand and combine it. Which standard deviation is depends on the measurement situation (Clause 5.2):
| Situation | Meaning | Standard uncertainty |
|---|---|---|
| A | laboratory characterisation (ISO 10140) | reproducibility |
| B | same location, different teams | in-situ |
| C | same location, same operator repeated | repeatability |
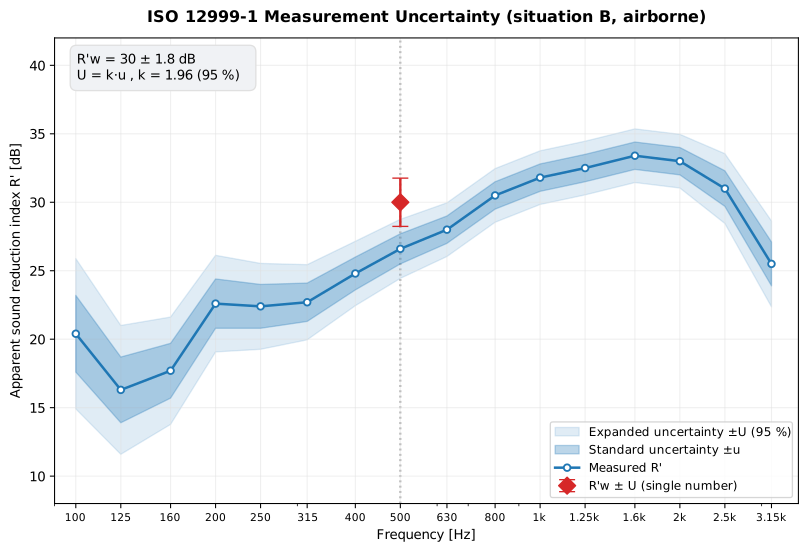
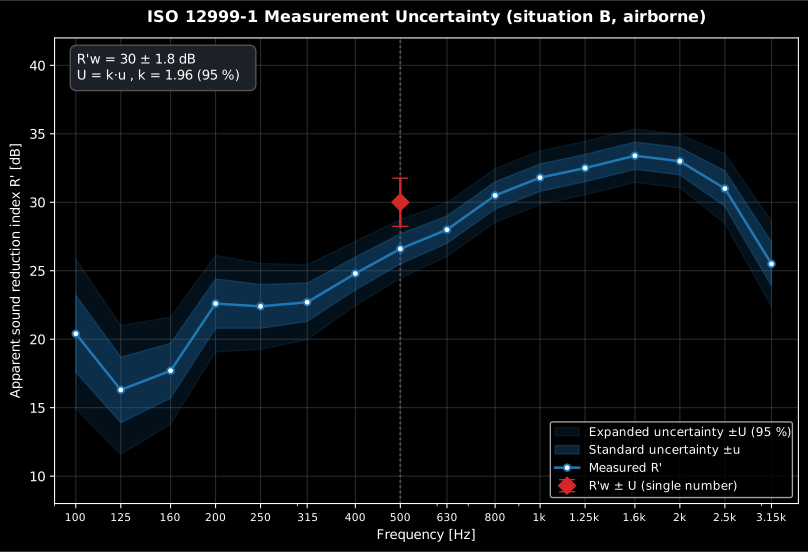
The expanded uncertainty is (Formula 2) with the coverage factor of Table 8. A two-sided interval (Formula 3, at 95 %) reports a value; the one-sided factor ( at 95 %) declares conformity with a requirement (Formulae 4/5).
from phonometry import building
# Situation B (same building, different teams) -> the in-situ standard deviation.print(building.single_number_uncertainty("r_w", "B"))       # 0.9  dB  (Table 3)u = building.band_uncertainty("airborne", "B")              # per-band u (Table 2)print(len(u.frequencies), u.uncertainties[10])     # 21 1.1  (the 500 Hz band)u.plot()   # the per-band u(f) spectrum of Table 2 (needs matplotlib)
# Report R'w = 52 dB with a two-sided 95 % interval (k = 1.96, Table 8):uv = building.uncertain_value(52.0, "rprime_w", "B")        # aliases resolve to r_wprint(uv.coverage_factor, round(uv.expanded_uncertainty, 1))    # 1.96 1.8print(round(uv.lower, 1), round(uv.upper, 1))      # 50.2 53.8  ->  52 ± 1.8 dB
# Declaring conformity uses the ONE-sided factor (k = 1.65): does R'w provably# clear a 50 dB requirement?uc = building.uncertain_value(52.0, "rprime_w", "B", one_sided=True)print(building.satisfies_lower_requirement(52.0, uc.expanded_uncertainty, 50.0))   # True
Impact quantities offer situations B/C only (Table 4, no 500 Hz band in the 2020
edition), and only situation A. Descriptors are case-insensitive with
aliases (rprime_w/dnt_w→r_w, lprime_n_w→ln_w); combine independent
components in quadrature with combine_uncertainties, and reduce by
independent measurements with reduce_by_independent_measurements ().
Show the code for this figure
import matplotlib.pyplot as pltfrom phonometry import building
# The same R'w = 52 dB reported in each situation with its two-sided 95 % U.situations = ["A", "B", "C"]vals = [building.uncertain_value(52.0, "r_w", s) for s in situations]
fig, ax = plt.subplots(figsize=(7, 4))ax.errorbar(situations, [v.value for v in vals],            yerr=[v.expanded_uncertainty for v in vals],            fmt="o", capsize=8, color="tab:blue")for s, v in zip(situations, vals):    ax.annotate(f"±{v.expanded_uncertainty:.1f}", (s, v.upper),                textcoords="offset points", xytext=(8, 4))ax.set_ylabel("R'w [dB]"); ax.set_xlabel("Measurement situation")ax.set_title("R'w = 52 dB with 95 % expanded uncertainty (ISO 12999-1)")fig.tight_layout()plt.show()
band_uncertainty() / single_number_uncertainty() / uncertain_value() parameters
Section titled “band_uncertainty() / single_number_uncertainty() / uncertain_value() parameters”| Parameter | Type | Units | Range / default | Notes |
|---|---|---|---|---|
measurand | str | — | 'airborne' / 'impact' / 'impact_reduction' | Selects Table 2 / 4 / 6 |
quantity | str | — | 'r_w', 'ln_w', 'delta_lw' (+ aliases, +c/+ctr variants) | Single-number descriptor |
situation | str | — | 'A' / 'B' / 'C' | Measurement situation (Clause 5.2) |
value | float | dB | — | Best estimate y to attach U to |
coverage | float | — | default 0.95 | Confidence level (Table 8) |
one_sided | bool | — | default False | One-sided factor for conformity checks |
upper_limit | bool | — | default False | Select the σR95 upper limit (airborne, situation A) |
band_uncertainty() returns a BandUncertainty (frequencies,
uncertainties, .to_arrays()); single_number_uncertainty() a float;
uncertain_value() an UncertainValue (value, standard_uncertainty,
coverage_factor, expanded_uncertainty, .lower, .upper). The read-only
COVERAGE_FACTORS mapping exposes Table 8 keyed by (confidence, one_sided).
Field survey method (ISO 10052)
Section titled “Field survey method (ISO 10052)”The engineering methods above buy accuracy with effort: swept microphones,
per-band reverberation times, careful background correction. For a quick check
in a dwelling, ISO 10052 defines a survey (control) method: octave bands, a
hand-held meter, and a single quantity, the reverberation index
k = 10 lg(T/T0) (T0 = 0.5 s), to carry the receiving-room correction. Every
survey quantity is then just an addition of k: the standardized level
difference DnT = D + k, the normalized Dn = D + k + 10 lg(A0 T0 / (0.16 V)),
the apparent R' = D + k + 10 lg(S T0 / (0.16 V)) (using V/7.5 for S where
that is larger), and, for impacts and façades, L'nT = Li - k and
D2m,nT = D2m + k. The clause references follow ISO 10052:2021; the formulas
and the reverberation-index table are identical in the harmonized
EN ISO 10052:2004+A1:2010.
The reverberation index is either measured (feed the reverberation time to
reverberation_index(T)) or, in a control survey, estimated from the room
type and volume with estimate_reverberation_index(V, room) (Table 4:
furnished "kitchen" / "bathroom" / "furnished", or the unfurnished
construction classes "a"–"h" and the mixed "a+e"…"d+h"). A fourth
quantity unique to this method is service-equipment noise LXY: the
energy average of three A- or C-weighted positions.
import numpy as npfrom phonometry import building
# Octave-band levels (125-2000 Hz) and the measured receiving-room T.l1 = np.array([88.0, 90.0, 92.0, 92.0, 90.0])l2 = np.array([55.0, 51.0, 47.0, 41.0, 35.0])k = building.reverberation_index([0.70, 0.60, 0.50, 0.45, 0.40])   # k = 10 lg(T/0.5)res = building.survey_airborne_insulation(l1, l2, k, volume=50.0, area=12.0)print(np.round(res.d_nt, 1))          # [34.5 39.8 45.  50.5 54. ]  DnT = D + kprint(res.rating.rating, res.rating.c)        # 49 -1  ->  DnT,w (C)print(res.r_prime_rating.rating)               # 48  ->  R'w
# No reverberation time measured? Estimate k from Table 4 (heavy walls, hard# floor, 35-60 m3 -> class "g").k_est = building.estimate_reverberation_index(50.0, "g")print(k_est)                                   # [4.5 5.  5.5 5.5 5.5]
# Service-equipment noise: energy average of three A-weighted positions.se = building.survey_service_equipment_level([35.0, 30.0, 32.0], 3.0, volume=50.0)print(round(float(se.l_xy), 1), round(float(se.l_xy_nt), 1))   # 32.8 29.8
res.plot()   # DnT vs shifted ISO 717-1 reference (needs matplotlib)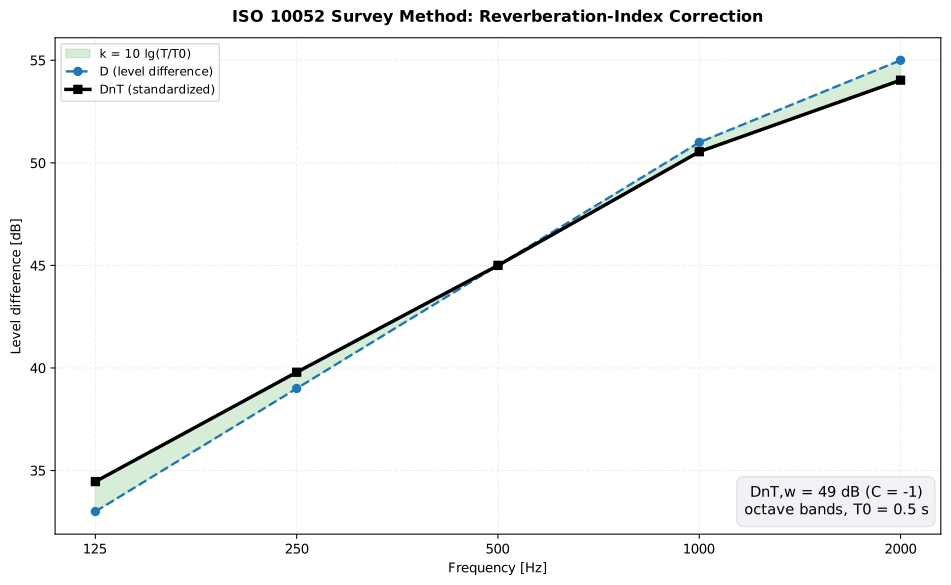
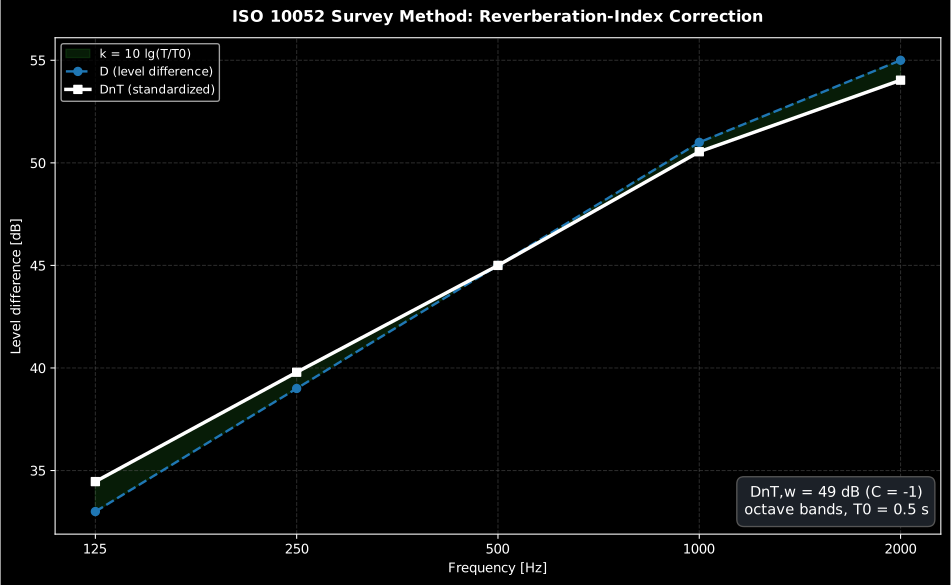
The reverberation index k = 10 lg(T/T0) shifts the raw level difference D
into the standardized DnT: up where the room is live (T > T0), down where
it is dead. The automatic rating is formed only for exactly 5 octave (or 16
one-third-octave) values.
Show the code for this figure
import matplotlib.pyplot as pltimport numpy as npfrom phonometry import building
# Octave-band levels (125-2000 Hz) and the measured receiving-room T.bands = [125, 250, 500, 1000, 2000]l1 = np.array([88.0, 90.0, 92.0, 92.0, 90.0])l2 = np.array([55.0, 51.0, 47.0, 41.0, 35.0])k = building.reverberation_index([0.70, 0.60, 0.50, 0.45, 0.40])   # k = 10 lg(T/0.5)res = building.survey_airborne_insulation(l1, l2, k, volume=50.0)
x = np.arange(len(bands))fig, ax = plt.subplots()ax.fill_between(x, res.d, res.d_nt, alpha=0.2, label="k = 10 lg(T/T0)")ax.plot(x, res.d, "--o", label="D (level difference)")ax.plot(x, res.d_nt, "-s", label="DnT (standardized)")ax.set_xticks(x, [str(b) for b in bands])ax.set(xlabel="Frequency [Hz]", ylabel="Level difference [dB]",       title=f"ISO 10052 survey method: DnT,w = {res.rating.rating} dB")ax.legend()plt.show()
survey_airborne_insulation() and friends: parameters
Section titled “survey_airborne_insulation() and friends: parameters”| Parameter | Type | Units | Range / default | Notes |
|---|---|---|---|---|
l1 / l2 | 1D or 2D array | dB | one/band, or (positions, bands) | Source / receiving (or outdoor l1_2m) levels |
li | 1D or 2D array | dB | one/band, or (positions, bands) | Impact levels (energy-averaged over positions) |
reverberation_index | scalar or 1D array | dB | one per band | k from reverberation_index or estimate_reverberation_index; survey_service_equipment_level() also accepts a scalar k |
volume | float | m³ | > 0 | Receiving-room V (for Dn / L'n / R' / normalized) |
area | float | m² | > 0 | Common-partition S (airborne R'; V/7.5 rule applied) |
measurements | array | dB | exactly 3 | Service-equipment positions (survey_service_equipment_level) |
room | str | — | "kitchen"/"bathroom"/"furnished"/"a"–"h"/"a+e"… | estimate_reverberation_index room class (Table 4) |
survey_airborne_insulation() returns a SurveyAirborneResult (d, d_nt,
d_n, r_prime, rating, r_prime_rating); survey_impact_insulation() a
SurveyImpactResult (l_i, l_nt, l_n, rating);
survey_facade_insulation() a SurveyFacadeResult;
survey_service_equipment_level() a SurveyServiceEquipmentResult (l_xy,
l_xy_nt, l_xy_n).
ISO 10052 survey reports (.report())
Section titled “ISO 10052 survey reports (.report())”The airborne, impact and façade survey results each carry a .report(path) that
writes the one-page ISO 10052 survey (control) method field report: the
standard-basis line naming ISO 10052 (octave bands), an optional metadata
header, the octave-band table beside the measured-versus-shifted-reference
curve, the boxed field rating (DnT,w/R'w, L'nT,w or D2m,nT,w), the
survey-method statement, an optional requirement verdict (level differences pass
at or above it, the impact level at or below it) and a footer. The airborne
result reports quantity="dnt" (default) or "r_prime"; verbose=True,
metadata and language="es" behave as in the fiches above.
import numpy as np
res.report("DnTw_survey.pdf",           metadata=ReportMetadata(requirement=40.0))   # DnT,w (C; Ctr)
# Impact and façade surveys reuse the same k; li is the tapping-machine level# in the room below, l1_2m the level 2 m in front of the façade.li = np.array([66.0, 64.0, 62.0, 60.0, 55.0])impact = building.survey_impact_insulation(li, k, volume=50.0)impact.plot()   # L'nT vs the shifted ISO 717-2 reference (needs matplotlib)impact.report("LnTw_survey.pdf")                         # L'nT,w (CI)
l1_2m = np.array([76.0, 78.0, 79.0, 79.0, 77.0])facade = building.survey_facade_insulation(l1_2m, l2, k, volume=40.0)facade.report("D2mnTw_survey.pdf")                       # D2m,nT,w (C; Ctr)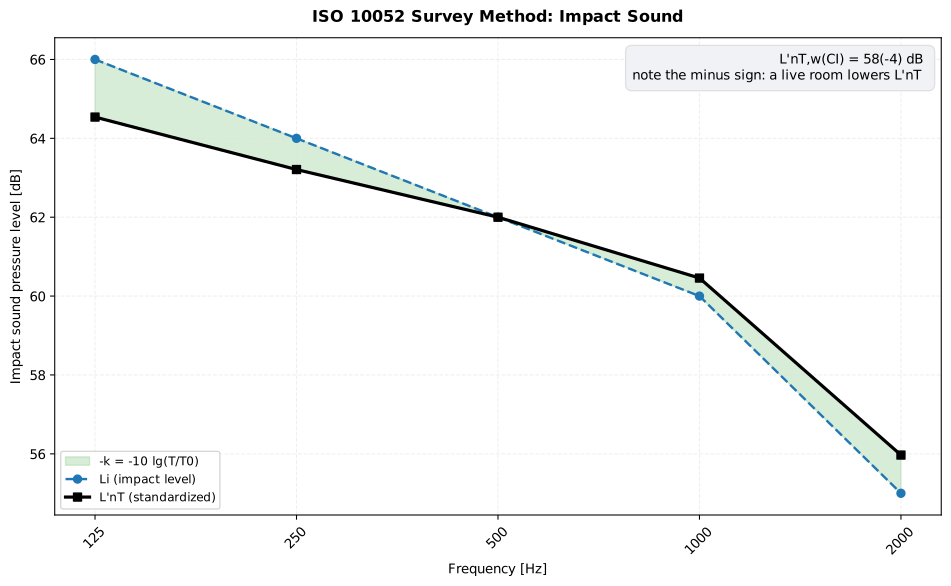
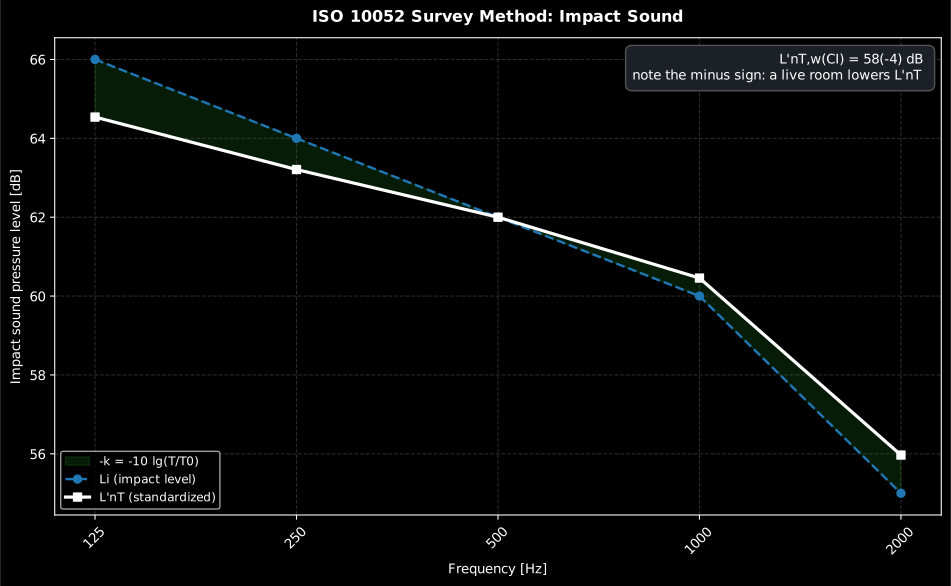
The impact survey applies the reverberation index with the opposite sign,
L'nT = Li − k: a live receiving room (T > T0) lowers the standardized
impact level. As in the airborne case, the automatic rating appears for
exactly 5 octave (or 16 one-third-octave) values.
Show the code for this figure
import matplotlib.pyplot as pltimport numpy as npfrom phonometry import building
# Octave-band tapping-machine levels below the floor, and the measured T.bands = [125, 250, 500, 1000, 2000]li = np.array([66.0, 64.0, 62.0, 60.0, 55.0])k = building.reverberation_index([0.70, 0.60, 0.50, 0.45, 0.40])impact = building.survey_impact_insulation(li, k, volume=50.0)
# One line — L'nT vs the shifted ISO 717-2 reference:impact.plot()plt.show()
# By hand, showing the sign flip of the correction:x = np.arange(len(bands))fig, ax = plt.subplots()ax.fill_between(x, impact.l_i, impact.l_nt, alpha=0.2, label="-k = -10 lg(T/T0)")ax.plot(x, impact.l_i, "--o", label="Li (impact level)")ax.plot(x, impact.l_nt, "-s", label="L'nT (standardized)")ax.set_xticks(x, [str(b) for b in bands])ax.set(xlabel="Frequency [Hz]", ylabel="Impact sound pressure level [dB]",       title=f"ISO 10052 survey method: L'nT,w = {impact.rating.rating} dB")ax.legend()plt.show()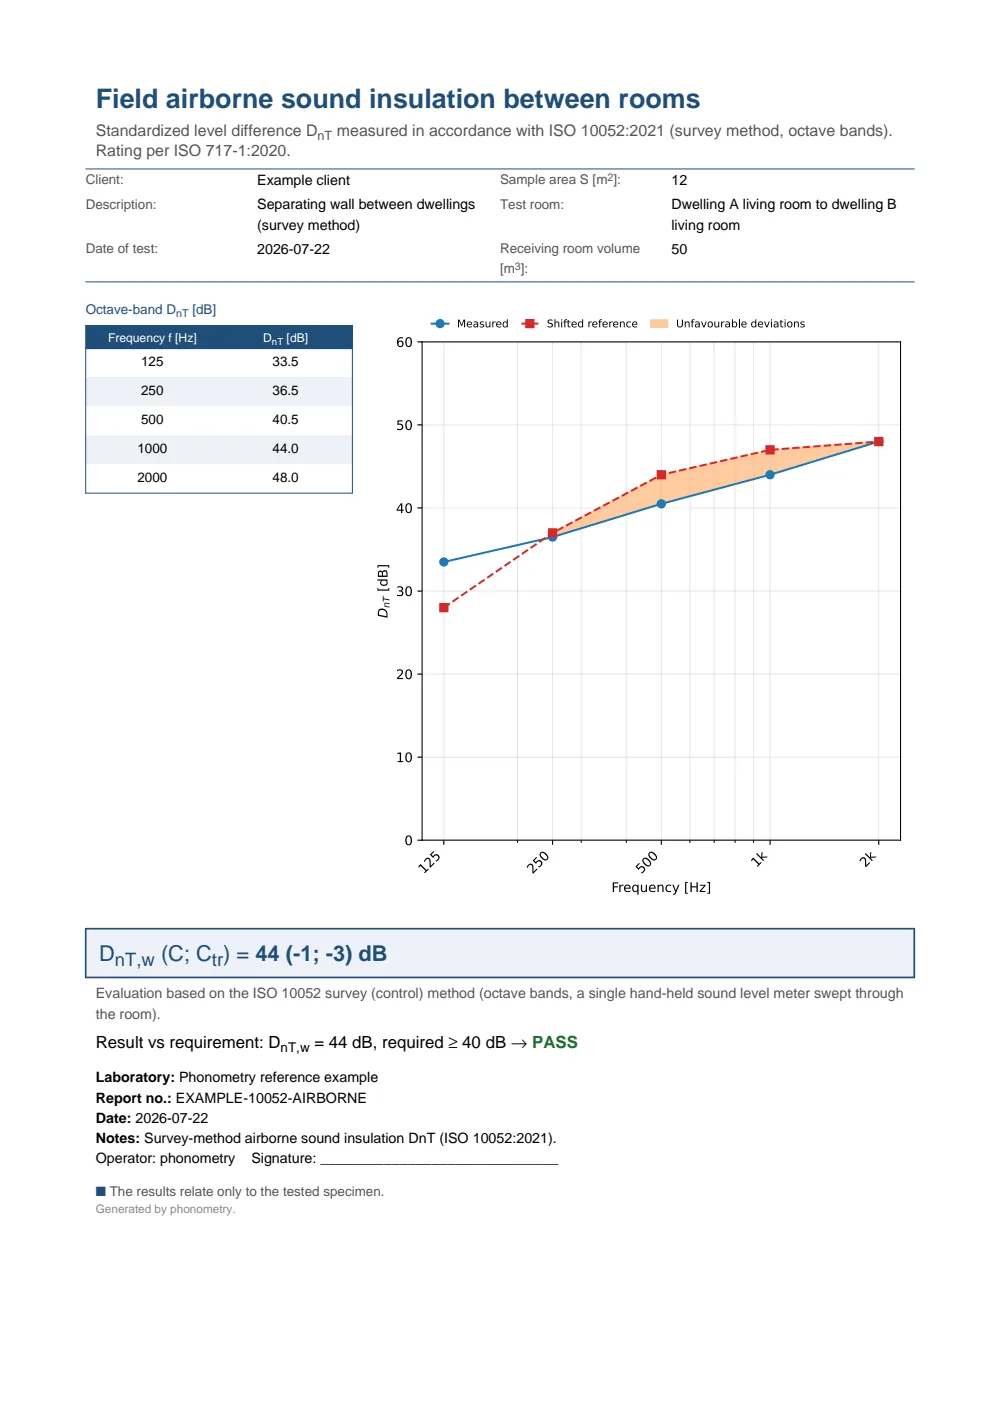
One-page survey-method airborne sound insulation field report between dwellings: the metadata header, the octave-band DnT table beside the measured-versus-shifted-reference curve, the boxed DnT,w (C; Ctr) rating, the survey-method statement and a PASS verdict.
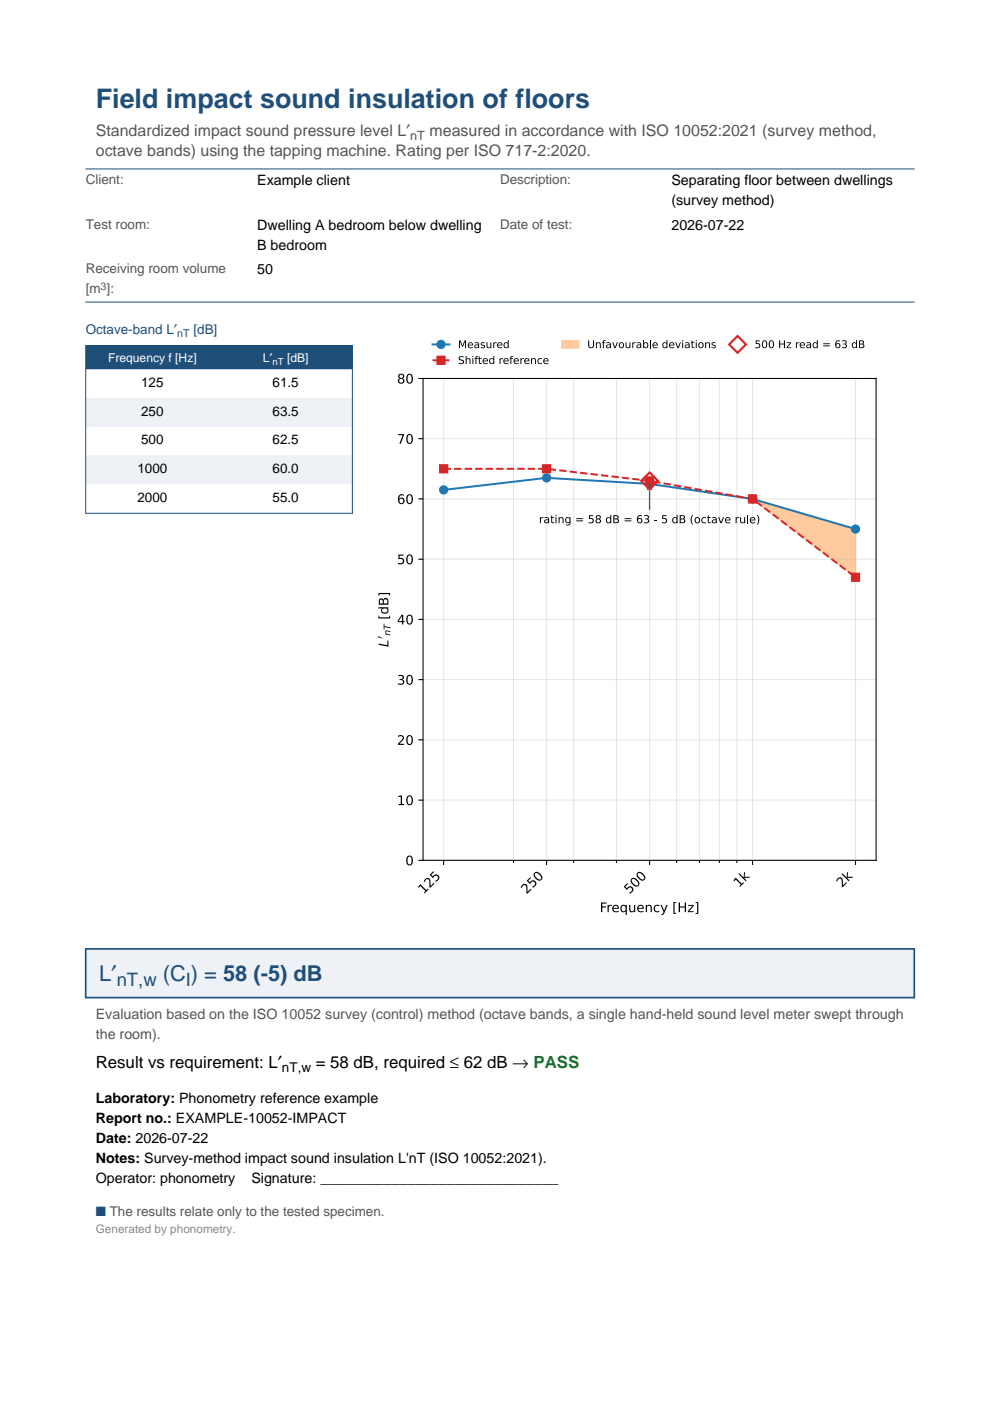
One-page survey-method impact sound insulation field report for a floor under tapping-machine excitation: the metadata header, the octave-band L'nT table beside the measured-versus-shifted-reference curve, the boxed L'nT,w (CI) rating, the survey-method statement and a PASS verdict (a lower impact level is better).
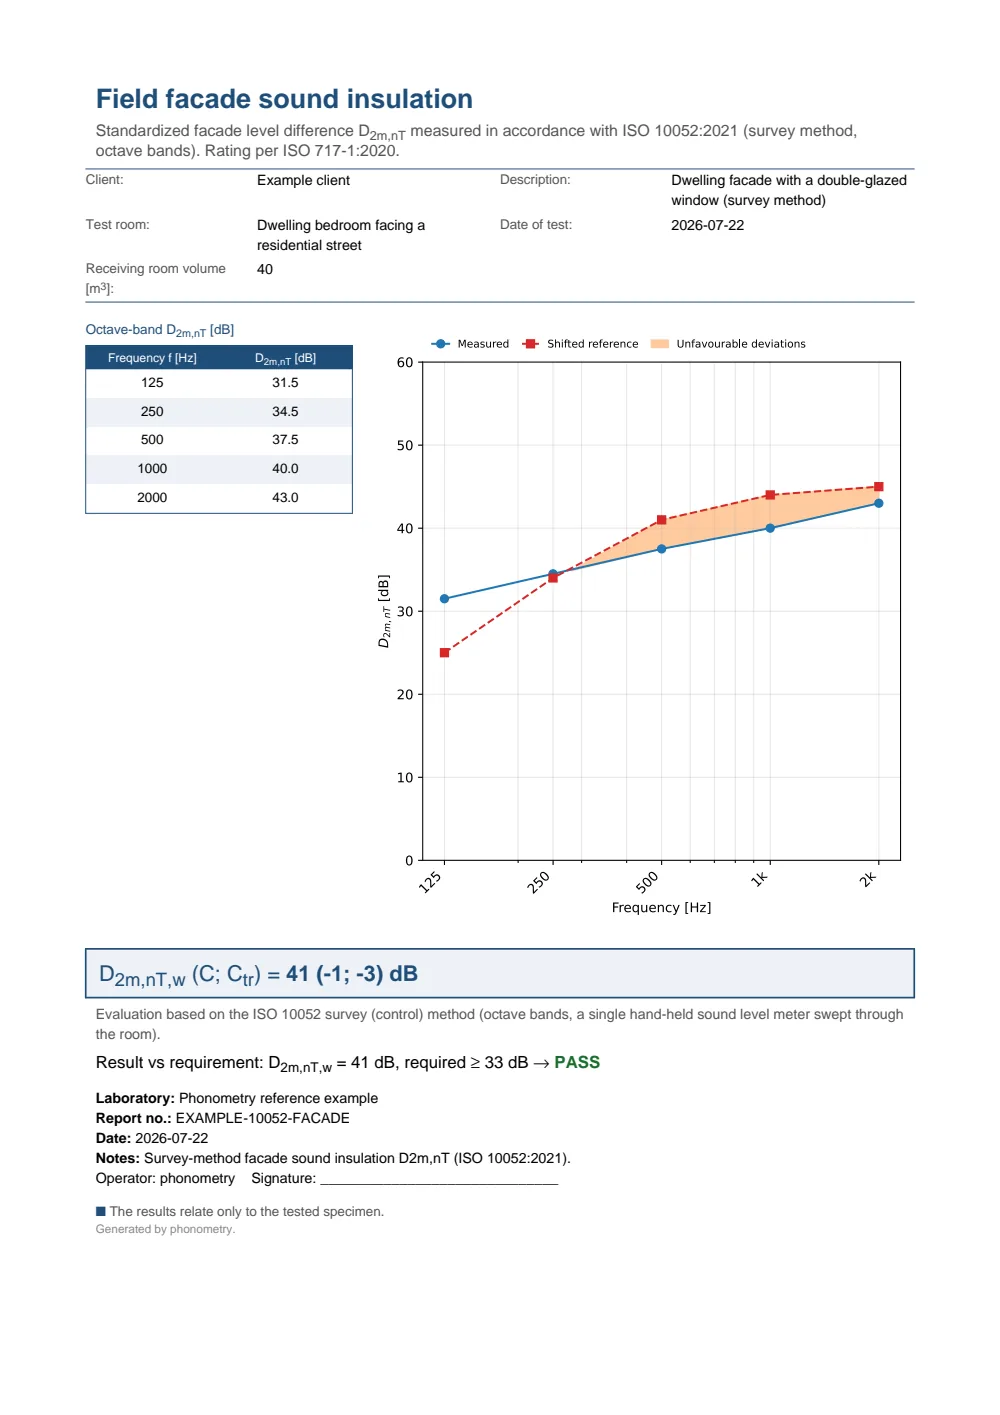
One-page survey-method façade sound insulation field report: the metadata header, the octave-band D2m,nT table beside the measured-versus-shifted-reference curve, the boxed D2m,nT,w (C; Ctr) rating, the survey-method statement and a PASS verdict.
What this guide covers
Section titled “What this guide covers”Covered. ISO 16283-1:2014 (airborne field insulation: the level
difference, standardized and apparent of Clause 3.12-3.15 and
the Clause 7.8 position averaging), ISO 16283-2:2015 (impact field
insulation, the same normalisations with the sign flip) and ISO 16283-3:2016
(façade insulation, the ////
quantities of the loudspeaker and road-traffic element methods), each rated
by the ISO 717-1/ISO 717-2 reference-curve method (with the Annex B/A.2.1
enlarged-range terms) through building.airborne_insulation,
building.impact_insulation, building.facade_insulation and
building.weighted_rating/weighted_impact_rating(_extended);
ISO 12999-1:2020’s tabulated standard uncertainties (the Clause 5.2
measurement situations A/B/C and the Table 8 coverage factors, one- and
two-sided) via building.band_uncertainty, building.single_number_uncertainty
and building.uncertain_value; and the ISO 10052:2021 survey method (the
reverberation index , its Table 4 room-class estimate and the four survey
quantities) via building.survey_airborne_insulation and its siblings.
Not covered. Every field function here takes levels that the caller has
already corrected for background noise (Clause 9.2 of ISO 16283-1); the
background-noise measurement and correction itself is not implemented.
ISO 16283-1/-2/-3’s own position and procedure requirements (the minimum
number of source and microphone positions, the low-frequency loudspeaker or
microphone-sweep procedures) are not checked: energy-averaging happens once
positions are supplied, but nothing here verifies how many were taken or
where. The sound-intensity route to the same field quantities
(ISO 15186-1/-2) is not in this module either: it is intensity_insulation
of the
Laboratory Insulation Measurement guide.
See also
Section titled “See also”- Laboratory Insulation Measurement: the ISO 10140 element characterisation these field quantities are compared against.
- Predicting Sound Insulation (EN 12354): the in-situ performance predicted from laboratory element data.
- Room Acoustics: the impulse response, room parameters and sound absorption that this guide’s insulation chain builds on.
- Levels: energy averaging and the level metrics behind source/receiving-room levels.
- Filter Banks: the IEC 61260 fractional-octave filters used for the insulation spectra.
- Theory: the reference-curve derivation behind the weighted single-number ratings.
- API reference:
building.insulation,building.survey_insulationandbuilding.building_uncertainty.
Quick answers
Section titled “Quick answers”What does DnT,w mean?
Section titled “What does DnT,w mean?”is the weighted standardized level difference. Per one-third-octave band, references the receiving-room reverberation time to s, with the source-to-receiving level difference (ISO 16283-1). The ISO 717-1 reference-curve method then collapses the 16 bands from 100 Hz to 3150 Hz into the single number read at 500 Hz.
What is the difference between R and R’ in sound insulation?
Section titled “What is the difference between R and R’ in sound insulation?”The prime marks where the measurement was made: primed quantities (, , ) are measured in the building and include every flanking path, while the unprimed and are laboratory properties of the element alone, measured with flanking suppressed. In the field (ISO 16283-1), with partition area and Sabine absorption area .
What is the difference between the C and Ctr spectrum adaptation terms?
Section titled “What is the difference between the C and Ctr spectrum adaptation terms?”Both re-rate the same measured curve against the two source spectra of ISO 717-1 Annex A: against A-weighted pink noise (living activities: speech, music, radio, television) and against A-weighted urban road traffic, whose energy sits at low frequency. is typically 0 to −2 dB, while a lightweight double leaf with a mass-air-mass resonance near 100 Hz can carry a of −5 to −10 dB.
References
Section titled “References”- Hopkins, C. (2007). Sound insulation. Butterworth-Heinemann. https://doi.org/10.4324/9780080550473The comprehensive treatment of airborne and impact sound insulation: the measurement chains, the statistics of rooms behind the field quantities and the interpretation of the single-number ratings. ISBN 978-0-7506-6526-1.
- International Organization for Standardization. (2014). Acoustics — Field measurement of sound insulation in buildings and of building elements — Part 1: Airborne sound insulation (ISO 16283-1:2014). The field airborne method this page implements: the level differences and normalisations.
- International Organization for Standardization. (2015). Acoustics — Field measurement of sound insulation in buildings and of building elements — Part 2: Impact sound insulation (ISO 16283-2:2015). The field impact method: the standardized and normalized impact levels.
- International Organization for Standardization. (2016). Acoustics — Field measurement of sound insulation in buildings and of building elements — Part 3: Façade sound insulation (ISO 16283-3:2016). The field façade element and global methods, with the angle-of-incidence corrections.
- International Organization for Standardization. (2020). Acoustics — Determination and application of measurement uncertainties in building acoustics — Part 1: Sound insulation (ISO 12999-1:2020). The standard uncertainties per measurement situation (Clause 5.2) and the Table 8 coverage factors; its precision framework builds on ISO 5725 (context, not implemented directly).
- International Organization for Standardization. (2020). Acoustics — Rating of sound insulation in buildings and of building elements — Part 1: Airborne sound insulation (ISO 717-1:2020). The reference-curve rating and the spectrum adaptation terms C and Ctr interpreted above; also the single-number engine for the façade quantity (Annex F).
- International Organization for Standardization. (2020). Acoustics — Rating of sound insulation in buildings and of building elements — Part 2: Impact sound insulation (ISO 717-2:2020). The impact reference-curve rating and the spectrum adaptation term CI, with the enlarged-range CI,50-2500 term.
- International Organization for Standardization. (2021). Acoustics — Field measurements of airborne and impact sound insulation and of service equipment sound — Survey method (ISO 10052:2021). The field survey method: the reverberation-index correction, the standardized/normalized airborne, impact and façade quantities, and service-equipment noise. The formulas and reverberation-index table are identical in the harmonized EN ISO 10052:2004+A1:2010.
- Vigran, T. E. (2008). Building acoustics. CRC Press. https://doi.org/10.1201/9781482266016A compact textbook companion for the sound-transmission physics behind these measurements. ISBN 978-0-415-42853-8.