Environment and Transport
Standards: ISO 1996NT ACOU 112ISO/PAS 1996ISO 9613ISO 9612ISO 3744Key references: Salomons 2001Attenborough & Van Renterghem 2021Maekawa 1968+4 more
This page collects the theory behind outdoor and environmental noise: the whole-day rating descriptors and the impulsive-sound adjustment, atmospheric absorption, the general outdoor propagation method, occupational noise exposure with its uncertainty budget, and the sound power determination methods. It is part of the theory reference.
Each section keeps its own standard’s notation, and four letters are reused across them. Read them per section:
| Symbol | In the propagation sections | In the sound-power sections |
|---|---|---|
| Octave-band attenuation, in dB (ISO 9613-2) | Equivalent absorption area of the room, in m² | |
| — | Reference absorption area, 1 m²; except in the ISO 3745 air term, where is a dimensionless absorption product | |
| , | Barrier constants in (ISO 9613-2) | Meteorological corrections (ISO 3745, ISO 3741) |
| — | background, reverberant field, impulse adjustment, and plain the bias-error factor of the intensity methods; is the ISO 9613-2 barrier meteorological factor |
Environmental descriptors (ISO 1996-1)
Section titled “Environmental descriptors (ISO 1996-1)”The day-evening-night level (ISO 1996-1:2016, 3.6.4) is an energy average over the 24 h day with penalty weightings of +5 dB for the evening and +10 dB for the night:
with default period durations h; countries may define the periods differently (3.6.4 Note 1). The day-night level (3.6.5) drops the evening period:
Both are special cases of the composite whole-day rating level (6.5, generalizing Formulae 5–6), where each period contributes its rating level plus an adjustment , weighted by its share of the day:
The adjustments cover time-of-day penalties (ISO 1996-1 Table A.1: evening 5 dB, night 10 dB) as well as source-character adjustments (e.g. tonal penalties), which the ECMA-418-1 TNR/PR assessments can justify objectively.
What the penalties are, and what the number means. The +5 and +10 dB are not physics: nothing about the sound changes at 19:00. They encode a dose-response finding: the same acoustic energy is reported as more annoying when it interrupts an evening at home or a night’s sleep, so is an annoyance indicator built out of acoustic levels and must never be read back as one. On the scale it lives on, a rural night sits in the 40s, a quiet residential street in the mid-50s and a façade on a busy urban arterial in the high 60s, and the Environmental Noise Directive reports strategic maps in 5 dB bands from 55 dB upward. The weighting also decides where a mitigation is worth applying: an hour of night enters with against the day’s , so a decibel bought at night is worth about 6.7 times a decibel bought during the day, but only once the night is loud enough to matter, and the crossover is arithmetic. The night term overtakes the day term when the night level comes within about 8 dB of the day level; in the profile below the night is 14.4 dB below the day, so it contributes only 12.5 % of the total against the day’s 51.3 %, and 3 dB off the day moves by 1.3 dB where 3 dB off the night moves it by 0.3 dB. Check the split before choosing where to spend.
See the Environmental Levels guide for usage.
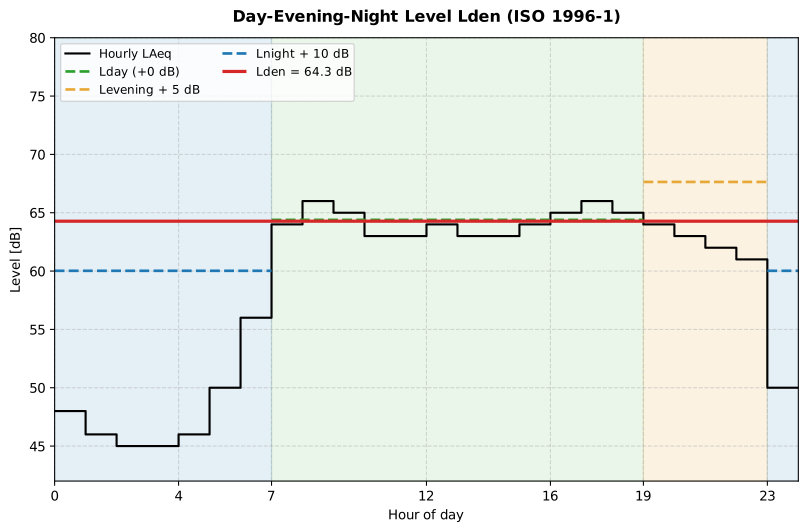
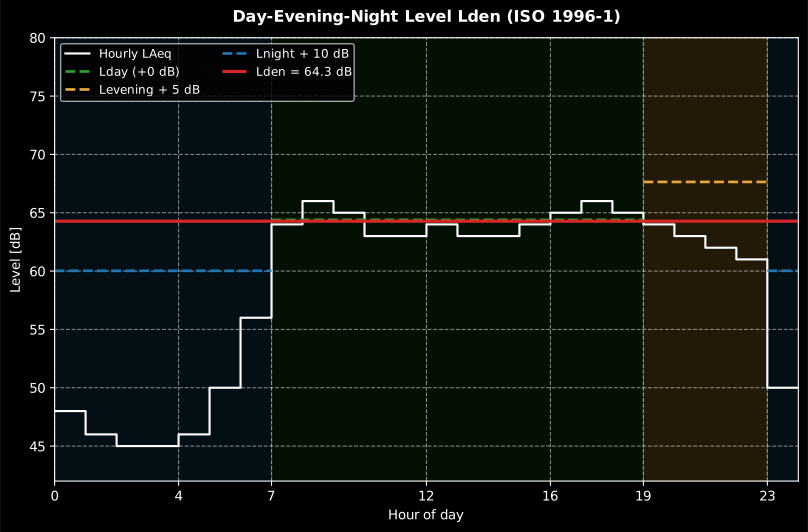
A 24-hour profile split into day, evening and night, the +5/+10 dB penalties and the resulting of 64.3 dB, an urban arterial façade, squarely inside the range the Directive maps. The day averages 64.4 dB, the evening 62.6 dB and the night 50.0 dB; the penalties lift the evening and night lines above their own levels, and still lands within 0.1 dB of the day, because a night that quiet cannot move it.
Impulsive-sound prominence (NT ACOU 112)
Section titled “Impulsive-sound prominence (NT ACOU 112)”An impulse annoys beyond its energy, so environmental surveys after ISO 1996-2 penalize periods containing prominent impulsive sounds; NT ACOU 112:2002 makes that penalty objective. From the A-weighted, time-weighting-F level history of a single event, the onset rate (dB/s) and the level difference (dB) of the onset (which qualifies when steeper than 10 dB/s, clauses 4.5–4.7) predict the perceived prominence (clause 7, Formula 1):
designed to peak around 15 for very sudden, loud impulses.
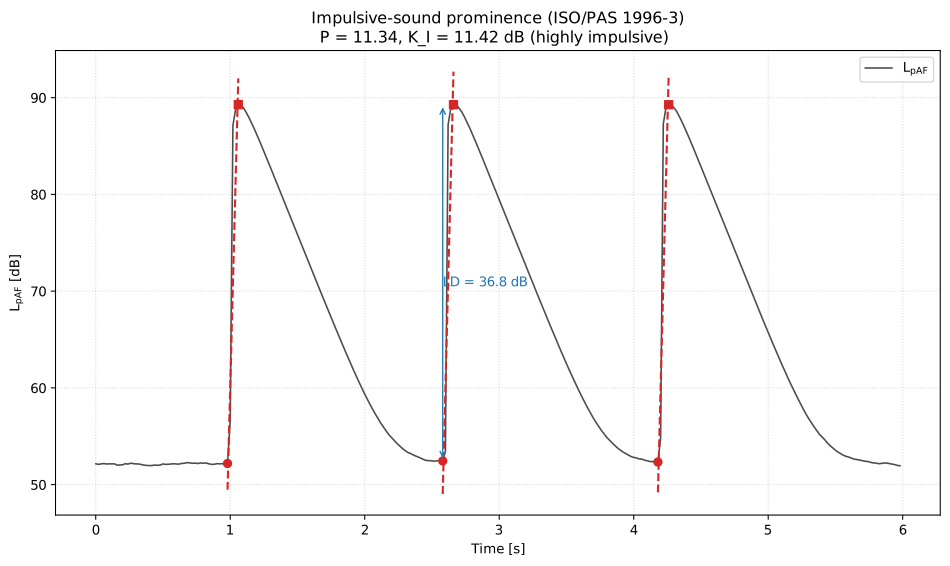
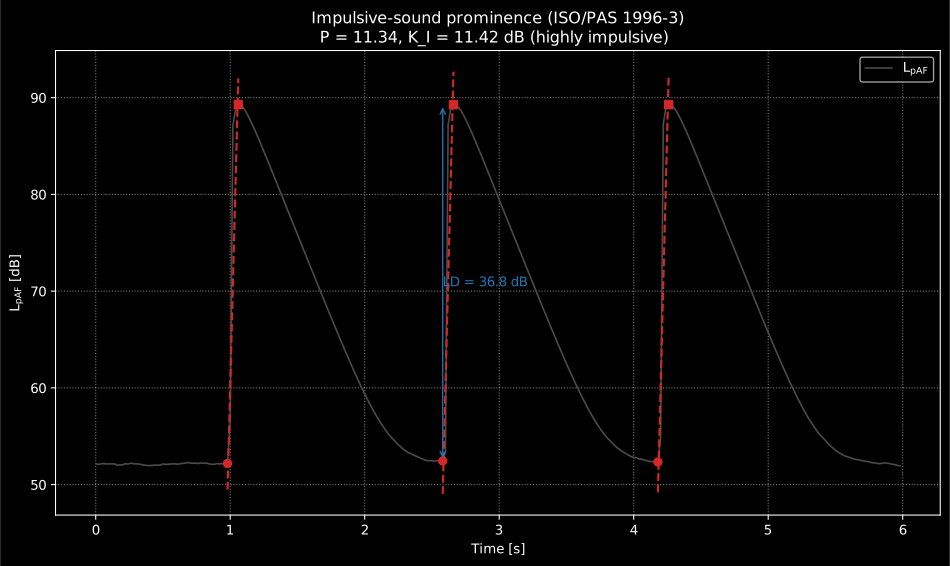
Both inputs of are geometry on this trace, which is why the method needs a level history and not a level. The onset rate is the slope of the fitted line through the rise, in dB/s, and the qualifying threshold of 10 dB/s is a steepness on this axis; the level difference is the height of the same rise. Three strikes are detected here and only the steepest-and-tallest one governs the adjustment.
The adjustment to the measurement-period level takes the governing (highest-) impulse (clause 8, Formula 2):
and the whole-day rating level combines the adjusted periods energetically (clause 8, Note 1):
is exactly the kind of source-character adjustment that enters the ISO 1996-1 composite rating level above. The anchors and dB are reproduced exactly.
Which document to cite. ISO has since published the same construction as ISO/PAS 1996-3:2022, so a survey report may cite either; the prominence and the adjustment implemented here follow the NT ACOU 112 formulation that the PAS reproduces. What requires an adjustment at all is ISO 1996-2:2017, the measurement part: the objective procedure only decides how large the adjustment is, and it is ISO 1996-1 that then combines the adjusted periods into a rating level.
See the Impulse Prominence guide for usage.
Outdoor propagation (ISO 9613-1/2)
Section titled “Outdoor propagation (ISO 9613-1/2)”Atmospheric absorption (ISO 9613-1)
Section titled “Atmospheric absorption (ISO 9613-1)”Air is a lossy medium: a propagating tone loses energy to shear viscosity and heat conduction (classical and rotational losses, growing as ) and to the vibrational relaxation of the oxygen and nitrogen molecules, each an energy reservoir that resonates near a humidity- and temperature-dependent relaxation frequency. ISO 9613-1:1993, Eq. (5) gives the pure-tone attenuation coefficient in decibels per metre:
with the oxygen and nitrogen relaxation frequencies , of
Eq. (3)/(4), the reference conditions K, kPa
(Clause 4.2) and the molar water-vapour concentration from the relative
humidity (Annex B). At low frequency ; near each relaxation
frequency the corresponding term peaks and rolls off, which is why rises
by two decades from 50 Hz to 10 kHz and why raising the humidity sweeps a peak
across the band. The library reproduces Table 1 to under 0.4 % (the standard’s
own printed precision), well inside its stated %; passing
exact_midband=True snaps each frequency onto the exact midbands
(Note 5) used to compute that table. The same
is the only route to the ISO 354 power attenuation coefficient
, exposed as air_attenuation_m.
That % is not unconditional. Table 1 is tabulated from 50 Hz to 10 kHz, −20 to +50 °C and 10 to 100 % relative humidity at one atmosphere, and the % accuracy is claimed only for molar water-vapour concentrations between 0.05 % and 5 % with the temperature between 253 and 323 K (Clause 7.1); outside that humidity window it degrades to about % (7.2) and below % to about % (7.3). Because multiplies path length, that percentage becomes a level error that grows with distance: the same % on a coefficient of 30 dB/km is dB at 30 m and dB at a kilometre, which is why atmospheric absorption is usually the largest single uncertainty in a long-range prediction and why a measured humidity is worth more than a carefully measured temperature: the relaxation frequencies move with humidity, so the attenuation in a given band is far more sensitive to it. Interpolating the printed table is expressly discouraged (Clause 6.4); the equations, which is what the library evaluates, are the intended route.
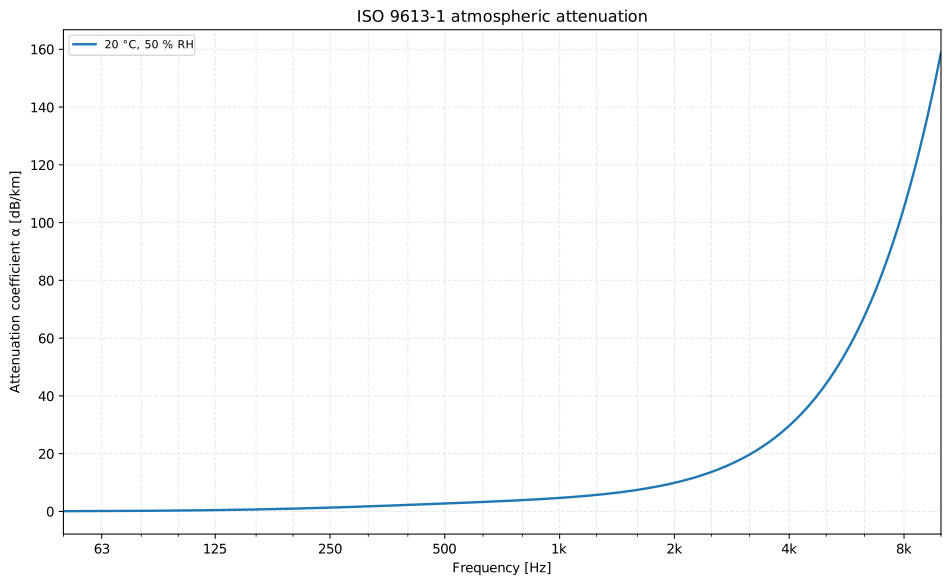
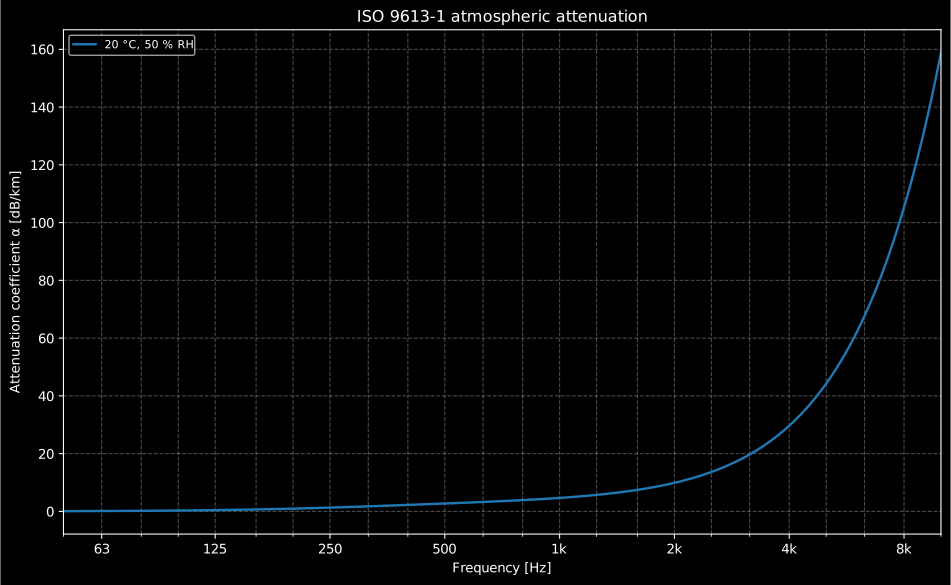
The ISO 9613-1 coefficient for the 20 °C, 50 % relative-humidity reference atmosphere: the rise spans two decades from 50 Hz to 10 kHz.
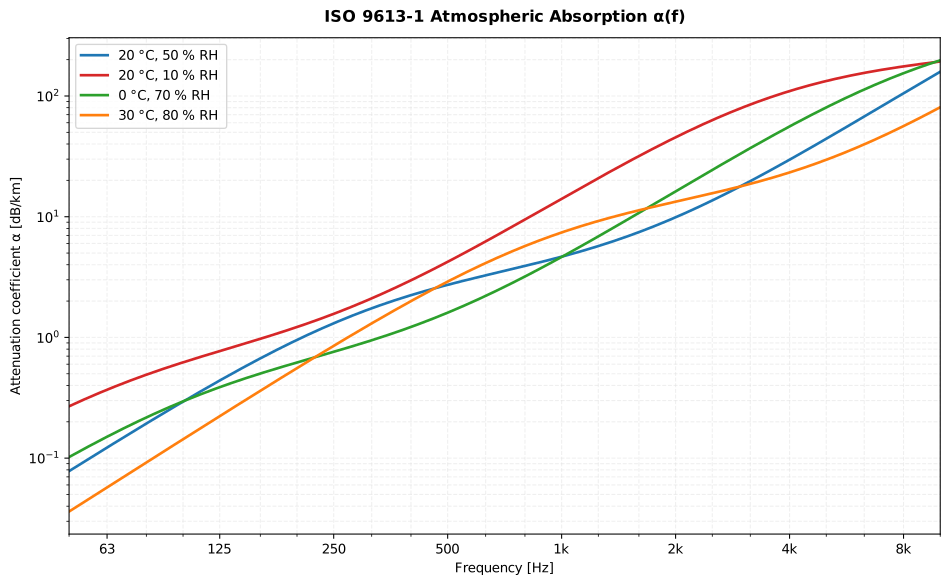
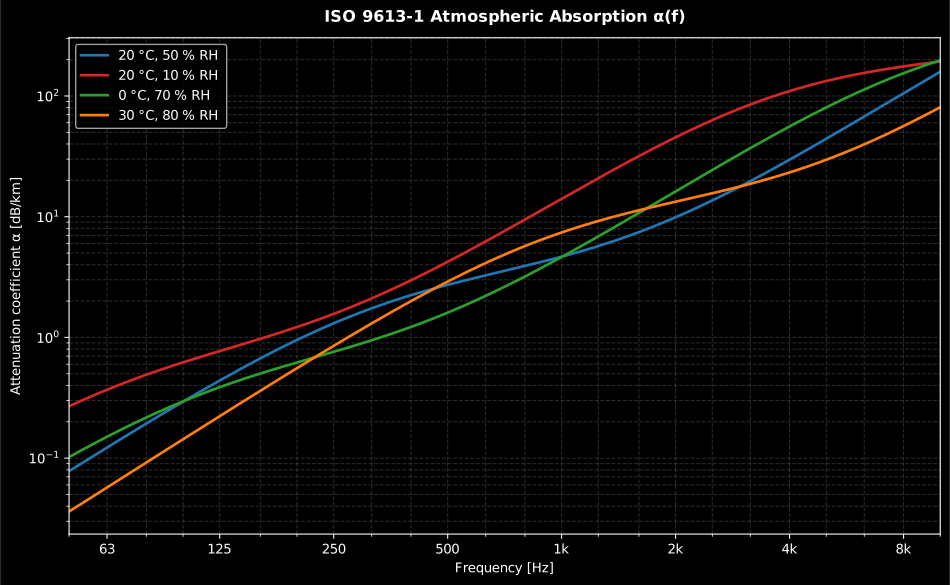
The humidity claim of the paragraph above, drawn: four atmospheres, and a spread far wider than the % claimed for any one of them. At 2 kHz the coefficient is 9.9 dB/km at the 20 °C / 50 % reference and 45.5 dB/km at the same temperature and 10 % humidity, a factor 4.6 from humidity alone, worth 36 dB over a kilometre. Note which way it goes: drying the air increases the mid-band attenuation, because the oxygen relaxation frequency falls with humidity and drags its peak down into the band. Temperature moves the curves far less: 0 °C at 70 % and 20 °C at 50 % differ by 0.02 dB/km at 1 kHz.
Outdoor propagation, general method (ISO 9613-2)
Section titled “Outdoor propagation, general method (ISO 9613-2)”ISO 9613-2:1996 predicts the octave-band level at a receiver under downwind propagation: a light wind blowing from source to receiver, or the moderate ground-based temperature inversion that bends rays the same way (clause 5), as (Eq. (3)), where is the directivity correction and is the octave-band attenuation, a sum of independent physical mechanisms (Eq. (4)):
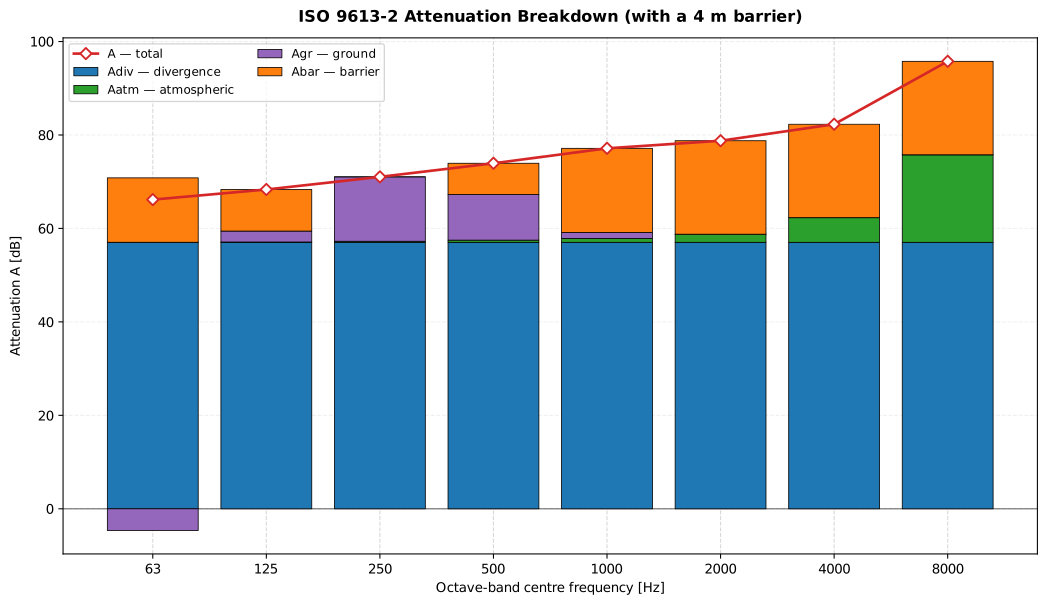
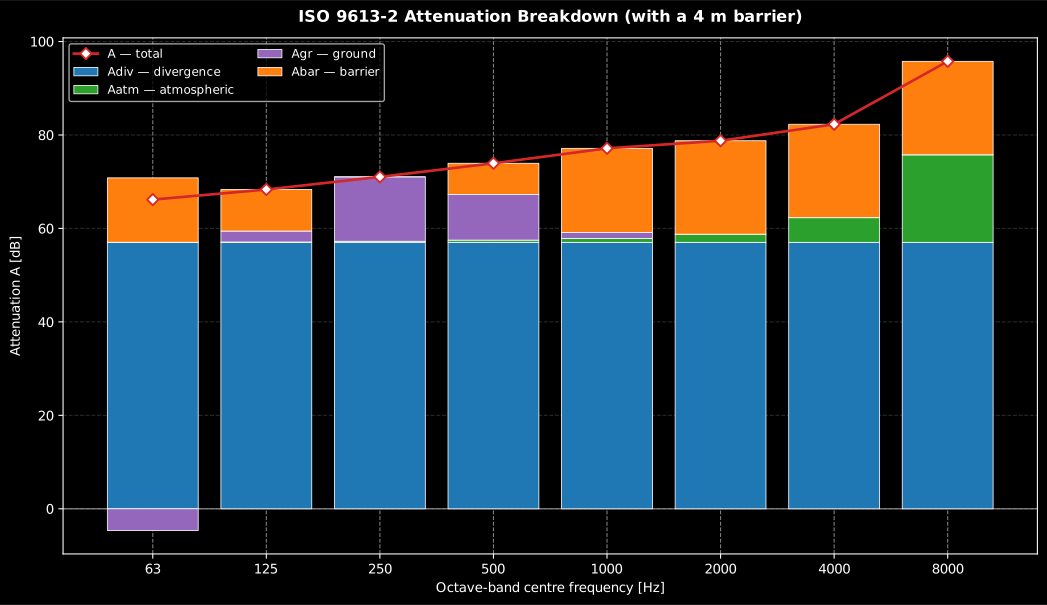
The four terms at their true relative sizes, band by band, for a 200 m path over porous ground with a 4 m barrier. is 57 dB in every band because it is pure geometry. is nothing at 63 Hz and 18.7 dB at 8 kHz, so it is the term that decides how far high frequencies travel and no other. is where the low bands live and is negative at 63 Hz (−4.6 dB: the ground reflection adds energy rather than removing it). is at its 20 dB cap from 2 kHz up but falls to zero at 250 Hz, because the top-edge form subtracts the ground effect the screened path gives away, , and 250 Hz is exactly where peaks. Which term is worth refining depends entirely on the band and the geometry.
The library implements the four general terms of Clause 7; the informative (foliage, industrial sites, housing) and reflections are left to the caller. Geometrical divergence is spherical spreading from a point source, dB with m (Eq. (7)): exactly 51 dB at 100 m, +6 dB per distance doubling. Atmospheric absorption is (Eq. (8)) with the ISO 9613-1 coefficient above. Ground effect (Eq. (9)) sums a source, receiver and middle region, each evaluated from the Table 3 functions and its ground factor (0 hard, 1 porous); a negative denotes a net gain from the ground reflection. An alternative A-weighted-only form (Eq. (10)) is offered for porous ground when only the A-weighted level matters, paired with the solid-angle index (Eq. (11)). Screening by a barrier is the diffraction insertion loss
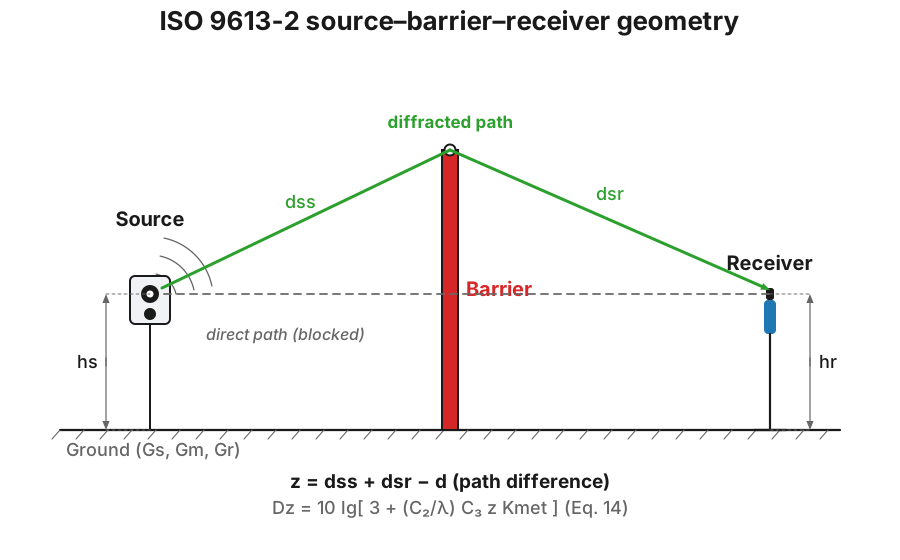
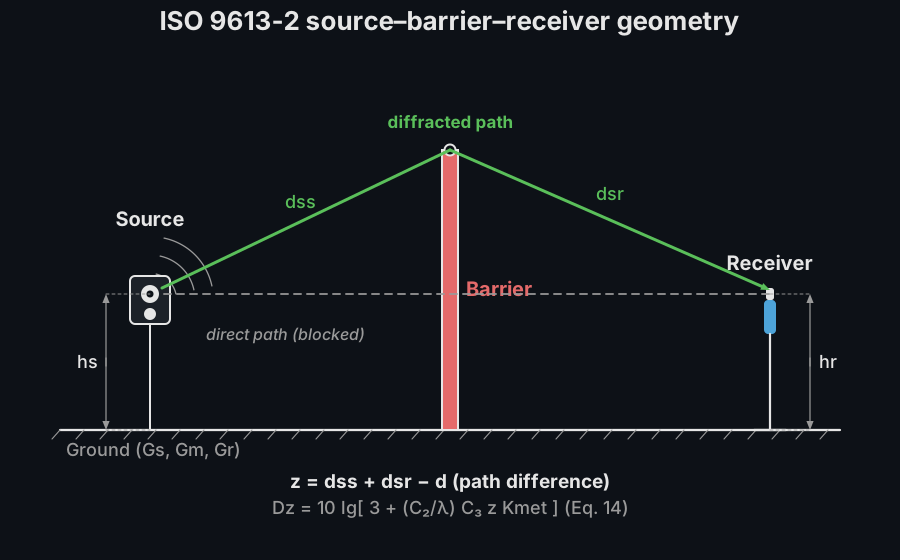
(Eq. (14)) with (or 40 when ground reflections are handled by image sources), for a single edge or Eq. (15) for a double edge, the path-length difference (Eq. (16)/(17)), wavelength and the meteorological factor (Eq. (18)); is capped at 20 dB (single) or 25 dB (double). For a top-edge barrier the ground effect of the screened path is folded into the screening term, (Eq. (12), Note 13); for a lateral (vertical-edge) barrier and the ground term is kept (Eq. (13)). (The standard fixes inside the screening term rather than deriving from the temperature, so the barrier attenuation is temperature-independent by construction; the atmospheric-absorption term above is not.) The long-term average level subtracts the meteorological correction (Eq. (6), (21)/(22)).
Where the method applies, and what counts as a barrier. It is defined for the eight nominal octave midbands from 63 Hz to 8 kHz and for point sources, an extended source being decomposed into point sub-sources (clauses 4–5), so a one-third-octave chain or a 31.5 Hz band is outside it. It predicts the downwind level; an upwind or crosswind situation is reached only through the long-term correction , never by evaluating Eq. (3) directly. The A-weighted-only ground form of Eq. (10) carries two further conditions of its own: porous or mostly porous ground, and a sound that is not a pure tone. And an object earns a only if it qualifies as a barrier under clause 7.4: a surface density of at least 10 kg/m², a closed surface with no large gaps, and a horizontal dimension normal to the source-receiver line greater than the wavelength, so a slatted fence, a hedge or a wall the sound simply passes around is modelled as no barrier at all, not as a weak one. Crediting one is worth many decibels of error in the wrong direction. Finally, Table 5 gives the accuracy by geometry rather than as one range: about dB only for a mean source-receiver height between 5 and 30 m at distances under 100 m, and about dB in every other case within 1000 m, with no accuracy stated beyond 1000 m, where the method is an extrapolation.
Occupational noise exposure (ISO 9612)
Section titled “Occupational noise exposure (ISO 9612)”The quantity itself, , is defined from sound exposure in Signal Analysis; this section is about measuring it in a workplace and bounding its uncertainty.
ISO 9612:2009 is the engineering method (accuracy grade 2) for a worker’s daily noise exposure level , normalised to a nominal 8 h day. Three measurement strategies trade effort for representativeness. The task-based method (Clause 9) splits the day into tasks, energy-averages samples per task (Eq. 7) and sums the task contributions energetically (Eq. 9/10). The job-based method (Clause 10) energy-averages random samples over a homogeneous exposure group (Eq. 11) and normalises the effective-day duration (Eq. 12); the full-day method (Clause 11) does the same arithmetic on whole-day measurements (Eq. 13).
Where the microphone goes. With a sound level meter the preferred position is the worker’s head position with the worker absent, in the centre plane of the head, on a line with the eyes and with the microphone axis parallel to the direction of view, and where the worker must be present, at 0.1 m to 0.4 m from the entrance of the external ear canal on the side of the more exposed ear (clause 12.4). A body-worn personal sound exposure meter has its microphone on top of the shoulder, at least 0.1 m from the ear-canal entrance on the more exposed side and about 0.04 m above the shoulder, with microphone and cable fastened so that clothing and handling cannot fake a result (12.3). A field calibration is performed before and after each series, and a drift above 0.5 dB discards the series (12.2). That geometry is what the dB below buys: it is not a property of the instrument but the price of the position, and in the job and full-day budgets it is usually the second-largest term after the sampling spread, so a position taken loosely does not merely widen the interval, it quietly voids the grade-2 claim.
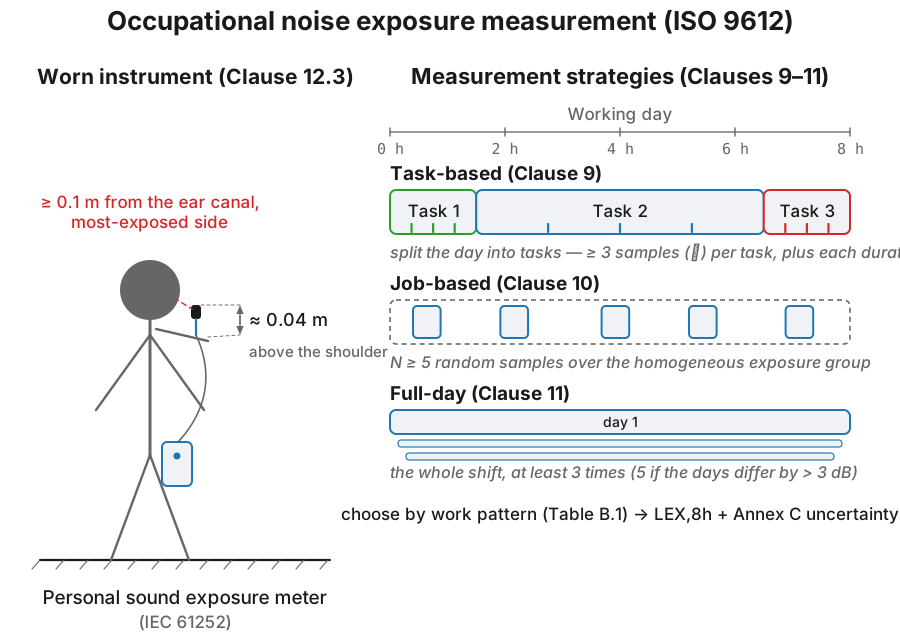
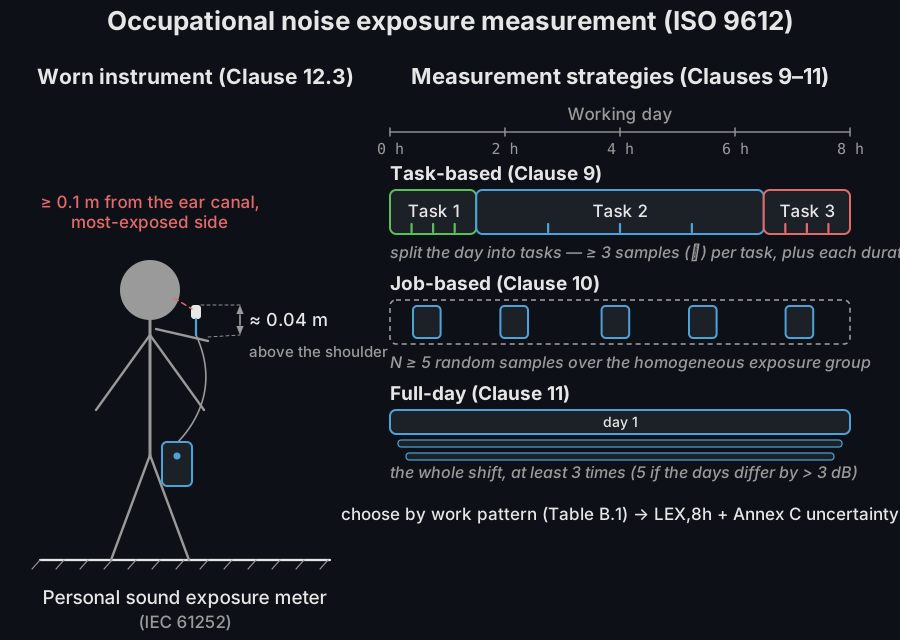
The Annex C uncertainty budget is normative. The combined standard uncertainty is (C.1) and the expanded uncertainty is with for a one-sided 95 % interval (Clause 14), so the reported upper limit is . The task and job methods differ in an instructive way: the task noise-sampling uncertainty divides the summed squared deviations by (the standard error of the mean, Eq. C.6) whereas the job/full-day sampling uncertainty is the plain sample standard deviation with denominator (Eq. C.12), so the same spread contributes more in the job method (fewer, coarser samples). The task budget (Eq. C.3) adds the sensitivity coefficients (Eq. C.4) and (Eq. C.5) and an optional task-duration uncertainty (Eq. C.7); the job/full-day budget (Eq. C.9) reads from Table C.4 as a function of and adds the instrument uncertainty (Table C.5) and microphone-position uncertainty dB in quadrature. Peak levels are reported without an uncertainty: Annex C provides no method for them (Table C.5, Note 1). The three worked examples of Annexes D (task, dB, dB), E (job, dB, dB) and F (full-day, dB, dB) are reproduced to the standard’s printed precision: every intermediate of Annex E is digit-exact, and its final level differs only by the standard’s own pre-rounding of the effective-day level (see the Occupational Noise Exposure guide).
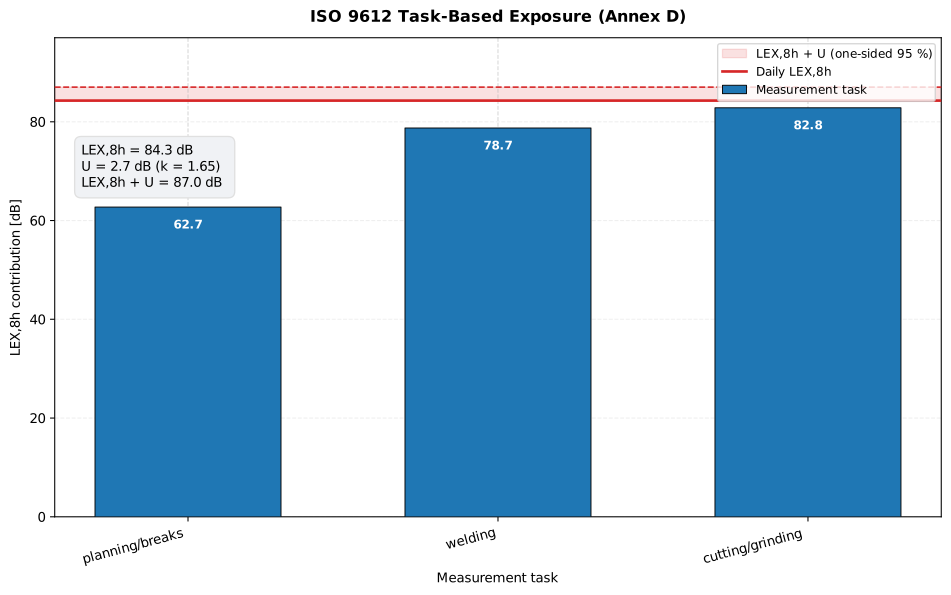
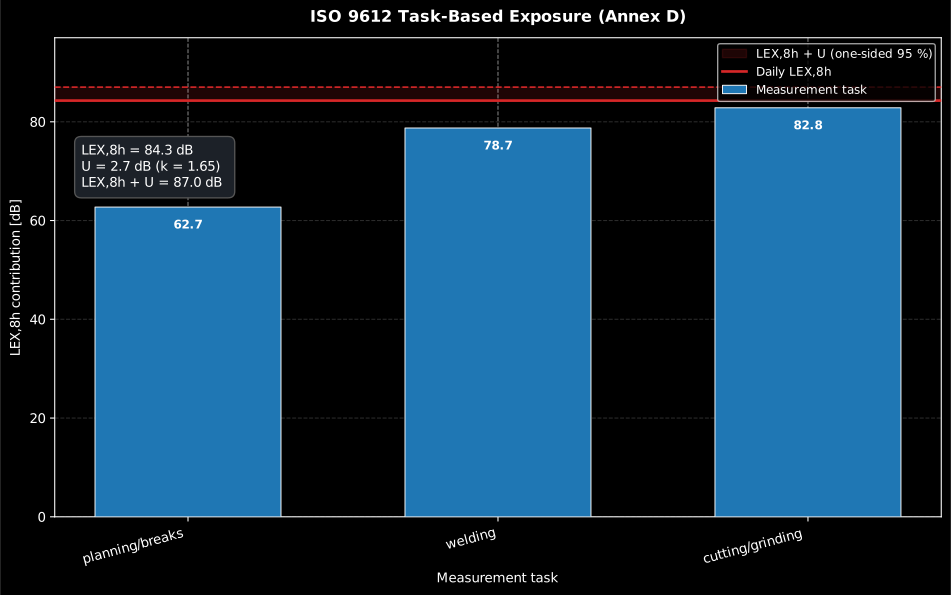
What the budget buys: the Annex D worked day, its three task contributions, the energy-summed and the band up to that the one-sided 95 % interval adds on top. The reported result is the pair, not the line, and with dB the upper limit sits 2.7 dB above the number, which is enough to cross an action value on its own.
See the Outdoor Propagation guide and the Occupational Noise Exposure guide for usage.
Sound power determination (ISO 3744/3745/3746, ISO 3741, ISO 9614-1/2/3)
Section titled “Sound power determination (ISO 3744/3745/3746, ISO 3741, ISO 9614-1/2/3)”The sound power level ( pW) is an emission quantity: unlike a pressure level it does not depend on the receiver distance or the room. Three families recover it, one per measured quantity, and the choice is dictated by the room available. Sound pressure over an enveloping surface in a free field above a reflecting plane assumes the intensity normal to that surface is the mean-square pressure divided by : ISO 3744 (engineering) and ISO 3746 (survey) below, and ISO 3745 (precision) when the room is anechoic; read in a diffuse field instead, that same pressure turns the room’s own absorption into the calibration, which is ISO 3741. Sound intensity measures the flux directly and needs no qualified room at all, at the price of a two-channel probe and the field indicators that police it: ISO 9614-1 at discrete points, and ISO 9614-2 (engineering) and ISO 9614-3 (precision) by scanning. Surface velocity reads the radiating casing with an accelerometer and takes no acoustic measurement at all, paying for that freedom with a radiation factor: that is ISO/TS 7849, whose factor is the radiation efficiency derived in the vibration reference.
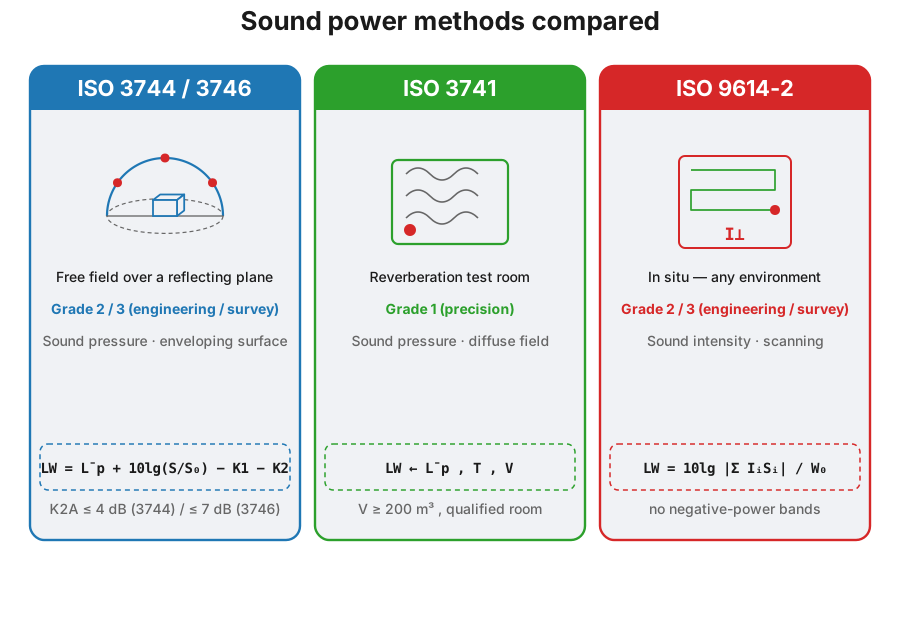
The seven routes to , one row per measured quantity: a sound pressure, a sound intensity, or the surface velocity of the casing.
Enveloping-surface pressure (ISO 3744/3746)
Section titled “Enveloping-surface pressure (ISO 3744/3746)”Over a reflecting plane the free-field relation is simply : the mean-square pressure averaged over an enveloping surface of area , multiplied by , is the radiated power. Two corrections restore that idealisation. Uncorrelated background noise adds its mean square to the source’s, so with the margin the source-only level is recovered by subtracting (from ). The reverberant field of a non-anechoic room adds a near-uniform energy density to the direct , so the surface level exceeds the free-field value by their ratio, , with the room’s equivalent absorption area.
Neither correction is unconditional, and both gate the result. For , ISO 3744 clause 8.2.3 sets a ladder on the margin: above 15 dB the correction is taken as zero, between 6 and 15 dB the formula applies, and below 6 dB it is capped at the value it reaches at 6 dB (1.3 dB), and the reported power becomes an upper bound rather than a determination. (ISO 3746 uses the same shape with coarser A-weighted thresholds: 10 dB, 3 dB and a 3 dB cap.) The honest response to a 2 dB margin is a quieter time of day or a measurement surface closer to the source, not a larger correction. For , it may be neglected below 0.5 dB, and the engineering method is valid only while dB (7 dB for the ISO 3746 survey method, clause 4.3), so a room that returns 6 dB is not a correction to apply but a room to reject. And read the direction of carefully: it grows with , so enlarging the measurement surface makes the room correction worse, which is the opposite of the intuition most operators bring to it.
The surface is built on the reference box, the smallest right parallelepiped
that just encloses the source, whose sides are , and ; over one
reflecting plane the characteristic dimension is
(clause 7.1). A hemispherical
surface needs a radius , at least 1 m (0.5 m for small products)
and at most 16 m (7.2.3); a box surface needs a measurement distance
m, preferably 1 m (7.2.4): that is the one in the formulas
below. The area is then the closed form of the
geometry: a hemisphere over one reflecting plane (halved and
quartered for two and three planes), a one-plane box with
, , . The microphone positions
are normative rather than free: Annex B tabulates equal-area coordinates on the
hemisphere; Table B.1 for sources that may emit discrete tones, Table B.2 for
broadband ones, of which the engineering grade uses 10 key positions over one
reflecting plane (5 over two, 3 over three), with the survey method taking a
reduced subset. measurement_positions() returns them scaled to the chosen
radius, and plot_microphone_positions() draws the array before anything is
measured. ISO 3746 (survey) shares
the maths with looser criteria. The expanded uncertainty is
.
Precision grade in anechoic rooms (ISO 3745)
Section titled “Precision grade in anechoic rooms (ISO 3745)”ISO 3745:2012 is the grade-1 (precision) sibling: a qualified anechoic or hemi-anechoic room removes the reverberant field, so there is no term and the corrections become meteorological. The power level is (Eq. 14/15) over a full sphere or hemisphere , with the background correction applied per microphone position before the energy average (Eq. 11); no correction is needed above a 15 dB margin, and below 10 dB (250 Hz – 5 kHz) or 6 dB (edge bands) the correction is clamped and the result flagged as an upper bound (clause 9.4.2). The meteorological terms are and with K, K: at the 23 °C / 101.325 kPa reference exactly and dB; and with restores the ISO 9613-1 air absorption over the measurement radius. The Annex D/E microphone arrays are built in as digit-exact coordinate tables (40 equal-area positions; the mirror set 21–40 is added when the band-SPL spread exceeds , clause 9.3.2), and the same positions yield the directivity index (Eq. 21). The clause 10.5 uncertainty example, dB, is reproduced, along with the Table 2/3 per-band values.
Reverberation room (ISO 3741)
Section titled “Reverberation room (ISO 3741)”In a qualified diffuse field the steady energy density ties the power to the room absorption, giving plus higher-order corrections, with and . The Waterhouse correction compensates the extra energy stored in the boundary layer that interior microphones miss (, so it fades as frequency rises); the term is the mean-free-path air correction, and , carry the result to the reference meteorological conditions (23 °C, 101.325 kPa). The comparison method subtracts a reference source of known power measured in the same room, , so the absorption-area, Waterhouse and terms cancel and the room need not be characterised.
Discrete-point intensity (ISO 9614-1)
Section titled “Discrete-point intensity (ISO 9614-1)”Part 1 holds the probe still. One position stands for each segment of the measurement surface, so the partial power is (Eq. 11) and the sound power is (Eq. 12). That sum is printed without the absolute-value bars of the general definition because clause 9.2 disposes of the negative case instead: a band whose comes out negative is outside the method rather than a band with a level to report. One segment carrying negative power is ordinary, and is what exists to quantify.
What separates Part 1 from a scan is not the integral but what decides whether it was sampled finely enough, and with a fixed set of positions the surface has to answer that itself. The Annex A indicators average over positions without area weighting: is the temporal variability (Eq. A.1), and are the reactivity and recirculation indicators (Eqs. A.3 to A.7), and is the field non-uniformity (Eqs. A.8 and A.9), which is Part 1’s own. Annex B turns it into a position count: criterion 2 asks (Eq. B.2) with from Table B.2, so a surface that radiates unevenly demands more positions, band by band, and the grade a band earns is the grade whose that inequality still satisfies. Criterion 1, (Eq. B.1), puts the probe against the field before any of that, and no amount of averaging rescues a band that fails it. The gate figure in the next subsection is drawn in exactly these names, because they are Part 1’s.
Intensity scanning (ISO 9614-2)
Section titled “Intensity scanning (ISO 9614-2)”Sound intensity is the net energy flux , so by the divergence theorem the power through a closed surface is . A steady source outside the surface contributes zero net flux (its energy enters and leaves), which is why intensity rejects stationary background noise, but it can still drive a band’s negative, in which case that band is not determinable.
What the indicators are judging. The surface is divided into at least four contiguous segments (clause 8.2) and each is swept continuously along parallel lines whose mean spacing does not exceed the mean distance from that segment to the source surface, with the probe axis held normal to the surface throughout (8.1). A manual sweep runs at 0.1 to 0.5 m/s (0 to 1 m/s mechanically) and lasts at least 20 s per segment; the segment stands at least 200 mm off an extended vibrating surface, or 100 mm off a small compact one (8.2). The engineering grade takes two sweeps per segment along orthogonal paths and records each separately (8.3.1), and it is the agreement between those two that the Table 2 repeatability criterion tests, which is why a failing band is far more often a scanning problem than an instrument problem. Two checks belong on site rather than in the calculation: a windscreen wherever a mean flow above 4 m/s cannot be ruled out (5.3), and the probe-reversal check of 6.2.2: rotate the probe 180°, and the two indicated intensities must have opposite signs and differ by less than 1.5 dB in the maximum band, or the phase match has not survived the environment.
Two normative field indicators then gate validity: the surface pressure-intensity indicator (reactivity) and the negative-partial-power indicator (recirculation), together with the probe’s dynamic capability ( dB grade 2, 7 dB grade 3), which must exceed . A band earns the engineering grade when , dB and the two repeated sweeps agree within the Table 2 limit.
The same two indicators carry three sets of names across the ISO 9614 family: ISO 9614-1 calls them (pressure-intensity), (negative partial power) and (field non-uniformity); Part 2 writes and ; Part 3 writes and . Each subsection here uses its own part’s symbols. The -to- naming is the one used in Sound intensity.
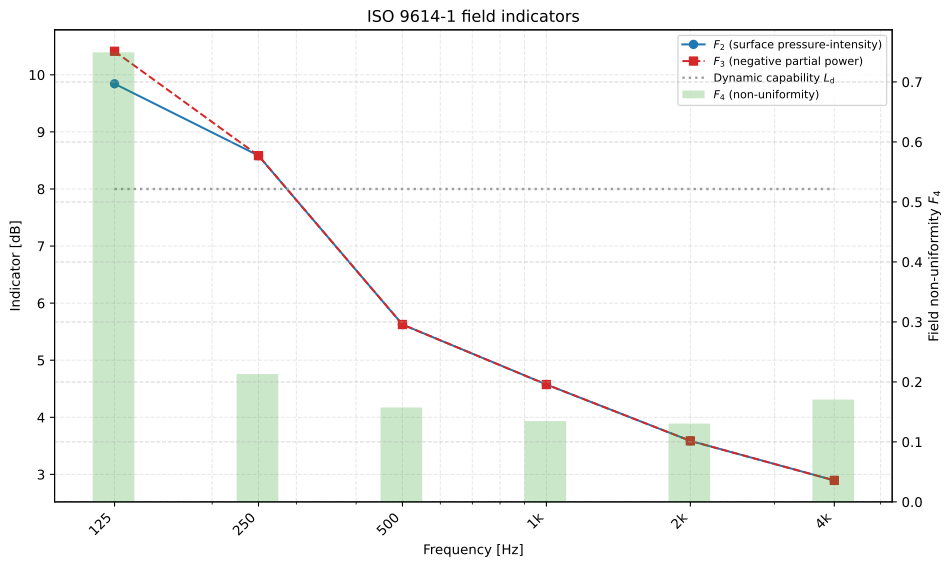
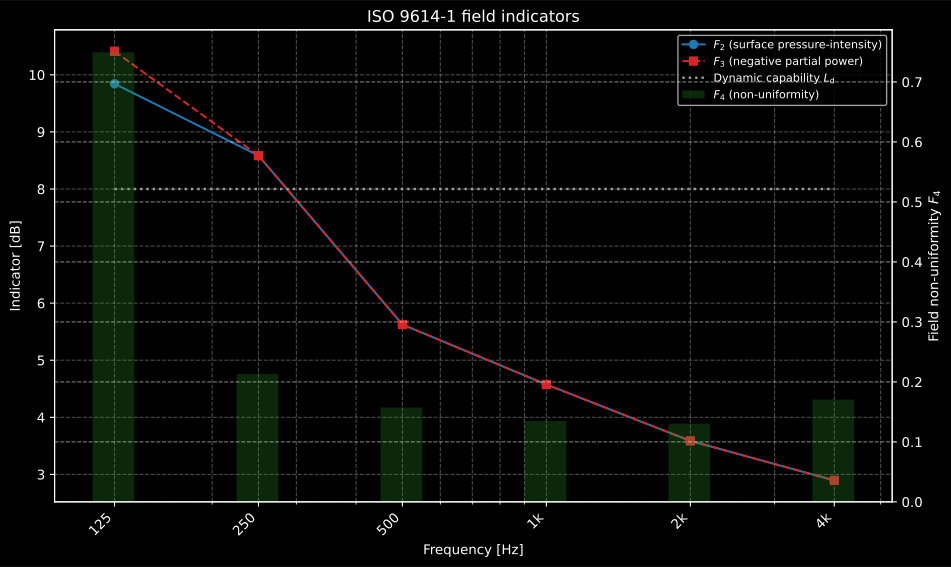
The gate as a picture rather than an inequality, drawn here in the ISO 9614-1 naming, for what Part 2 calls . The reactivity indicator climbs towards low frequency and crosses the dynamic-capability line at 125 Hz: that band fails, and no amount of averaging will rescue it, because the cause is the field near the surface and not the analyser. rising above in the same band reveals inward-flowing partial intensity, and the bars set how many positions the surface needs.
Precision intensity scanning (ISO 9614-3)
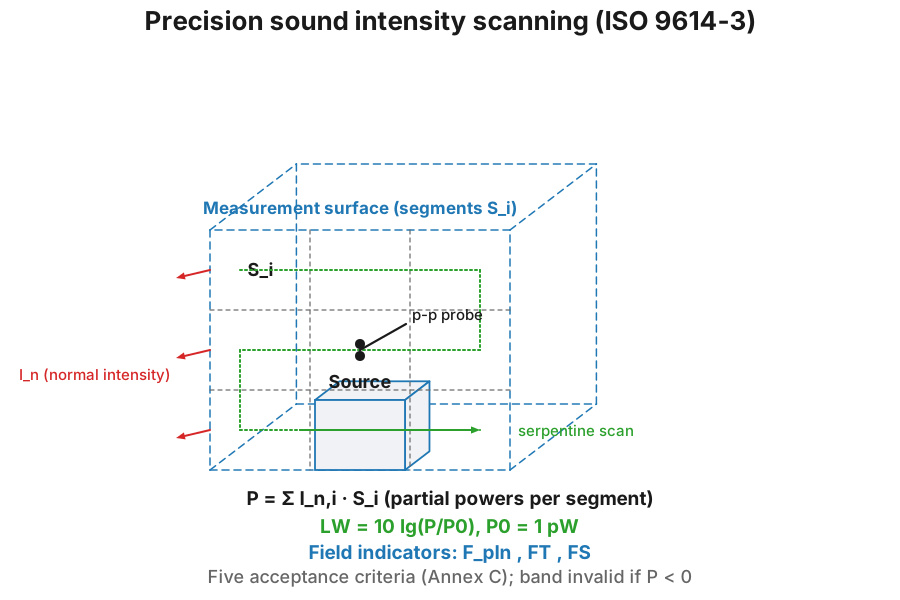
Section titled “Precision intensity scanning (ISO 9614-3)”ISO 9614-3:2002 upgrades the scanning method to precision grade with a tighter indicator machinery. The partial powers (Eq. 5) sum as before, but validity now rests on the signed and unsigned pressure-intensity indicators (Eqs. B.3/B.6, the F2/F3 of ISO 9614-1) and the normalized intensity non-uniformity (Eq. B.8), through five acceptance criteria (Annex C): scan repeatability (C.1), dynamic capability with the precision bias-error factor dB (C.2), dB (C.3), (C.4) and the scan-density convergence (C.5). Eq. 10 normalizes the result to the reference meteorological conditions, . Bands whose net power is negative are not determinable (clause 9.2) and are flagged. A uniform normal intensity recovers the power exactly (100 µW over 3.75 m² → 80.0 dB re 1 pW), independent of how the surface is segmented.
See the Sound Power guide for the choice of method, and the pressure, reverberation-room, intensity-scanning, discrete-point intensity and surface-vibration guides for usage.
References
Section titled “References”- Attenborough, K., & Van Renterghem, T. (2021). Predicting outdoor sound (2nd ed.). CRC Press. https://doi.org/10.1201/9780429470806The ground impedance and meteorological effects underlying the ground-effect and barrier terms.
- Fahy, F. J. (1995). Sound intensity (2nd ed.). E&FN Spon. https://doi.org/10.4324/9780203475386ISBN 978-0-419-19810-9. The intensity physics behind the scanning methods: active intensity and the p-p error budget.
- International Organization for Standardization. (1993). Acoustics — Attenuation of sound during propagation outdoors — Part 1: Calculation of the absorption of sound by the atmosphere (ISO 9613-1:1993). The pure-tone attenuation coefficient and its relaxation physics.
- International Organization for Standardization. (1993). Acoustics — Determination of sound power levels of noise sources using sound intensity — Part 1: Measurement at discrete points (ISO 9614-1:1993). The field indicators and dynamic-capability criterion shared by the intensity-scanning methods.
- International Organization for Standardization. (1996). Acoustics — Attenuation of sound during propagation outdoors — Part 2: General method of calculation (ISO 9613-2:1996). The attenuation chain (divergence, air, ground, barrier) of the general-method section. Revised in 2024; the 1996 method is the implemented one.
- International Organization for Standardization. (2009). Acoustics — Determination of occupational noise exposure — Engineering method (ISO 9612:2009). The three measurement strategies and the Annex C uncertainty budget of the occupational section.
- International Organization for Standardization. (2010). Acoustics — Determination of sound power levels and sound energy levels of noise sources using sound pressure — Engineering methods for an essentially free field over a reflecting plane (ISO 3744:2010). The enveloping-surface method with its background and reverberant-field corrections.
- International Organization for Standardization. (2010). Acoustics — Determination of sound power levels and sound energy levels of noise sources using sound pressure — Precision methods for reverberation test rooms (ISO 3741:2010). The diffuse-field method with the Waterhouse correction and the comparison method.
- International Organization for Standardization. (2012). Acoustics — Determination of sound power levels and sound energy levels of noise sources using sound pressure — Precision methods for anechoic rooms and hemi-anechoic rooms (ISO 3745:2012). The precision anechoic method with its meteorological corrections and microphone arrays.
- International Organization for Standardization. (2016). Acoustics — Description, measurement and assessment of environmental noise — Part 1: Basic quantities and assessment procedures (ISO 1996-1:2016). The composite rating level and Table A.1 adjustments of the descriptors section.
- International Organization for Standardization. (2017). Acoustics — Description, measurement and assessment of environmental noise — Part 2: Determination of sound pressure levels (ISO 1996-2:2017). The survey standard that requires an adjustment for prominent impulsive sounds in the first place; the objective procedure only decides how large it is.
- International Organization for Standardization. (2022). Acoustics — Description, measurement and assessment of environmental noise — Part 3: Objective method for the measurement of prominence of impulsive sounds and for adjustment of LAeq (ISO/PAS 1996-3:2022). The ISO successor built on the NT ACOU 112 prominence.
- Maekawa, Z. (1968). Noise reduction by screens. Applied Acoustics, 1(3), 157-173. https://doi.org/10.1016/0003-682X(68)90020-0The screen-attenuation chart that the barrier insertion-loss formulas descend from.
- Nordtest. (2002). Acoustics: Prominence of impulsive sounds and for adjustment of LAeq (NT ACOU 112:2002). The onset-rate prominence and LAeq adjustment of the impulsive-sound section.
- Salomons, E. M. (2001). Computational atmospheric acoustics. Kluwer Academic Publishers. https://doi.org/10.1007/978-94-010-0660-6ISBN 978-1-4020-0390-5. The wave-based outdoor propagation theory behind the engineering approximations of the ISO 9613-2 section.