Sound Power in the Reverberation Room
Standards: ISO 3741Key references: Beranek & Mellow 2012
A reverberation room turns its main defect as a listening space into a measuring instrument: because the field is diffuse, a handful of microphone positions sample the whole radiated energy, and the sound power follows from the mean room level and the room’s absorption with no enveloping surface to build. That is why ISO 3741 is a grade-1 (precision) method, and why it is the laboratory route of choice for steady, broadband sources small enough to travel to a qualified room. This guide covers the direct method through the Sabine absorption area, the Waterhouse and meteorological corrections, the comparison method against a reference sound source, the qualification warnings, the accredited-style test fiche and, in section 4, the sound energy level that the same two methods give a single event. Which route fits which job, and the pressure and intensity alternatives, are weighed in Sound Power.
1. Reverberation room, precision grade (ISO 3741)
Section titled “1. Reverberation room, precision grade (ISO 3741)”Both methods are defined over the one-third-octave bands from 100 Hz to 10 kHz (clause 8.1). Annex E extends that range down to 50 Hz informatively; nothing extends it upwards. The lower bound is set by the room’s mode density, which is why Table 1 pairs the lowest band of interest with a minimum volume (200 m³ at 100 Hz, 150 m³ at 125 Hz, 100 m³ at 160 Hz, 70 m³ from 200 Hz up) and the upper bound is set by air absorption. The source under test must be no larger than about 2 % of the room volume (clause 1.2; up to 5 % only where a noise test code says what that costs in uncertainty), so that it does not load the field it is being measured in, and it must be steady over the measurement interval: Eq. 20 energy-averages and reports a rate of energy flow, so it characterises the machine only if the machine is time-invariant while it is running. A single event, one press stroke or one door slam, is described by the sound energy level of clause 9.2 instead, which section 4 covers.
The background must lie at least 6 dB below the source level in the
one-third-octave bands at and below 200 Hz and at and above 6,3 kHz, and at
least 10 dB below between 250 Hz and 5 kHz (clause 5.4.1.1), a tighter pair
of criteria than the flat 6 dB of the enveloping-surface methods, which is what
“the ISO 3741 criterion is frequency-dependent” in the parameter table below
means. Below those margins sound_power_reverberation clamps to the value
the criterion itself produces (1.26 dB and 0.46 dB respectively), warns, and the
band becomes an upper bound rather than a determination. A band whose corrected
A-weighted contribution is at least 15 dB below the largest may instead be
dropped from the range of interest altogether (clause 5.4.1.2).
In a qualified hard-walled reverberation room the field is diffuse, so a handful of microphones sample the whole radiated energy and the method reaches grade 1. The sound power comes from the mean room level , the Sabine absorption area and a chain of small corrections (ISO 3741 Eq. 20):
The bracketed term is the Waterhouse correction: near the room boundaries the sound energy density is higher than in the interior, and this term (which vanishes as frequency grows) restores the energy the interior microphones miss. (reference-quantity) and (radiation-impedance) carry the result to the reference meteorological conditions of 23 °C and 101.325 kPa,
with the speed of sound .
Two of the five terms usually go unexplained. The −6 dB is the diffuse-field relation itself: in a diffuse field the power a source feeds into the room equals , and expressing that against the two reference quantities leaves a constant, which for the references of these standards is −6 dB. The 4.34 A/S term is the first-order correction from the Sabine absorption area towards the Eyring value; 4.34 is and is the room’s mean absorption coefficient, so the term is small in a hard room and grows as the room is damped. In the example below, m² against m², so it contributes 0.32 dB in every band, negligible here, and the first term to watch when the reverberation time sits near the qualification floor. The Waterhouse term runs the other way, 1.68 dB at 100 Hz and 0.02 dB at 10 kHz on the same data: the low bands are ruled by the boundary energy the interior microphones miss, the high bands by the absorption area.
The right-hand panel of the clip below is the reverberation room. The same source runs in both rooms; in the anechoic room on the left the microphones see only what the source sends their way, so the level falls with distance and the free-field route has to integrate over a measurement surface, while in the reverberation room on the right the reflected energy fills the space and the level stops depending on where a microphone is. That is the whole reason Eq. 20 can replace a surface integral with a handful of positions and a room constant, and the reason the room, not the array, is what has to be qualified. Both routes end on the same , because sound power is a property of the source and not of the room it is measured in.
The same source in an anechoic room and in a reverberation room produces different microphone pressures, and the free-field and diffuse-field formulas converge to the same sound power level L_W.
The same source in an anechoic room and in a reverberation room produces different microphone pressures, and the free-field and diffuse-field formulas converge to the same sound power level L_W.
Where the microphones and the source go
Section titled “Where the microphones and the source go”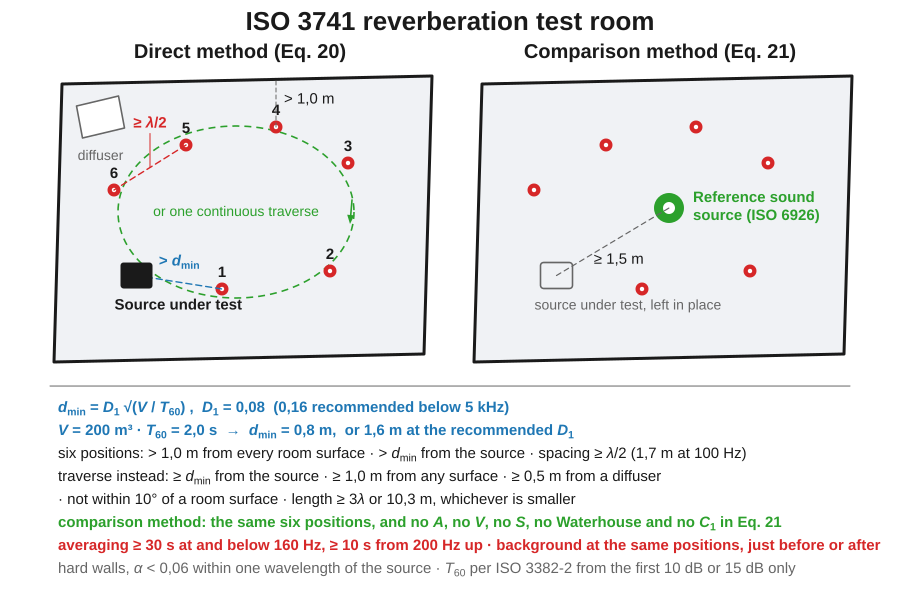
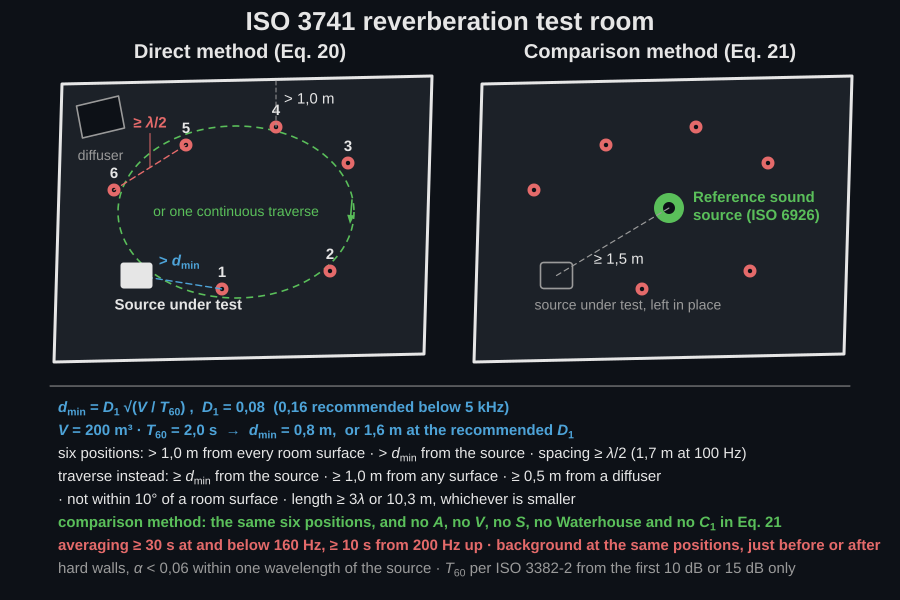
Everything Eq. 20 does rests on the array being in the reverberant part of the field, and the standard fixes that with one distance. The source sits on the floor, at least 1,5 m from any wall, and in a rectangular room asymmetrically (clause 7.3), so that it does not couple preferentially into one mode family. The nearest microphone must then stand off by
with strongly recommended below 5 kHz (clause 8.3, Eq. 8). For the room of the example below, m³ and s, that is m, or 1.6 m at the recommended , so a microphone 1 m from the source is already inside the near field this method is not measuring.
If the room has not been qualified for discrete tones per Annex D, the array is six discrete positions, each more than 1,0 m from any room surface, more than from the source, and separated from one another by at least half a wavelength at the lowest band of interest (1,7 m at 100 Hz). A continuous traverse may replace them for the levels themselves, provided every point on it keeps from the source and 1,0 m from any room surface, stays 0,5 m clear of any diffuser, does not lie in a plane within 10° of a room surface, and runs for at least or 10,3 m, whichever is the smaller. The six discrete positions are still needed to estimate the standard deviations below.
Each level is time-averaged over at least 30 s in the bands centred at and
below 160 Hz and at least 10 s from 200 Hz up (clause 8.4.1): the low bands
need the longer interval because a diffuse field is a modal average, and there
are few modes down there to average over. A traversing microphone must cover at
least two full traverses. The background reading is taken immediately before or
immediately after the source reading, at the same positions and over the same
interval; that is what background_levels is, and a spectrum measured on
another day is not it.
The SoundPowerWarning at an inter-position spread of 1.5 dB is the entry point
to the escalation, not a defect in itself. Clause 8.4.2.2 computes the standard
deviation of the six initial levels band by band (Eq. 10); above 1,5 dB in
any band the source is radiating significant discrete components for this room,
and the answer is more sampling, not a different formula: either qualify the
room per Annex D, or read the required number of positions from Table 4: six
stays six up to 160 Hz, but 400 Hz to 630 Hz goes to 12 positions for
dB and 24 above 3 dB, and 800 Hz upwards to 15 and 30, and
add source positions per Eq. 12 and Table 5. Averaging longer at six positions
buys nothing here, because the scatter is spatial. The number of positions, the
traverse geometry and the measurement time interval all belong in the test
report.
import numpy as npfrom phonometry import emission
# One-third-octave mean room SPL (dB), 100 Hz - 10 kHz, and the room's T60.freqs = np.array([100, 125, 160, 200, 250, 315, 400, 500, 630, 800, 1000,                  1250, 1600, 2000, 2500, 3150, 4000, 5000, 6300, 8000, 10000],                 dtype=float)lp = np.linspace(80.0, 70.0, freqs.size)t60 = np.full(freqs.size, 2.0)
rev = emission.sound_power_reverberation(    lp, t60, volume=200.0, surface_area=220.0, frequencies=freqs,    temperature_c=20.0, static_pressure_kpa=101.0,)print(round(rev.speed_of_sound, 1))                     # c = 343.2 m/sprint(round(float(rev.absorption_area[0]), 1))          # A = 16.1 m^2 at 100 Hzprint(round(float(rev.waterhouse_correction[0]), 2))    # 1.68 dB at 100 Hzprint(round(float(rev.sound_power_level[0]), 1))        # LW = 87.9 dBprint(round(rev.sound_power_level_a, 1))                # LWA = 92.1 dB
# Comparison method: a reference source of known LW measured at the same spots.lw_rss = np.full(freqs.size, 85.0)lp_rss = np.linspace(78.0, 69.0, freqs.size)cmp = emission.sound_power_comparison(lp, lp_rss, lw_rss, frequencies=freqs, temperature_c=20.0)print(round(float(cmp.sound_power_level[0]), 1), cmp.method)   # 86.9 comparison
rev.plot()   # reverberation-room LW spectrum, LWA in the title (needs matplotlib)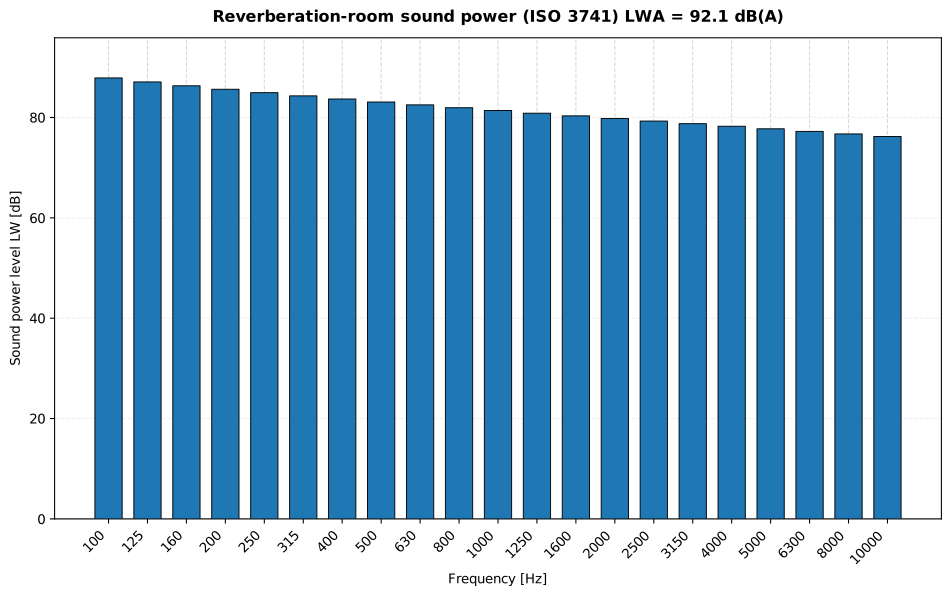
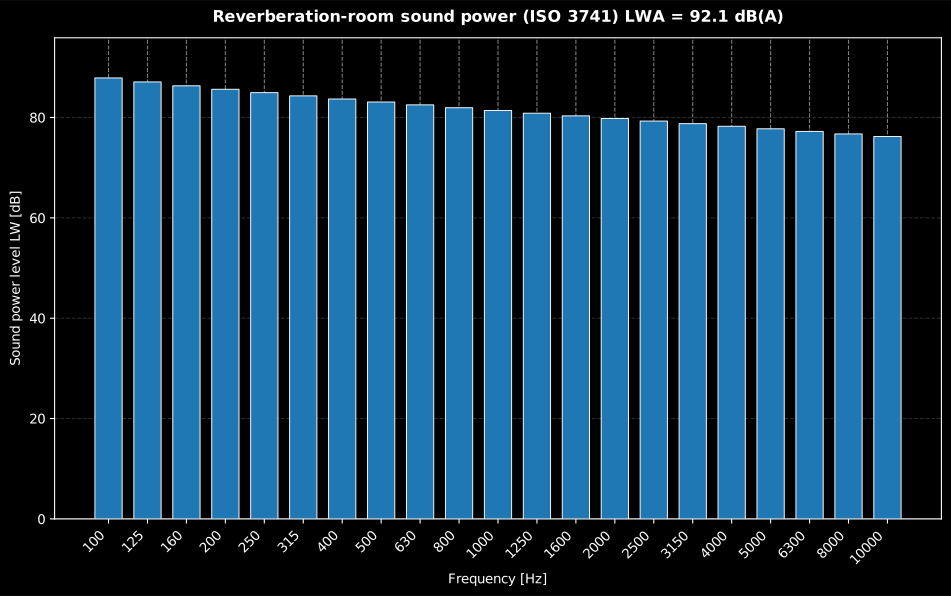
The mean room level carried through the absorption-area, Waterhouse and meteorological terms of Eq. 20 gives the one-third-octave , and the A-weighted energy sum across the 21 bands gives the in the title.
Show the code for this figure
import matplotlib.pyplot as pltimport numpy as npfrom phonometry import emission
# One-third-octave mean room SPL (dB), 100 Hz - 10 kHz, and the room's T60.freqs = np.array([100, 125, 160, 200, 250, 315, 400, 500, 630, 800, 1000,                  1250, 1600, 2000, 2500, 3150, 4000, 5000, 6300, 8000, 10000],                 dtype=float)lp = np.linspace(80.0, 70.0, freqs.size)t60 = np.full(freqs.size, 2.0)rev = emission.sound_power_reverberation(    lp, t60, volume=200.0, surface_area=220.0, frequencies=freqs,    temperature_c=20.0, static_pressure_kpa=101.0,)
# rev is the ReverberationSoundPowerResult computed above. One line:rev.plot()plt.show()
# By hand: a bar spectrum of LW with the A-weighted total in the title.freqs = rev.frequenciespositions = np.arange(freqs.size)fig, ax = plt.subplots()ax.bar(positions, rev.sound_power_level, width=0.7, color="#1f77b4")ax.set_xticks(positions)ax.set_xticklabels([f"{f:g}" for f in freqs], rotation=45, ha="right")ax.set_xlabel("Frequency [Hz]")ax.set_ylabel("Sound power level LW [dB]")ax.set_title(    f"Reverberation-room sound power (ISO 3741)  "    f"LWA = {rev.sound_power_level_a:.1f} dB(A)")plt.show()
levels may be a 1D mean spectrum or a 2D (NM, NB) array averaged over
positions. When the room volume, its reverberation time or the microphone
count fail an ISO 3741 qualification criterion (Table 1 minimum volume, the
reverberation floor, fewer than 6 positions, or an inter-position
spread above 1.5 dB), an advisory SoundPowerWarning is emitted and the
result still returns.
The five terms of Eq. 20 discussed above are all fields of that same rev,
so the balance between them can simply be drawn:
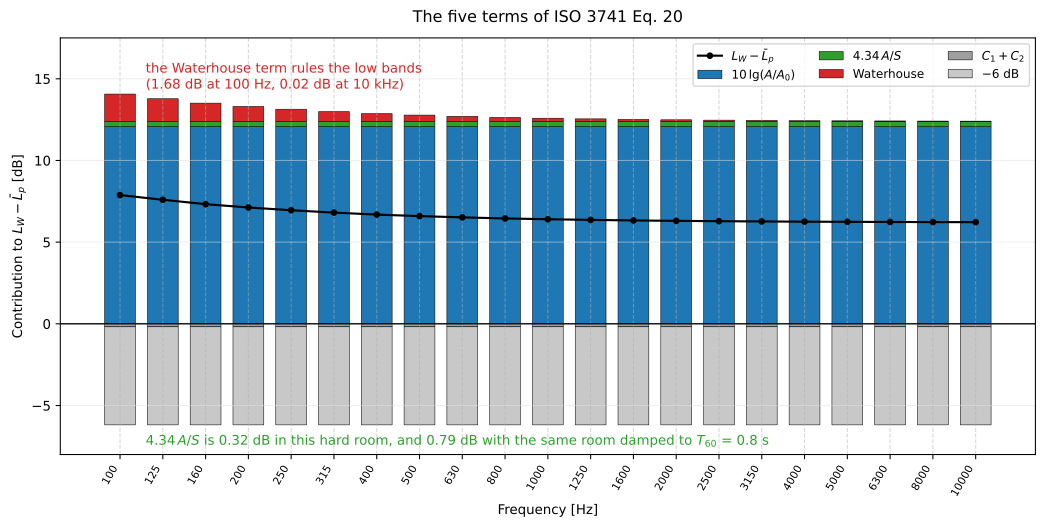
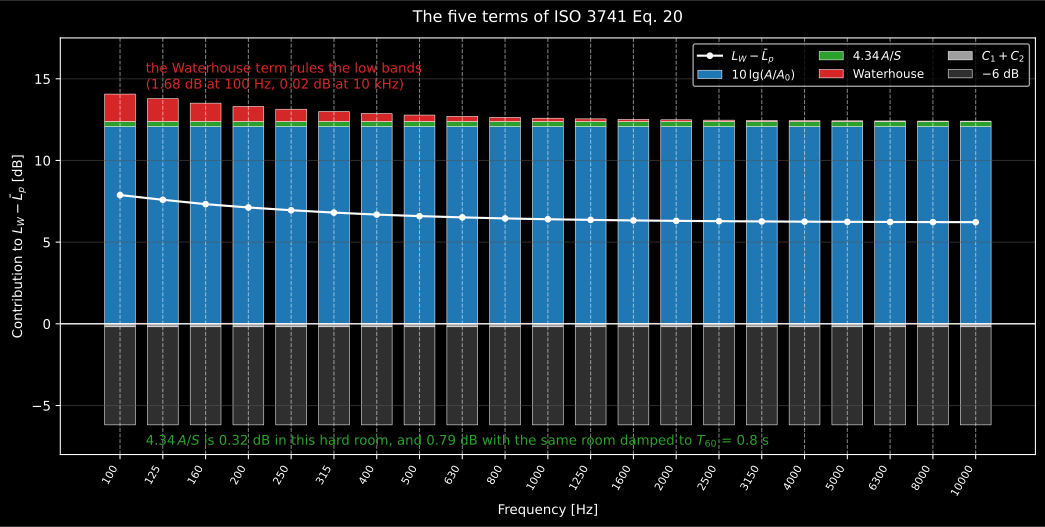
The whole of Eq. 20, band by band, on the example below. The absorption area carries the determination; the Waterhouse term is the only one with real frequency dependence and it lives entirely in the low bands; and the meteorological pair is a fraction of a decibel at ordinary conditions, which is precisely why it is worth stating that the term everyone omits, 4.34 A/S, grows with the room’s absorption rather than with frequency.
Show the code for this figure
import matplotlib.pyplot as plt
# Every term is a field of the result the first snippet of this page returns.absorption = 10.0 * np.log10(rev.absorption_area)eyring = 4.34 * rev.absorption_area / 220.0terms = [("10 lg(A/A0)", absorption), ("4.34 A/S", eyring),         ("Waterhouse", rev.waterhouse_correction),         ("C1 + C2", np.full(freqs.size, rev.c1 + rev.c2)),         ("-6 dB", np.full(freqs.size, -6.0))]
x = np.arange(freqs.size)up = np.zeros(freqs.size)down = np.zeros(freqs.size)fig, ax = plt.subplots(figsize=(11, 5.6))for label, values in terms:    ax.bar(x, values, bottom=np.where(values >= 0.0, up, down), width=0.72,           label=label)    up = up + np.clip(values, 0.0, None)    down = down + np.clip(values, None, 0.0)ax.plot(x, rev.sound_power_level - lp, "o-", label="LW - Lp")ax.set_xticks(x, [f"{f:g}" for f in freqs], rotation=60)ax.set(xlabel="Frequency [Hz]", ylabel="Contribution to LW - Lp [dB]")ax.legend()plt.show()
sound_power_reverberation() parameters
Section titled “sound_power_reverberation() parameters”| Parameter | Type | Units | Range / default | Notes |
|---|---|---|---|---|
levels | 1D or 2D array | dB | per band, or (NM, NB) | Mean room SPL; 2D is energy-averaged over positions |
t60 | float or 1D array | s | > 0 | Room reverberation time (scalar broadcasts) |
volume | float | m³ | > 0 | Room volume |
surface_area | float | m² | > 0 | Total room surface (Waterhouse, ) |
frequencies | 1D array | Hz | one per band | Required (Waterhouse needs ); enables |
background_levels | 1D or 2D array | dB | matches levels | Per-band (frequency-dependent criterion) |
temperature_c | float | °C | default 23.0 | Sets , , |
static_pressure_kpa | float | kPa | default 101.325 | Sets , |
Both this function and the comparison method of section 2 return a
ReverberationSoundPowerResult
(sound_power_level, mean_pressure_level, absorption_area,
waterhouse_correction, background_correction, c1, c2,
speed_of_sound, sound_power_level_a, method).
2. The comparison method (Eq. 21)
Section titled “2. The comparison method (Eq. 21)”The comparison method replaces the absorption-area, Waterhouse and terms by a reference sound source of known power run in the same room, so the room itself never has to be characterised:
A reference sound source is a small aerodynamic broadband source of stable output whose band-wise sound power level has been calibrated to ISO 6926, and it is that calibration, not the room, that the determination now rests on. The calibrated is stated for reference meteorological conditions, which is why survives in Eq. 21 while and the room terms cancel.
The procedure is two measurements and two backgrounds. The test source is
measured first, at the six positions or over the traverse of section 1. The RSS
is then run in the same room, at the same microphone positions or the same
traverse, with the source under test left standing where it was, and with its
own background reading (that is what background_levels_ref is for). The RSS
stands on the floor more than 1,5 m from the walls; the preferred position is
the one the source under test occupies, and where the source cannot be moved the
RSS goes as close to it as practicable but never closer than 1,5 m
(clause 8.6.1). One RSS position suffices even when the source under test needs
several. Both measurements must be made at the same temperature, pressure and
humidity (clause 8.6.2).
Because the RSS supplies the room constant, the minimum source-to-microphone distance may also be taken from the RSS reading itself (clause 8.3, Eq. 9), with and 0,8 recommended below 5 kHz. On the example below, dB in the 100 Hz band, so m, or 1.8 m at the recommended , close enough to the 0.8/1.6 m of Eq. 8 to be a useful cross-check.
What it buys and what it costs: no , no volume, no surface area and no
Waterhouse term, so a room that has never been surveyed can still return a
determination, and correspondingly, absorption_area,
waterhouse_correction and c1 come back NaN, because the method never
computes them. What it costs is that the result inherits the RSS calibration
whole, so a source whose ISO 6926 certificate has expired quietly biases every
band, and the RSS position has to sample the room the way the test source does
or the difference is measuring the two
positions rather than the two sources.
sound_power_comparison() parameters
Section titled “sound_power_comparison() parameters”sound_power_comparison(levels, levels_ref, lw_ref, *, frequencies=None, background_levels=…, background_levels_ref=…, temperature_c=23.0, static_pressure_kpa=101.325) takes the same room levels plus the reference
source’s levels and known power.
| Parameter | Type | Units | Range / default | Notes |
|---|---|---|---|---|
levels_ref | 1D or 2D array | dB | matches levels | Mean room SPL with the reference source (RSS) running |
lw_ref | 1D array | dB | per band | Known sound power of the reference source, from its ISO 6926 calibration |
background_levels | 1D or 2D array | dB | matches levels | Background for the test source; per-band on |
background_levels_ref | 1D or 2D array | dB | matches levels_ref | Background for the reference source; per-band on |
background_levels_ref background-corrects the reference-source room level
exactly as background_levels does for the test source;
both need frequencies (the ISO 3741 criterion is frequency-dependent).
3. The measurement report (.report())
Section titled “3. The measurement report (.report())”The reverberation-room result (ReverberationSoundPowerResult, ISO 3741)
writes a one-page PDF fiche laid out like a sound-power test sheet through
its own .report(), sharing the layout and the ReportMetadata container of
the pressure-method fiche.
The standard-basis line
names ISO 3741:2010 and the precision accuracy grade (grade 1) and states which
method was used, the direct method using the room equivalent absorption area
(Eq. 20) or the comparison method using a reference sound source (Eq. 21). The
per-band table lists the mean room sound-pressure level and the band
sound-power level , and the boxed carries the total and the
determination method (the reverberation result has no expanded uncertainty ).
verbose=True adds the background correction and, for the direct method,
the equivalent absorption area and the Waterhouse boundary correction ;
the basis strip states the correction model (Eq. 20 or Eq. 21), the applied
meteorological corrections / and the speed of sound, and cites the
Annex F A-weighting.
import numpy as npfrom phonometry import ReportMetadata, emission
freqs = np.array([125, 250, 500, 1000, 2000, 4000, 8000], float)# Octave-band mean room sound-pressure levels in a qualified# reverberation room of V = 200 m3, S = 240 m2, with a uniform T60 = 2.0 s.lp = np.array([80.0, 83.0, 85.0, 84.0, 80.0, 75.0, 68.0])res = emission.sound_power_reverberation(    lp, 2.0, volume=200.0, surface_area=240.0, frequencies=freqs,    temperature_c=20.0, static_pressure_kpa=101.325,)
res.report(    "sound_power_reverberation.pdf",    metadata=ReportMetadata(        client="Example manufacturing plant",        specimen="Hydraulic power pack (floor-standing)",        test_room="Qualified reverberation room, V = 200 m3, T60 = 2.0 s",        instrumentation="Class 1 sound level meter (IEC 61672-1), s/n 0042",        laboratory="Phonometry reference example",        report_id="EXAMPLE-3741",        requirement=96.0,    ),)   # LWA = 94.3 dB(A) re 1 pW -> declared limit 96 dB(A): PASS
One caveat on that example: it runs Eq. 20 on octave bands for compactness, and that is not a conforming ISO 3741 determination. Both methods are defined on one-third-octave bands, and octave-band results are formed afterwards by summing the one-third-octave band powers per Annex F (Eq. F.1), not by feeding octave levels into Eq. 20: the Waterhouse and absorption terms are frequency-dependent and would then be evaluated at the octave mid-frequency instead of at each third. Section 1’s example, 100 Hz to 10 kHz in thirds, is the conforming shape.
The example fiche is regenerated with make reports and kept rendered in the
repository; click the preview to open the PDF.
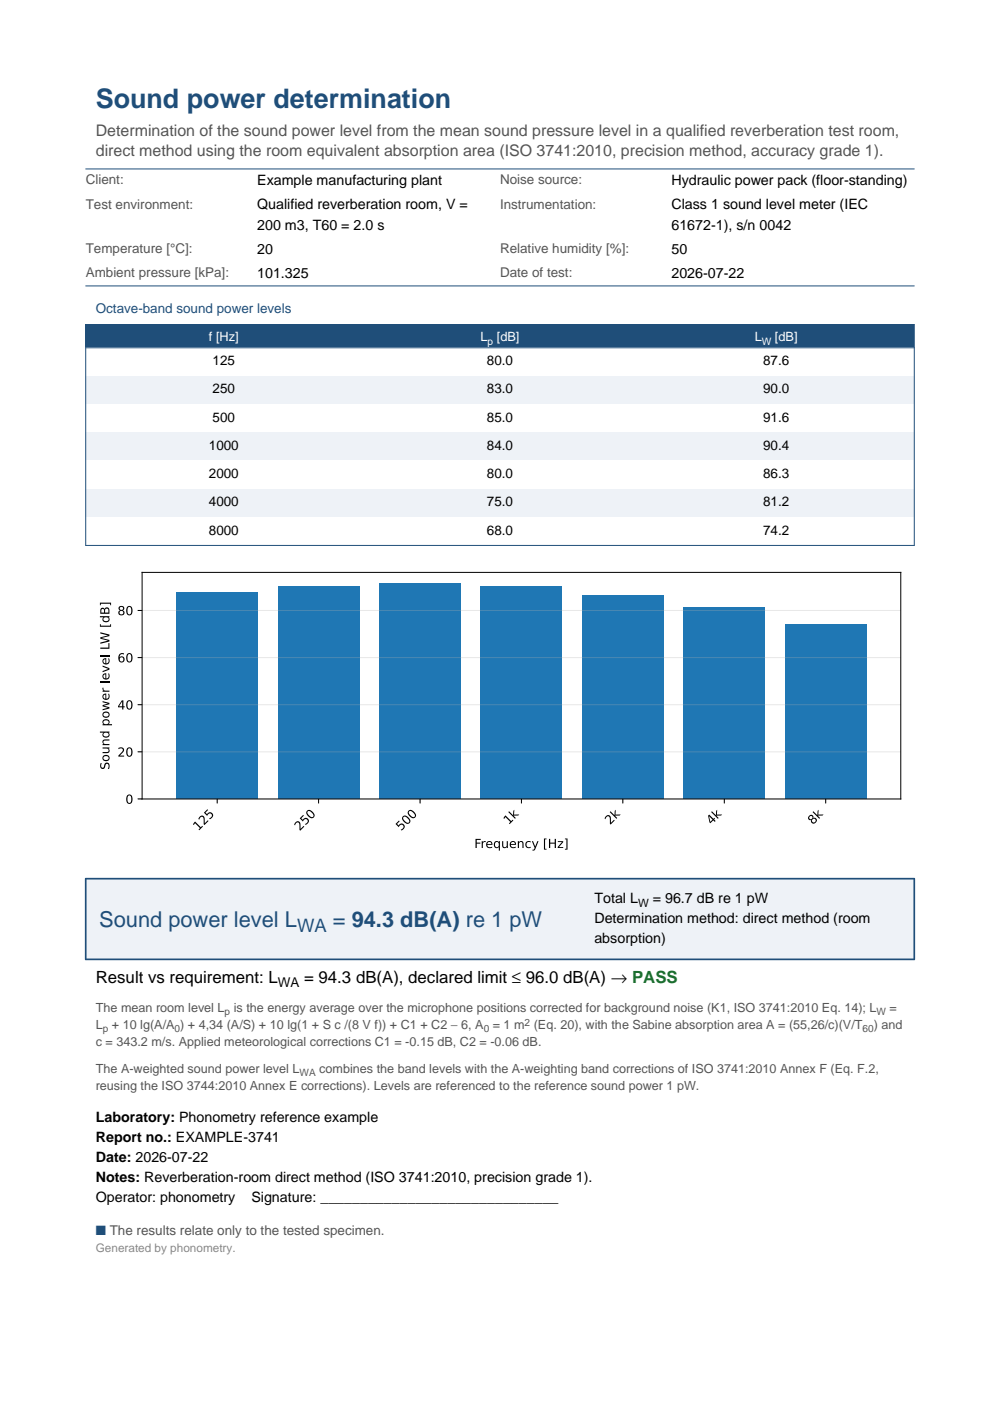
One-page ISO 3741 reverberation-room sound-power determination fiche: a header with the client, the noise source, the qualified reverberation test room and the instrumentation and climate, the octave-band table (125 Hz to 8 kHz) of mean room sound-pressure levels Lp and band sound-power levels LW, the sound-power spectrum LW(f) with a nominal band axis, the boxed A-weighted sound power level LWA = 94.3 dB(A) re 1 pW with the total LW = 96.7 dB and the direct determination method, and a PASS verdict against the declared 96 dB(A) limit, closed by a basis strip stating the Eq. 20 correction model with the Sabine absorption area, the Waterhouse boundary term and the meteorological corrections C1 and C2, and the Annex F A-weighting.
4. Sound energy level of a single event (clause 9.2)
Section titled “4. Sound energy level of a single event (clause 9.2)”Both methods above energy-average the room level and report a rate of energy flow, so a machine that fires once and falls silent has no to determine. Clause 9.2 gives it the sound energy level , pJ (clause 3.18), and determines it by the same two routes with the single event time-integrated sound pressure level (clause 3.4) in place of the time-averaged : Eq. 30 is Eq. 20 with where stood, and Eq. 31 is Eq. 21 likewise,
The measurement is clause 8.5: at least five events at each of the six
positions, either one at a time or as one reading encompassing them all, through
an interval that contains every significant part of the event including its
decay, and no moving microphone for a non-repetitive impulse. Clause 9.2.1
reduces both readings to the level of one event at each position (Eq. 22, the
energy mean of single readings, or Eq. 23, one reading less
; mean_single_event_level on the
pressure-methods page
is the same pair). Clause 9.2.2 corrects each position for its own background
by the frequency-dependent criterion of 9.1.2 (Eq. 25/26), and clause 9.2.3
energy-averages the corrected positions (Eq. 27). The background is the
time-averaged level measured over the same integration time as the events,
and it is compared as its exposure over that window,
, so that the energies Eq. 25 subtracts
share one reference; integration_time is therefore required with
background_levels. The reasons are spelled out on the pressure-methods page
and in the errata registry.
sound_energy_reverberation and sound_energy_comparison take levels in the
forms the sound power functions take, plus one: a 3D (Ne, NM, NB) array of the
events measured one at a time, or a 1D/2D reading with events=Ne for one
measurement of several. The room of section 1 and the reference source of
section 2 serve for both:
import numpy as npfrom phonometry import emission
# Five door slams recorded at the six positions of the room of section 1, one at# a time: (events, positions, bands), the 21 one-third octaves 100 Hz - 10 kHz.thirds = np.array([100, 125, 160, 200, 250, 315, 400, 500, 630, 800, 1000, 1250,                   1600, 2000, 2500, 3150, 4000, 5000, 6300, 8000, 10000], dtype=float)t60_thirds = np.full(thirds.size, 2.0)slam = np.linspace(88.0, 76.0, thirds.size)      # single event level, dB re E0rng = np.random.default_rng(3741)slams = slam + rng.normal(0.0, 0.6, size=(5, 6, thirds.size))
slam_lj = emission.sound_energy_reverberation(    slams, t60_thirds, volume=200.0, surface_area=220.0, frequencies=thirds,    background_levels=np.full(thirds.size, 45.0),   # time-averaged over the same 4 s    integration_time=4.0, temperature_c=20.0, static_pressure_kpa=101.0,)print(slam_lj.events, slam_lj.method)                    # 5 directprint(np.round(slam_lj.sound_energy_level[:3], 1))       # [96.  94.9 94.2] dB re 1 pJprint(round(slam_lj.sound_energy_level_a, 1))            # LJA = 99.0 dB(A)
# Comparison method: the reference source of section 2, run steadily.slam_cmp = emission.sound_energy_comparison(    slams, lp_rss, lw_rss, frequencies=thirds, temperature_c=20.0,)print(round(float(slam_cmp.sound_energy_level[0]), 1), slam_cmp.method)   # 95.0 comparison
slam_lj.plot()   # LJ per one-third octave, LJA in the title (needs matplotlib)
The identity with the steady chain is exact here too: the mean room level of section 1 read as a 10 s window, at every position, gives dB in every band through the same absorption area, Waterhouse term and /, which is why Eq. 30 states under the reference meteorological conditions exactly as Eq. 20 states :
lp_thirds = np.linspace(80.0, 70.0, thirds.size) # the mean room SPL of section 1steady = emission.sound_power_reverberation( lp_thirds, t60_thirds, volume=200.0, surface_area=220.0, frequencies=thirds, temperature_c=20.0, static_pressure_kpa=101.0,)ten_seconds = emission.sound_energy_reverberation( lp_thirds + 10.0, t60_thirds, volume=200.0, surface_area=220.0, frequencies=thirds, temperature_c=20.0, static_pressure_kpa=101.0,)print(np.round(ten_seconds.sound_energy_level - steady.sound_power_level, 6)[:3]) # 10.0Octave bands and the A-weighted total (Annex F)
Section titled “Octave bands and the A-weighted total (Annex F)”Both methods are defined on one-third-octave bands, and Annex F forms the
octave-band and A-weighted levels afterwards, for sound power (Eq. F.1, F.2) and
sound energy (Eq. F.4, F.5) alike. The A-weighted total is the
sound_energy_level_a of every result above; the octave bands are the energy
sum of the three thirds to that Table F.1 assigns to octave
, numbered from at 50 Hz, which octave_band_levels applies to any
band spectrum whose thirds come in complete triplets:
octaves, lj_octave = emission.octave_band_levels(slam_lj.sound_energy_level, thirds)print(octaves) # [ 125. 250. 500. 1000. 2000. 4000. 8000.]print(np.round(lj_octave, 1)) # 99.8 dB down to 87.7 dB, three thirds summed per octavesound_energy_reverberation() and sound_energy_comparison() parameters
Section titled “sound_energy_reverberation() and sound_energy_comparison() parameters”| Parameter | Type | Units | Range / default | Notes |
|---|---|---|---|---|
levels | 1D, 2D or 3D array | dB | per band, (NM, NB) or (Ne, NM, NB) | Single event levels: per event on the first axis (Eq. 22), one reading of events events (Eq. 23), or the mean of one event |
t60, volume, surface_area, frequencies | as in section 1 | Direct method only. frequencies is required there; the comparison method takes it only when background_levels is given, since the correction is per band | ||
levels_ref, lw_ref, background_levels_ref | as in section 2 | Comparison method only; the reference source is steady and keeps the 9.1.2 correction | ||
events | int or None | >= 1, default None | encompassed by one reading (Eq. 23); at least 5 without a warning | |
background_levels | 1D or 2D array | dB | matches levels | Time-averaged background over the same window; per-position (Eq. 25/26) |
integration_time | float | s | > 0, required with background_levels | The window ; the background is compared as |
temperature_c, static_pressure_kpa | float | °C, kPa | defaults 23.0, 101.325 | Set , , as in section 1 |
Both return a ReverberationSoundEnergyResult (sound_energy_level,
mean_event_level, absorption_area, waterhouse_correction,
background_correction, c1, c2, speed_of_sound, sound_energy_level_a,
method, events, integration_time), with the same NaN fields for the
comparison method as its sound power twin, and the same qualification
warnings.
What this guide covers
Section titled “What this guide covers”Covered
The ISO 3741 reverberation-room determination (
sound_power_reverberation): the direct method (Eq. 20) through the Sabine absorption area, the Waterhouse boundary correction and the / meteorological corrections, and the comparison method against a reference sound source (sound_power_comparison, Eq. 21), both with per-band background correction and the Annex F A-weighted total, rendered as the accredited-style sound-power fiche through.report(). The sound energy level of a single event by the same two methods (sound_energy_reverberation, Eq. 30;sound_energy_comparison, Eq. 31): the events reduced to one (Eq. 22/23), the per-position of Eq. 25 with the background compared over the same window, the Eq. 27 mean, and the Annex F octave-band (octave_band_levels, Eq. F.1/F.4) and A-weighted (Eq. F.2/F.5) levels.Not covered
The single event results carry no
.report()fiche, and the averaging over several source positions of Eq. 24 (and Eq. 13 for ) is left to the caller, who supplies levels already averaged over the positions of clause 8.4.2.4. The reverberation-room qualification itself (Annex C/D, eigenfrequency counting or a reference-source comparison) is assumed, not performed; the library only warns on the coarse advisory criteria ISO 3741 states explicitly (the Table 1 minimum volume, the reverberation floor, fewer than 6 positions, an inter-position spread above 1.5 dB). Choosing among the seven routes, and the ISO 4871 declaration a result feeds, live in Sound Power.
References
Section titled “References”- Beranek, L. L., & Mellow, T. J. (2012). Acoustics: Sound fields and transducers. Academic Press. https://doi.org/10.1016/C2011-0-05897-0ISBN 978-0-12-391421-7. Radiation and sound fields: the diffuse-field relation between pressure and power that the reverberation-room method rests on.
- International Organization for Standardization. (2010). Acoustics — Determination of sound power levels and sound energy levels of noise sources using sound pressure — Precision methods for reverberation test rooms (ISO 3741:2010). The direct (Eq. 20) and comparison (Eq. 21) methods of this guide, with the Waterhouse and meteorological corrections and the Table 1 qualification criteria.