Some machines are loudest where the general methods stop listening. The paper noise of a fast printer, the whine of a switched-mode power supply and the line tone of a display all sit above 10 kHz, and ISO 3741 and ISO 3744 both end at the 10 kHz one-third-octave band. ISO 9295 adds the octave band centred on 16 kHz, from 11.2 kHz to 22.4 kHz, and determines the unweighted sound power level in its three one-third-octave bands (12.5, 16 and 20 kHz) or in the narrow bands of its discrete tones. At those frequencies the air itself is the main absorber of a reverberation room, and that is what shapes the method: this guide covers the room constant from the measured reverberation time or from the calculated air absorption, the direct level, the comparison with a reference sound source for broadband noise and for tones, the free-field alternative, what Table 3 asks a report to determine for each type of noise, and the misprints of the tables the standard prints for the air absorption. Which route fits which job below 10 kHz is weighed in Sound Power.
1. The 16 kHz octave band (ISO 9295)
Section titled “1. The 16 kHz octave band (ISO 9295)”The standard specifies four methods (clause 1). Three use the reverberation test room of ISO 3741: the measured reverberation time (clause 6), the calculated air absorption (clause 7) and a reference sound source (clause 8). The fourth is the free field over a reflecting plane of ISO 3744 (clause 9). In the room the microphone rides a rotating boom that describes a circle at least 2 m across, mounted pointing upwards with the normal to its diaphragm parallel to the axis of rotation, so that the sound of the equipment reaches it at grazing incidence (clause 5.4): that orientation is what reduces the direct field enough for the method to treat the reading as reverberant, although clause 6.1 notes that some of it can remain in the 16 kHz octave. The equipment stands on the floor at least 1 m from any wall and 1.8 m from the nearest microphone position, and is measured in four orientations, turned 90° at a time, or on a turntable (clause 5.5).
The level of each band is the energy mean of the four orientations () or of three revolutions of the boom (), Formula (1):
Every determination function below takes the levels either already averaged,
one value per band, or as an (N, bands) array that it averages by
Formula (1). The chain has to be flat to ±1.0 dB from 11.2 kHz to 22.4 kHz after
correction, which in practice asks for a microphone of 13.2 mm diameter or
less (clause 5.3), and the room conditions are part of the result: clause 5.2
recommends 15 °C to 30 °C and 40 % to 70 % relative humidity and asks that
the product stay within ±10 % during
the measurement, because the air absorption changes the room constant band
by band.
How the measurement goes
Section titled “How the measurement goes”Qualify the room for ISO 3741 and fit the boom: a circle of 2 m or more,
the microphone at the end pointing upwards, a rotation period at least as
long as ISO 3741 asks, and a longer one if the drive is noisy or a tone is
being read. Place the equipment on the floor, 1 m from every wall and 1.8 m
from the path, in its first orientation, and calibrate the whole chain,
checking its response across the 16 kHz octave at least every two years.
Record the temperature, the relative humidity and the static pressure. For
each of the four orientations read the time-averaged level over whole
revolutions, in one-third-octave bands for broadband noise and in narrow bands
wherever there is a tone, and read the background with the equipment off.
Then either measure the reverberation time at three or four points of the
path (clause 6), or take the room constant from the air absorption
(clause 7), or measure a calibrated reference source at the same place with
the same bandwidth (clause 8). The report states the method, the noise type
of Table 3, the band levels at the reference meteorological conditions and
the frequency of every tone within 10 dB of the highest (clause 13).
Clause 5.7 leaves the background correction to ISO 3741, so the band levels
are corrected before they reach the functions below:
reverberation_background_correction gives the of ISO 3741 for any
band, and above 6.3 kHz it applies the 6 dB criterion that covers the whole
16 kHz octave.
2. The room constant
Section titled “2. The room constant”A reverberation room turns the mean square pressure into sound power through its absorption. Above 10 kHz that absorption is large enough that the Sabine approximation no longer holds, so the standard writes the room constant in both of its methods with the absorption coefficient of the room, , and not with the Sabine area. The method of clause 6 takes from the measured reverberation time through the Eyring relation, Formulae (4) and (5), with the total surface of the room and its volume:
The method of clause 7 skips the measurement. At 10 kHz and above practically all of the absorption of the room is in the air, whose amplitude attenuation coefficient in nepers per metre gives an absorption area of , and so Formula (7):
comes from the normative Annex A, which is ISO 9613-1 written in
nepers per metre and evaluated up to 22.4 kHz, where ISO 9613-1 stops at
10 kHz; the conversion to decibels per metre is the factor 8.686.
air_absorption_np_per_m evaluates it with the library’s own ISO 9613-1
implementation, without the advisory that implementation raises above 10 kHz.
import numpy as npfrom phonometry import emission
thirds = np.array([12500.0, 16000.0, 20000.0])# A 200 m3 reverberation room with 210 m2 of surface, at 23 degC and 50 %.alpha = emission.air_absorption_np_per_m(    thirds, temperature_c=23.0, relative_humidity_percent=50.0)print(alpha.round(4))            # [0.0245 0.0383 0.0564] Np/mroom_air = emission.room_constant_from_air_absorption(    thirds, volume_m3=200.0, surface_area_m2=210.0,    temperature_c=23.0, relative_humidity_percent=50.0)print(room_air.round(1))         # [ 48.3  86.6 158.4] m2
# The same room, from the reverberation times measured on the boom path.times = [0.70, 0.42, 0.26]       # s, at 12.5, 16 and 20 kHzprint(emission.room_absorption_coefficient(    times, volume_m3=200.0, surface_area_m2=210.0).round(3))   # [0.196 0.304 0.443]room_t = emission.room_constant_from_reverberation_time(    times, volume_m3=200.0, surface_area_m2=210.0)print(room_t.round(1))           # [ 51.1  91.8 167.4] m2
The two constants differ by what the walls absorb on top of the air, 0.25 dB
in the level they give. The air term moves much more with the weather: the
same room at 20 °C and 40 % has a room constant 1.6 dB larger at 12.5 kHz and
1.5 dB larger at 16 kHz, which is why clause 5.2 holds the product of humidity and temperature
steady during a measurement. room_constant_from_air_absorption warns below
10 kHz, where its premise no longer holds, and refuses a room where
reaches 1, where the air alone would absorb more than the room
surface can.
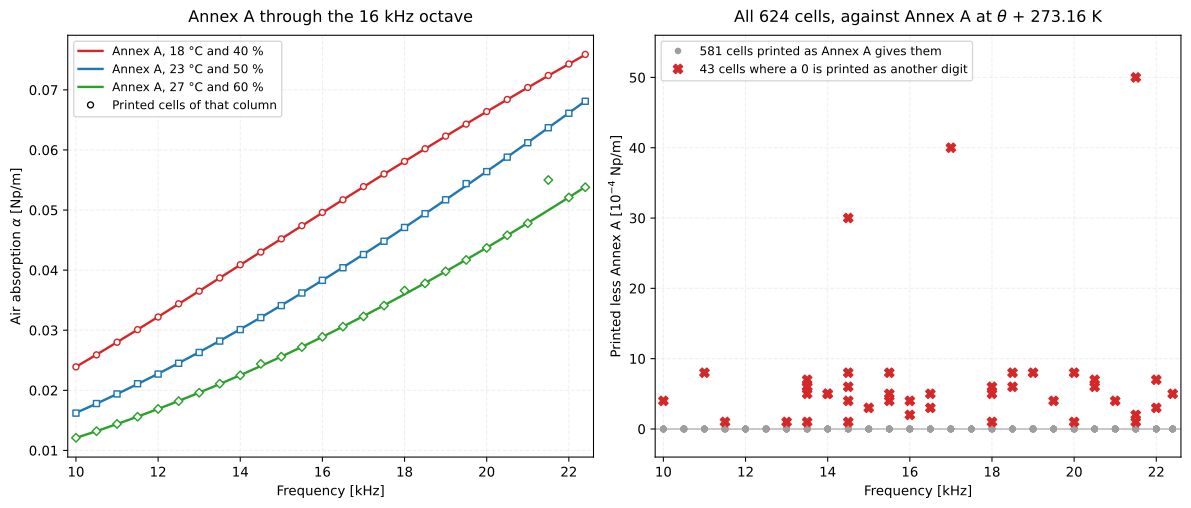
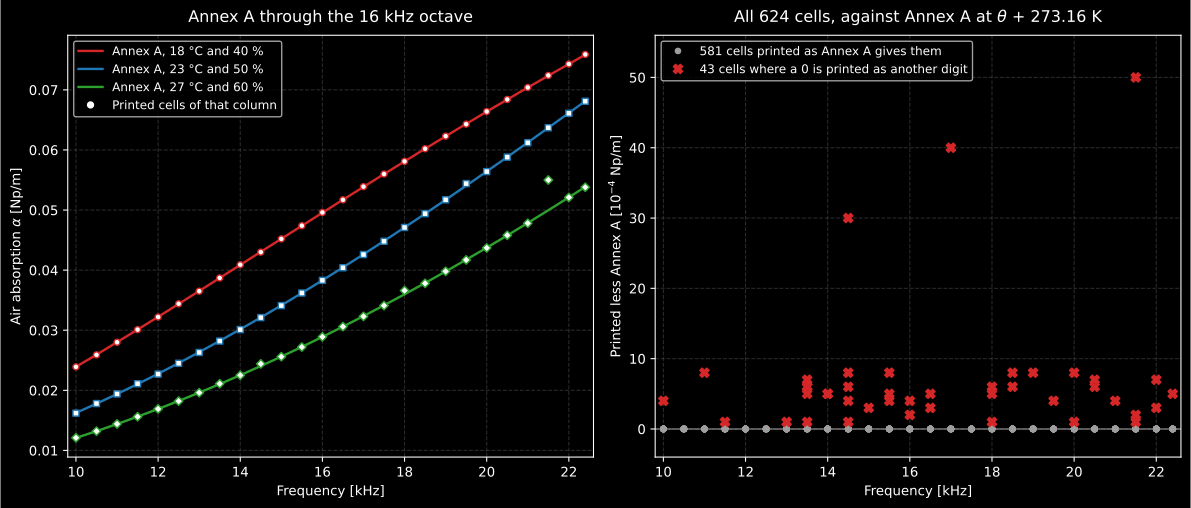
Annex A against the page. The tables print for 18 °C to 27 °C, 40 % to 60 % and 10 000 Hz to 22 400 Hz, 624 cells to four decimals. The curves on the left are the library’s Annex A, with the temperature converted as K; the right panel measures each cell against Annex A converted as the tables were computed, K, and there 581 of them are Annex A to the last digit. The other 43 are the misprints of the next paragraph: in every one of them a 0 of Annex A is printed as another digit.
Show the code for this figure
import matplotlib.pyplot as pltimport numpy as npfrom phonometry import emission
grid = np.linspace(10_000.0, 22_400.0, 250)fig, ax = plt.subplots(figsize=(7, 5))for t, rh in ((18.0, 40.0), (23.0, 50.0), (27.0, 60.0)):    alpha = emission.air_absorption_np_per_m(        grid, temperature_c=t, relative_humidity_percent=rh)    ax.plot(grid / 1000.0, alpha, label=f"Annex A, {t:g} degC and {rh:g} %")ax.set_xlabel("Frequency [kHz]")ax.set_ylabel("Air absorption alpha [Np/m]")ax.legend()plt.show()
Do not read from Tables 1 and 2. Forty-three of their cells are misprinted, and in the same way: a 0 that Annex A gives is printed as another digit, most often the fourth decimal as the third repeated (“0,027 7” where Annex A gives 0,027 0). Three cells whose Annex A value ends in two zeros are printed 10 % high: “0,033 0” for 0,030 0, “0,04 4” for 0,040 0 and “0,05 50” for 0,050 0. The last of them, at 21 500 Hz, 27 °C and 60 %, is the largest error in the tables, 0,005 0 Np/m, and read into Formula (7) any of the three raises the level by at least 0.41 dB. The whole list, cell by cell, is in the errata registry. The 581 correct cells hold a smaller surprise: they reproduce digit for digit only with the temperature converted as K, the triple point of water, where the Celsius scale puts 273.15 K. The library converts with 273.15 K, which moves 61 of them by one unit of the fourth decimal and none by more than 0.000 063 Np/m.
The room-constant functions
Section titled “The room-constant functions”| Function | Formula | Returns | Notes |
|---|---|---|---|
air_absorption_np_per_m(frequencies_hz, *, temperature_c, relative_humidity_percent, static_pressure_kpa=101.325) | Annex A | [Np/m] | ISO 9613-1 without the 8.686; advisory outside 50 Hz to 22.4 kHz and outside −20 °C to +50 °C |
room_absorption_coefficient(reverberation_time_s, *, volume_m3, surface_area_m2) | (5) | The 0.16 the formula prints | |
room_constant_from_reverberation_time(reverberation_time_s, *, volume_m3, surface_area_m2) | (4), (5) | [m²] | Clause 6 |
room_constant_from_air_absorption(frequencies_hz, *, volume_m3, surface_area_m2, temperature_c, relative_humidity_percent, static_pressure_kpa=101.325) | (7) | [m²] | Clause 7; warns below 10 kHz, refuses |
3. A printer in a reverberation room
Section titled “3. A printer in a reverberation room”With the room constant in hand the level of each band is Formula (6):
Clause 10.1 then carries it to the reference meteorological conditions,
101.325 kPa and 23.0 °C, “de acuerdo con la Norma ISO 3741”: the
reference-quantity correction and the radiation-impedance correction
of ISO 3741 clause 9.1.4, exactly as ISO 3741 adds them to its own
direct method. high_frequency_sound_power does both, from the room constant
of either method. The example is a printer measured in the four orientations
in the room above.
orientations = np.array([        # dB re 20 uPa, one row per orientation    [58.3, 56.1, 51.2],    [59.0, 56.8, 52.0],    [57.6, 55.7, 50.9],    [58.8, 56.5, 51.6],])printer = emission.high_frequency_sound_power(    orientations, frequencies_hz=thirds, room_constant_m2=room_air,    temperature_c=23.0, static_pressure_kpa=101.325)print(printer.mean_pressure_level.round(2))   # [58.46 56.29 51.44] dB, Formula (1)print(printer.sound_power_level.round(1))     # [69.1 69.5 67.3] dB re 1 pWprint(round(printer.c1, 3), round(printer.c2, 4))   # -0.127 0.0033
printer.plot()   # LW per band with the mean room level (needs matplotlib)
At 23 °C and 101.325 kPa is next to nothing, but is not: it is the that refers the characteristic impedance of the air to the one the dB of the diffuse-field relation assumes, and it takes 0.13 dB off every band. Measured through the reverberation time instead, the same readings give 69.4, 69.8 and 67.5 dB.
high_frequency_sound_power() parameters
Section titled “high_frequency_sound_power() parameters”| Parameter | Type | Units | Range / default | Notes |
|---|---|---|---|---|
pressure_levels_db | 1D or 2D array | dB | (bands,) or (N, bands) | , or the orientations or revolutions averaged by Formula (1) |
frequencies_hz | 1D array | Hz | one per band | A frequency outside 11.2 kHz to 22.4 kHz emits a SoundPowerWarning |
room_constant_m2 | float or 1D array | m² | positive | From either room-constant function |
temperature_c | float | °C | default 23.0 | For and (clause 10.1) |
static_pressure_kpa | float | kPa | default 101.325 | For and |
tonal | bool | default False | The bands are the narrow bands of tones |
The result, a HighFrequencySoundPowerResult, carries the band levels
(sound_power_level), the mean room level (mean_pressure_level), the room
constant, the two corrections (c1, c2) and the method, and
within_10_db_of_maximum marks the bands within 10 dB of the highest.
4. Tones against a reference source
Section titled “4. Tones against a reference source”The method of clause 8 needs no room constant. A reference sound source calibrated to ISO 6926 is measured at the place of the equipment with the same bandwidth, and the room cancels between the two, Formula (8):
For discrete tones the analysis is narrow-band, and a moving microphone complicates it: its motion spreads a tone over sidebands by the Doppler shift, over a width that Formula (2) gives from the speed of the microphone and the speed of sound ,
An analyser at least that wide holds the whole tone in one band; a narrower FFT does not, and the sidebands that carry the tone are summed on an energy basis, Formula (3). The reference source for tones is calibrated as a power spectral density, per hertz, so Formula (9) adds the noise bandwidth of the analyser, at most 112 Hz for an FFT and taken as 1 Hz for a constant-percentage analyser:
The example is a power supply with a tone at 15 625 Hz and two more at 17 000 Hz and 20 500 Hz, read with a 12.5 Hz FFT on a boom of 1 m radius turning once every 32 s.
speed = 2.0 * np.pi * 1.0 / 32.0                     # m/s along the pathprint(emission.minimum_analyzer_bandwidth_hz(    15625.0, microphone_speed_m_s=speed, speed_of_sound=345.5).round(1))   # [17.8] Hz# The FFT is narrower than that, so the tone is the sum of its sidebands.tone = emission.tone_level_from_sidebands([42.9, 41.3, 38.0])print(round(tone, 1))                                # 45.9 dB
tones = emission.high_frequency_sound_power_comparison(    [tone, 38.5, 31.0], frequencies_hz=[15625.0, 17000.0, 20500.0],    reference_pressure_levels_db=[41.8, 41.2, 40.1],    reference_sound_power_levels_db=[44.3, 43.9, 43.0],   # dB re 1 pW per hertz    noise_bandwidth_hz=12.5)print(tones.sound_power_level.round(1))              # [59.4 52.2 44.9] dB re 1 pWprint(tones.within_10_db_of_maximum)                 # [ True  True False]
Clause 13 c) asks for the level and the frequency of every tone within 10 dB of
the highest, and within_10_db_of_maximum marks them: here the first two.
A bandwidth wider than 112 Hz emits a SoundPowerWarning, and without
noise_bandwidth_hz the same function applies Formula (8) to broadband bands.
The comparison applies alone, as ISO 3741 does for its own comparison
method.
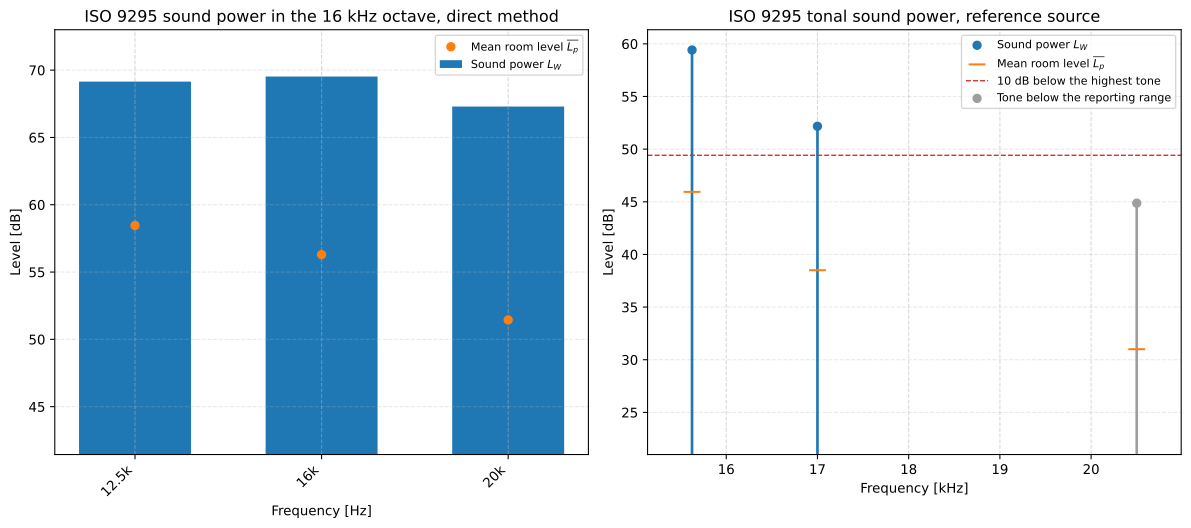
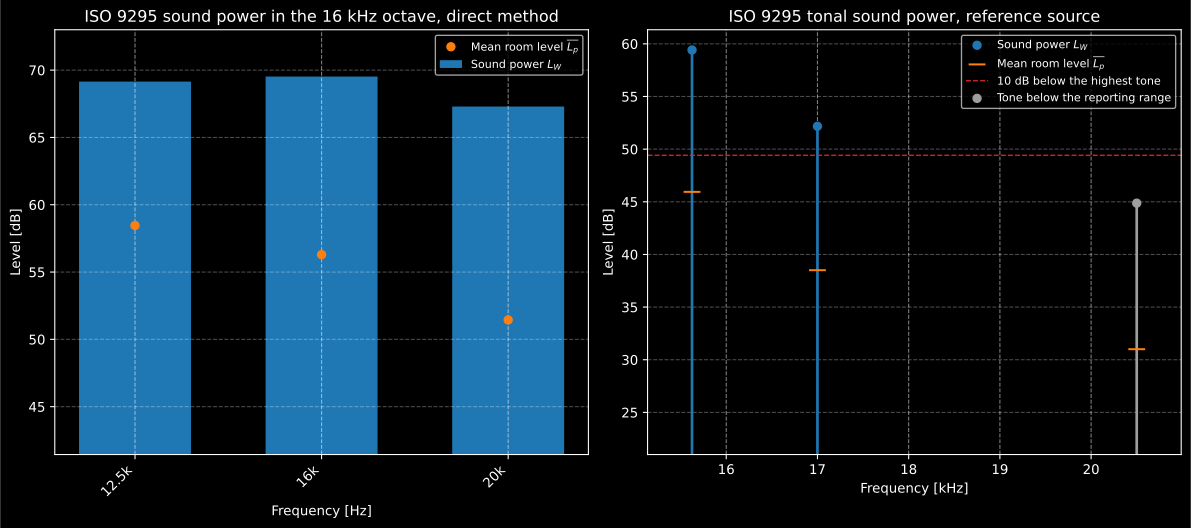
On the left, the printer of section 3: the gap between each bar and its dot is the room term of Formula (6), , which grows from 10.8 dB at 12.5 kHz to 16.0 dB at 20 kHz because the air absorbs more at the top of the octave and the room constant grows with it, less the 0.12 dB that take off. On the right, the tones above: the one at 20.5 kHz lies more than 10 dB below the highest and falls outside what clause 13 c) asks to be reported.
Show the code for this figure
import matplotlib.pyplot as plt
# printer and tones are the results computed in this guide.fig, (left, right) = plt.subplots(1, 2, figsize=(12.5, 5.6))printer.plot(ax=left)tones.plot(ax=right)plt.show()
5. The free field over a reflecting plane
Section titled “5. The free field over a reflecting plane”The fourth method is ISO 3744 in a hemi-anechoic room, with the three
one-third-octave bands of the 16 kHz octave, and
sound_power_pressure
takes it as it stands (without frequencies, since the A-weighting table of
ISO 3744 stops at 10 kHz). What ISO 9295 adds is Formula (10): beyond a
measurement radius of 2 m the air absorbs enough over the path that the
surface level takes the correction , with in
decibels per metre (clause 9.8). The surface level and the sound power level
differ by a constant, so adding to the band levels is the same
thing.
levels = np.array([[50.0, 48.0, 44.0]] * 10) + np.linspace(-1.0, 1.0, 10)[:, None]hemisphere = emission.sound_power_pressure(levels, "hemisphere", radius=2.5)k = emission.free_field_absorption_correction( thirds, radius_m=2.5, temperature_c=23.0, relative_humidity_percent=50.0)print(k.round(2)) # [0.53 0.83 1.23] dBprint((hemisphere.sound_power_level + k).round(1)) # [66.5 64.8 61.2] dBAt 2 m or less the clause asks for no correction and the function returns zero.
6. What to determine for each type of noise
Section titled “6. What to determine for each type of noise”Table 3 of the standard decides what a determination gives, from the noise
the equipment makes in the octave bands from 125 Hz to 8 kHz and in the
16 kHz octave. With broadband or narrow-band noise below 8 kHz, the
A-weighted sound power level of ISO 3741 or ISO 3744 is always part of it,
and the 16 kHz octave adds its one-third-octave band levels for broadband
noise, the level and the frequency of a discrete tone, or the levels and the
frequencies of every tone within 10 dB of the highest. With no significant
noise below 8 kHz, footnote b notes that the noise lies outside the scope of
ISO 3741 and ISO 3744, so only this standard applies and only the tone or the
tones of the 16 kHz octave are asked for.
high_frequency_levels_to_determine reads the table: a power supply like the
one of section 4, with three tones above 8 kHz and a fan that fills the bands
below with broadband noise, falls on the multiple-tone row.
print(emission.high_frequency_levels_to_determine( noise_125_hz_to_8_khz="broadband", noise_16_khz_octave="multiple_tones"))# ('a_weighted_sound_power_level', 'tone_levels_within_10_db')print(emission.high_frequency_levels_to_determine( noise_125_hz_to_8_khz="none", noise_16_khz_octave="discrete_tone"))# ('tone_level_and_frequency',)The table has no row for equipment with no significant noise anywhere, or with
broadband noise in the 16 kHz octave and none below it, and the function
refuses those two combinations with a ValueError rather than guess what the
standard would ask.
What this guide covers
Section titled “What this guide covers”Covered
The ISO 9295:2015 determination of the sound power level in the 16 kHz octave band: the energy mean over orientations or revolutions (Formula (1)), the analyser bandwidth under a moving microphone and the sideband sum (Formulae (2) and (3)), the room constant from the measured reverberation time through the Eyring relation (Formulae (4) and (5)) or from the air absorption of Annex A (Formula (7),
air_absorption_np_per_m, pinned to the 581 correctly printed cells of Tables 1 and 2), the direct level of Formula (6), the comparison with a reference sound source for broadband noise and for tones (Formulae (8) and (9)), the free-field correction of Formula (10), the reference meteorological conditions of clause 10.1 through the and of ISO 3741, the 10 dB reporting range of clause 13 c), and the levels Table 3 asks to determine for each type of noise (high_frequency_levels_to_determine).Not covered
The room, the boom and the instruments are assumed qualified: the ISO 3741 qualification of the room, the flatness of the chain and the ISO 6926 calibration of the reference source are checks the laboratory makes, and the % stability of is not monitored. The background correction is ISO 3741’s, applied to the levels before they are passed (
reverberation_background_correction). The free-field method is ISO 3744 as the library implements it, plus Formula (10). The uncertainty of clause 11 is a statement, , with standard deviations of reproducibility of 3 dB or less in the 16 kHz octave.
References
Section titled “References”- International Organization for Standardization. (1993). Acoustics — Attenuation of sound during propagation outdoors — Part 1: Calculation of the absorption of sound by the atmosphere (ISO 9613-1:1993). The pure-tone attenuation coefficient that Annex A of ISO 9295 writes in nepers per metre and extends to 22.4 kHz.
- International Organization for Standardization. (2010). Acoustics — Determination of sound power levels and sound energy levels of noise sources using sound pressure — Precision methods for reverberation test rooms (ISO 3741:2010). The reverberation-room technique ISO 9295 builds on, and the corrections C1 and C2 of clause 9.1.4 that its clause 10.1 applies for the reference meteorological conditions.
- International Organization for Standardization. (2015). Acoustics — Determination of high-frequency sound power levels emitted by machinery and equipment (ISO 9295:2015). Read in its Spanish adoption, UNE-EN ISO 9295:2015. Formulae (1) to (10), Tables 1 and 2, Table 3 and the normative Annex A that this guide implements.