The sound power level says how much noise a machine makes. It is the right number for comparing machines and for feeding a room prediction, and it is the wrong number for the person standing at the machine. What that person is exposed to is the emission sound pressure level: the level at the work station, with the background noise taken out and the room’s reflections taken out, so that what is left belongs to the machine.
It is the number a datasheet prints. The noise-emission declaration of ISO 4871 carries beside , and the EU Machinery Directive requires it whenever it exceeds 70 dB(A). Five standards determine it, and they differ in exactly one thing: how they get rid of the room.
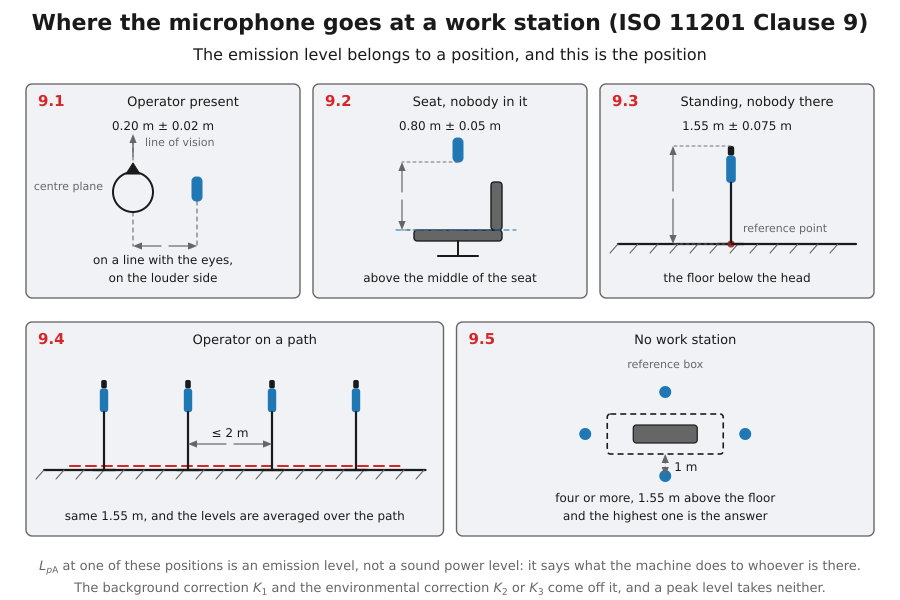
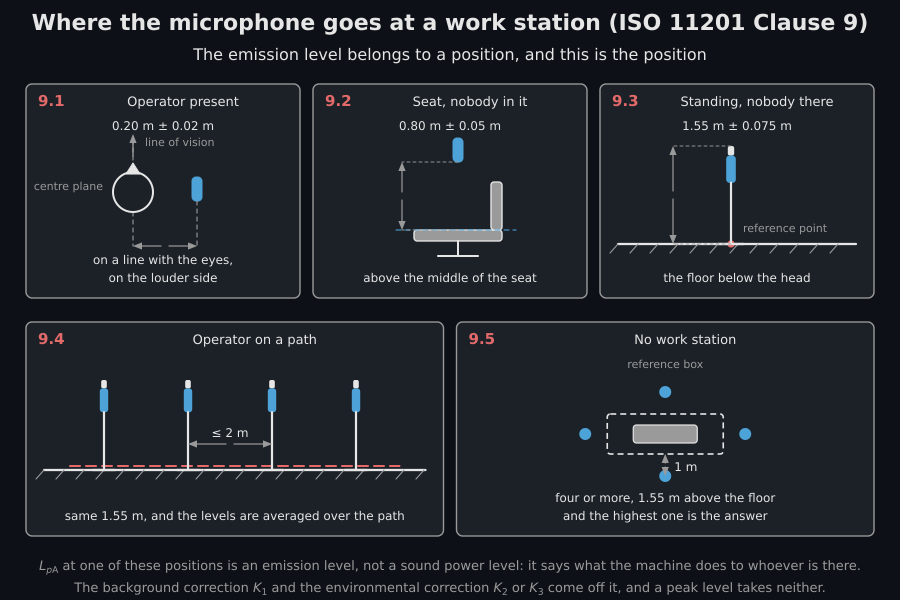
The clause is short and those five cases are all of it: what changes is where the microphone stands, never what is taken off what it reads.
1. One law, printed three times
Section titled “1. One law, printed three times”Every measuring part of the group prints the same subtraction:
is what the meter read. removes the background noise, removes the reflections the room sent back, and the difference is the machine. ISO 11201 prints it without the term, not because the term is absent but because its environment is qualified so that the term is negligible: an essentially free field over a reflecting plane has nothing to send back.
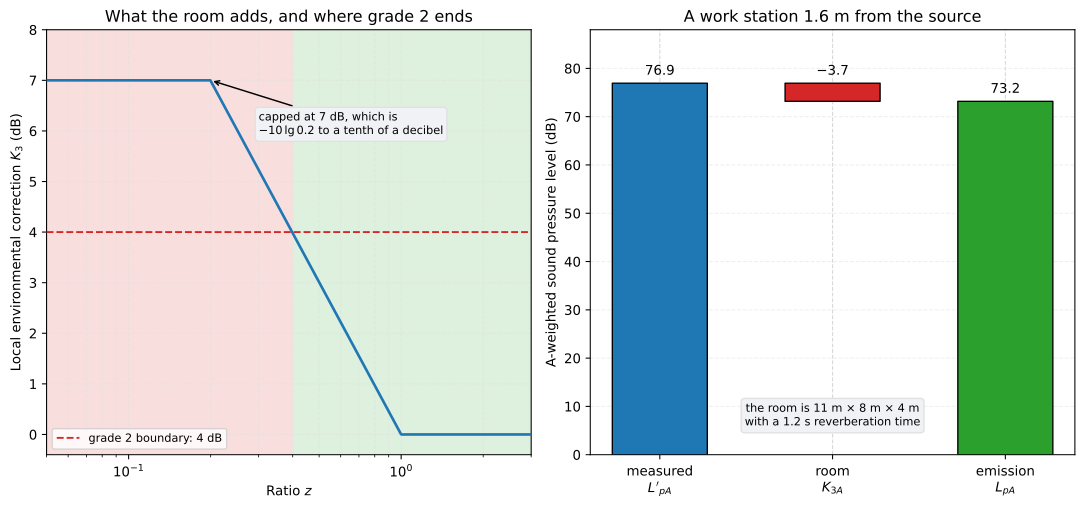
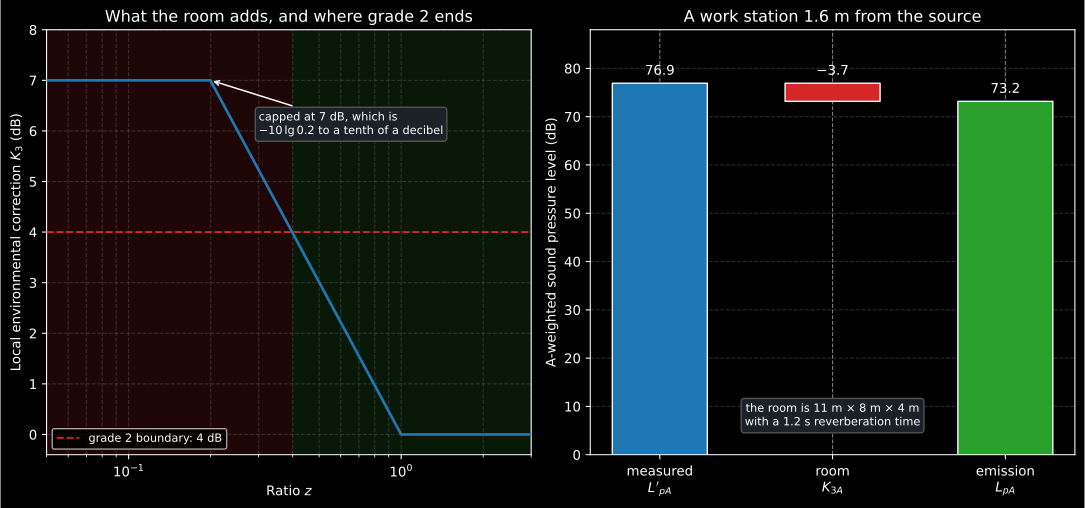
The room correction is capped at 7 dB and vanishes above a ratio of one; where it exceeds 4 dB the determination drops from grade 2 to grade 3.
One rule is absolute and easy to get wrong: a peak level takes no correction at all. ISO 11202 clause 8 and ISO 11204 clause 7 both say so. is reported exactly as measured, because both corrections are derived from mean-square pressures and neither has a meaning for a single largest excursion.
2. The background, and where a determination stops being one
Section titled “2. The background, and where a determination stops being one”The background correction is the same closed form the sound-power side uses,
but this group puts its own thresholds around it. Past 15 dB of margin the background is negligible and is taken as zero. Below 6 dB (grade 2) or 3 dB (grade 3) the correction is held at its value there, and the level stops being a determination and becomes an upper bound. The library returns that fact rather than raising, because the reading is still worth reporting; what it may not do is go out unlabelled.
from phonometry import emission
k1, upper_bound = emission.background_noise_correction_at_workstation(79.0, 70.0)print(round(k1, 1), upper_bound)# 0.6 False
3. The room, and the one ratio it comes down to
Section titled “3. The room, and the one ratio it comes down to”Both ISO 11202 method A.2 and ISO 11204 print the same three lines, a function of one dimensionless ratio :
The 7 dB cap is not a separate rule bolted onto the curve: is 6.99 dB, so the cap is the curve’s own value rounded to the tenth of a decibel the standard prints its corrections to. The upper branch is a floor for the same reason a correction cannot be negative, since a room can only add to what the microphone hears.
Two roads reach , and they are the same road. ISO 11202 Equation (A.4) and ISO 11204 Equation (A.3) go through the environmental correction of the test room and the directivity the work station sees; ISO 11204 Equation (A.6) goes through the equivalent absorption area directly. ISO 11204 A.1.2 says the two rest on the same assumptions, and under the ISO 3744 definition they are identically equal:
import mathfrom phonometry import emission
absorption, surface = 47.0, 16.0          # m^2, the room and the surfacek2 = 10.0 * math.log10(1.0 + 4.0 * surface / absorption)
by_k2 = emission.environmental_ratio_from_k2(k2)by_area = emission.environmental_ratio_from_absorption(absorption, surface)print(round(by_k2, 9) == round(by_area, 9))# True
With no directivity to speak of the expression collapses to , so : a work station that sees the machine no more strongly than the measurement surface does needs the very correction the surface needed. Only up to the cap, though. At dB the ratio reaches 0.2 and the correction stops following: a room with dB still gets dB, because the cap is on and not on the room.
4. What decides the grade
Section titled “4. What decides the grade”Three gates decide it and the worst one wins. A class 2 sound level meter makes the result grade 3 whatever else is true. The background must clear 6 dB for grade 2 and 3 dB for grade 3. And the local environmental correction must not exceed 4 dB: ISO 11202 A.1.3 puts the boundary there directly, and method A.2 reaches the same 4 dB through its Condition (A.6), which is the same inequality once (A.4) and (A.5) are substituted into it.
from phonometry import emission
print(emission.grade_from_local_correction(3.7))print(emission.grade_from_local_correction(5.2))# engineering# survey
5. The worked example, end to end
Section titled “5. The worked example, end to end”ISO 11200:2014 Annex B prints four case studies with every intermediate value. This is the second: a machine with a clearly identifiable dominating source in an 11 m by 8 m by 4 m assembly workshop whose reverberation time is 1.2 s, with the work station 1.6 m from that source.
import math
import numpy as npfrom phonometry import emission
surface = 2.0 * math.pi * 1.6**2            # the hemisphere around the sourceabsorption = 0.16 * (11.0 * 8.0 * 4.0) / 1.2
ratio = emission.environmental_ratio_from_absorption(absorption, surface)k3 = emission.local_environmental_correction(ratio)
readings = np.array([77.5, 76.0, 77.2, 77.7, 75.9])measured = 10.0 * np.log10(np.mean(np.power(10.0, readings / 10.0)))level = emission.emission_sound_pressure_level(measured, local_correction_db=k3)
sigma = emission.total_standard_deviation(1.5, 1.0)print(round(k3, 1), round(float(measured), 1), round(float(level), 1))print(round(sigma, 1), round(emission.emission_expanded_uncertainty(sigma), 1))# 3.7 76.9 73.2# 1.8 2.9
Every one of those five numbers is printed in Table B.2, and six conformance rows hold the library to them.
6. A cycle of operating periods
Section titled “6. A cycle of operating periods”A machine that idles, cuts and returns spends a different length of time in each state, and the level of the whole cycle is the energy average weighted by duration rather than by count:
from phonometry import emission
print(round(emission.subinterval_level([80.0, 90.0], [10.0, 1.0]), 1))
Ten seconds at 80 dB carry the same energy as one second at 90, so the cycle lands at 82.6 dB. Counting the two states equally instead would give 87.4.
7. Where the standard argues with itself
Section titled “7. Where the standard argues with itself”The two case studies of Annex B compute the same standard deviation two different ways. Equation (C.1), printed identically in ISO 11201, ISO 11202 and ISO 11204, is the sample standard deviation with ; Table B.3 agrees with it and Table B.1 divides by instead. It is not cosmetic, because the value propagates: with the figure the equation gives, Table B.1’s own expanded uncertainty would be 2.5 dB rather than the 2.4 dB it prints. The library follows the equation and the errata register records the rest.
What this guide covers
Section titled “What this guide covers”Covered
The quantities the ISO 11200 group shares: the emission sound pressure level
L_p = L'_p - K_1 - K_3of ISO 11201 Equation (7), ISO 11202 Equation (10) and ISO 11204 Equation (9); the background correction with this group’s own negligible and minimum margins; the piecewise local environmental correction of ISO 11202 Equation (A.5) and ISO 11204 Equations (A.2) and (A.5), with both printed routes to the ratio it is a function of; the 4 dB grade boundary; the total standard deviation and expanded uncertainty; and the duration-weighted summation of a cycle of operating periods.Not covered yet
The per-part measurement procedures themselves: the microphone positions and environmental qualification of ISO 11201, the directivity survey of ISO 11202 method A.2, the accurate determination of
K_2in ISO 11204, the measure of sound propagationQof ISO 11203, and the intensity route of ISO 11205.
References
Section titled “References”- International Organization for Standardization. (1995). Acoustics — Noise emitted by machinery and equipment — Determination of emission sound pressure levels at a work station and at other specified positions from the sound power level (ISO 11203:1995). The route that measures no sound pressure at the work station: L_p = L_W - Q, with Q the only printed expression the document carries.
- International Organization for Standardization. (2010). Acoustics — Noise emitted by machinery and equipment — Determination of emission sound pressure levels at a work station and at other specified positions applying accurate environmental corrections (ISO 11204:2010). The accurate route: Equation (9), the piecewise K3 of Equations (A.2) and (A.5), and the second route to the ratio in Equation (A.6).
- International Organization for Standardization. (2010). Acoustics — Noise emitted by machinery and equipment — Determination of emission sound pressure levels at a work station and at other specified positions applying approximate environmental corrections (ISO 11202:2010). Methods A.1 and A.2: Equation (10), the K3 of Annex A and the 4 dB boundary of A.1.3.
- International Organization for Standardization. (2010). Acoustics — Noise emitted by machinery and equipment — Determination of emission sound pressure levels at a work station and at other specified positions in an essentially free field over a reflecting plane with negligible environmental corrections (ISO 11201:2010). The free-field method: Equation (7), the background correction of 5.4.2 and the uncertainty of clause 11.
- International Organization for Standardization. (2014). Acoustics — Noise emitted by machinery and equipment — Guidelines for the use of basic standards for the determination of emission sound pressure levels at a work station and at other specified positions (ISO 11200:2014). The selection guide for the whole group, and the four worked case studies of Annex B that every number on this page is checked against.