Some machines never travel to a test room: a compressor bolted to the floor of the plant, a press line, a packaging machine wired into the rest of the line. ISO 3747 determines their sound power where they stand, by comparison. A reference sound source (RSS) of calibrated band sound power is run in the same room as the machine, the same three or four microphones listen to each source in turn from the reverberant part of the room, and because both sources see the same room the room cancels: the sound power of the source under test is the calibrated power of the reference source carried across by the difference of the two mean levels. The method reaches engineering grade 2 where the field is reverberant enough and the source not too directional, and survey grade 3 otherwise; an impulsive source gets a sound energy level instead of a sound power level by the same route. This guide covers the per-position background correction with its 6 dB and 15 dB rules, the one- and several-location forms, the single-event path, the Table 2 grade, the clause 9 uncertainty and the Annex C reference conditions. Which route fits which job is weighed in Sound Power.
1. The comparison in situ (ISO 3747)
Section titled “1. The comparison in situ (ISO 3747)”The environment is the whole method, so the standard begins with it. The microphone positions must lie where the field is reverberant, which the standard measures as the excess of sound pressure level over the free field, dB (clause 4.1, Annex A): the level the reference source produces at a microphone must be at least 7 dB above what it would produce in a free field at that distance. Three or four positions are used, at least 2 m apart, none closer than 0,5 m to any boundary, distributed as evenly as possible round the machine, each of them either in sight of every sound-emitting area or screened from all of them (clause 7.4.1); the reference source goes as close to the acoustic centre as it can, for a directional machine where it simulates the emission pattern, on top of it where that is impractical and alongside only failing that, where positions closer than 0,5 m to the reference box are to be avoided. One location is normally enough; where the largest dimension of the reference box exceeds the measurement distance the source is run at several, along the sides one measurement distance apart when the machine is omnidirectional and one per clearly definable emission area when it has them, and where that dimension does not exceed the measurement distance and an omnidirectional machine cannot take the source on top, four locations are used, one adjacent to each vertical side of the box (clause 7.3). Both sources and the background are read at the same positions with the same microphone orientations, the reference source for 30 s (clause 7.5), and the whole determination is made in octave bands from 125 Hz to 8 kHz (clause 3.11); Table D.1 tabulates a 63 Hz row besides, for use only where the environment and the instrumentation are satisfactory there (footnote a), which is why the API accepts that band too.
The background is corrected position by position before anything is averaged (clause 8.1, Eq. 7):
with three rules round it. A margin above 15 dB needs no correction at that
position. A margin between 6 dB and 15 dB takes Eq. 7, which runs from
1,26 dB at 6 dB to 0,14 dB at 15 dB. A margin below 6 dB caps the
correction at 1,3 dB and reduces the accuracy of the result: the level
may still be reported, but as an upper bound, and the report must say that
the background requirement was not met. sound_power_in_situ applies all
three, returns the per-position it used, and flags every band where
some margin fell below 6 dB in background_requirement_met, band by band,
so the flag can travel into the report with the level it qualifies. The
reference source is corrected the same way, with the same background reading
unless it brought its own (clause 7.5 takes one reading for both), and the
corrected levels are energy-averaged over the positions (Eq. 8, 9):
The sound power level in each octave band is then the comparison itself (clause 8.3.1, Eq. 11):
Where the reference source was run at locations, its calibrated powers and its per-location means are each energy-averaged over the locations first (clause 8.3.2, Eq. 12), so a location that samples the room better does not outvote one that samples it worse:
Eq. 12 collapses to Eq. 11 when the locations are indistinguishable, and the background correction of the reference source is evaluated per location and per position, because the margin it comes from depends on both even though the standard prints without the location index.
Table 1 of the standard is worth reading before placing anything, though it is guidance and not arithmetic. It sorts the microphone positions by line of sight: a position that sees the source under test but not the reference source strongly overestimates the machine, one that sees the reference source but not the machine strongly underestimates it, and where both are in sight the sign of the error follows which of the two is nearer, vanishing when the two measurement distances agree within 10 %. The positions to choose are the ones in that last zone. Where they cannot all be there, clause 7.4.3 balances the set instead, one position in a + zone, one in a +/− zone and one or two in − zones, and Annex B recommends a single position in the zone the machine screens. The library evaluates none of this: it takes the levels it is given and assumes the positions were chosen well.
import numpy as npfrom phonometry import emission
# A floor-standing screw compressor, 2.2 m x 1.4 m x 1.8 m, that cannot# leave the plant: four microphone positions 1.5 m from its reference box,# one reference sound source location alongside, octave bands 125 Hz - 8 kHz.freqs = np.array([125.0, 250.0, 500.0, 1000.0, 2000.0, 4000.0, 8000.0])lw_rss = np.array([84.5, 88.0, 91.0, 92.5, 92.0, 90.5, 87.0])  # calibratedst = np.array([  # L'pi(ST): one row per microphone position, dB    [82.4, 84.9, 86.1, 85.3, 82.6, 78.4, 72.1],    [80.9, 84.1, 85.4, 84.7, 81.8, 77.5, 71.3],    [83.1, 85.6, 86.8, 85.9, 83.2, 79.0, 72.8],    [81.7, 84.5, 85.8, 85.0, 82.3, 78.0, 71.7],])rss = np.array([  # L'pi(RSS): the reference source at the same positions    [78.2, 81.8, 84.6, 86.0, 85.6, 84.1, 80.4],    [77.5, 81.1, 84.0, 85.4, 85.0, 83.4, 79.8],    [78.9, 82.4, 85.1, 86.5, 86.1, 84.6, 80.9],    [78.0, 81.6, 84.4, 85.8, 85.4, 83.9, 80.2],])background = np.array([  # Lpi(B): the factory floor, loud at the low end    [75.0, 74.0, 72.0, 70.0, 67.0, 62.0, 57.0],    [76.5, 75.0, 73.0, 71.0, 68.0, 63.0, 58.0],    [74.5, 73.5, 71.5, 69.5, 66.5, 61.5, 56.5],    [75.5, 74.5, 72.5, 70.5, 67.5, 62.5, 57.5],])
res = emission.sound_power_in_situ(    st, rss, lw_rss, freqs, background_levels=background,    conditions=emission.GradeConditions(        excess_levels=[8.2, 7.6, 8.9, 8.0],   # dLfA at each position (Annex A)        directivity_range=4.0,                # +/-4 dB round the machine (7.2)    ),    sigma_omc=0.5,                        # a steady source (9.2 NOTE))print(np.round(res.sound_power_level, 1))   # [88.8 91.5 92.6 91.8 88.9 84.7 78.6]print(round(res.sound_power_level_a, 1))    # 96.1 dB(A)print(res.background_requirement_met)       # [False  True  True  True  True  True  True]print(np.round(res.background_correction[1], 2))  # position 2: [1.3 0.57 0.26 0.19 0.18 0.16 0.21]print(res.grade, res.sigma_r0, round(res.expanded_uncertainty, 1))  # engineering 1.5 3.2
The 125 Hz band is the one to read twice. At one of the four positions the
margin over the floor is below 6 dB for the machine, and it is below 6 dB at
every position for the quieter reference source, so takes its 1,3 dB
cap there and the 88,8 dB the band reports is an upper bound, which is
what the False says. Every other band clears 6 dB everywhere, 250 Hz with
corrections of half a decibel that Eq. 7 evaluates rather than ignores, and
from 1 kHz up the margin passes 15 dB at two or three of the four positions,
where the correction is zero; the correction the others still take stays
below 0,25 dB.
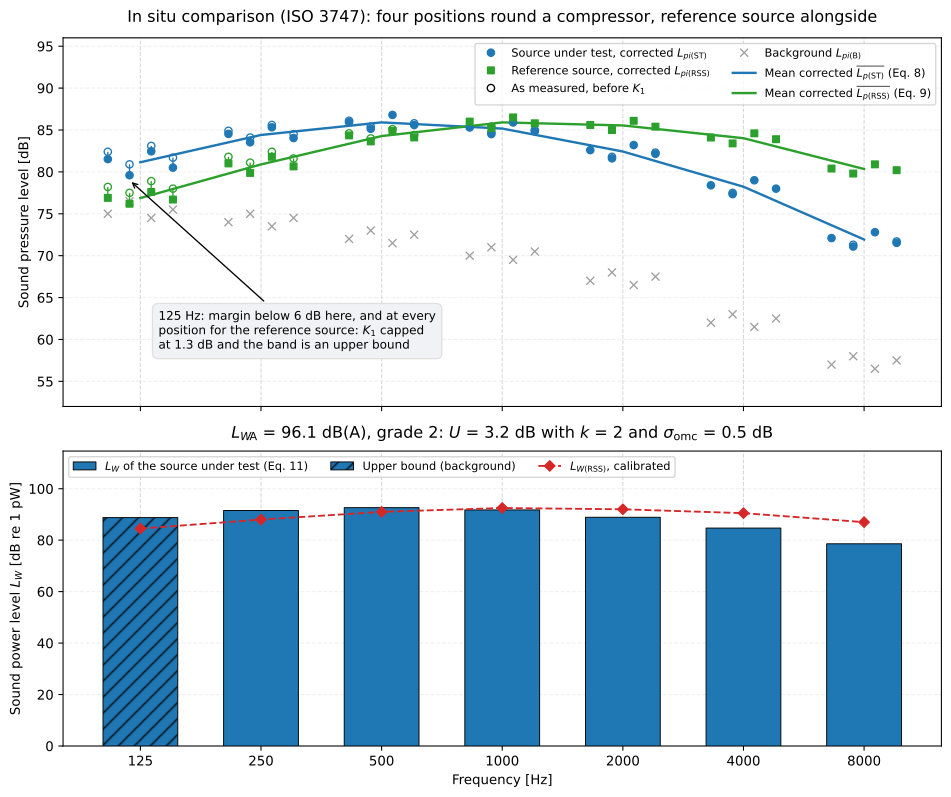
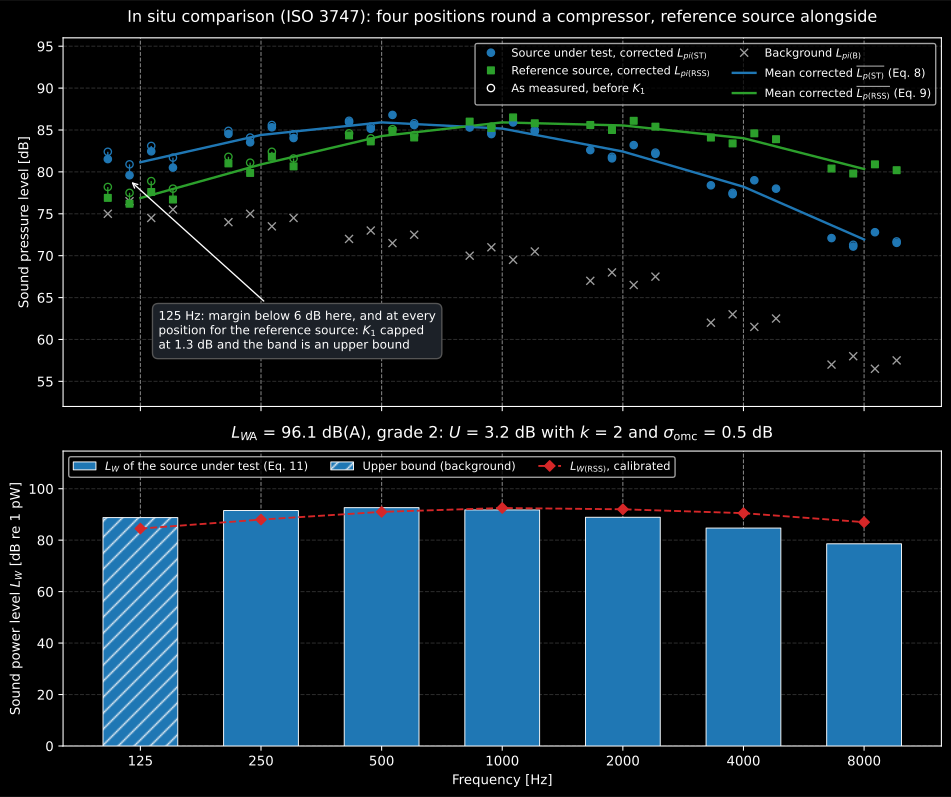
The comparison position by position. Above, both sources at the four microphones after the Eq. 7 correction, with the hollow markers showing where each level was before it; the reference source sits below the machine at the low end and above it from 1 kHz up, which is what the shape of the calibrated curve below does to the result. Below, Eq. 11 band by band, with the calibrated beside it and the 125 Hz upper bound hatched.
Show the code for this figure
import matplotlib.pyplot as plt
# res is the InSituSoundPowerResult computed above. One line:res.plot()   # LW bars, LWA in the title, the upper-bound band hatchedplt.show()
# By hand: both sources per position above, Eq. 11 below.corrected_st = st - res.background_correctioncorrected_rss = rss - res.background_correction_ref[0]x = np.arange(freqs.size)fig, (axt, axb) = plt.subplots(2, 1, figsize=(10, 8.4), sharex=True)for i, offset in enumerate(np.linspace(-0.27, 0.27, st.shape[0])):    axt.plot(x + offset, corrected_st[i], "o", color="#1f77b4")    axt.plot(x + offset, corrected_rss[i], "s", color="#2ca02c")    axt.plot(x + offset, background[i], "x", color="#9e9e9e")axt.plot(x, res.mean_source_level, "-", color="#1f77b4", label="mean, source under test")axt.plot(x, res.mean_reference_level, "-", color="#2ca02c", label="mean, reference source")axt.set_ylabel("Sound pressure level [dB]")axt.legend()bars = axb.bar(x, res.sound_power_level, width=0.62, color="#1f77b4")for bar, met in zip(bars, res.background_requirement_met, strict=True):    if not met:        bar.set_hatch("//")axb.plot(x, res.reference_power_level, "D--", color="#d62728", label="calibrated LW(RSS)")axb.set_xticks(x, [f"{f:g}" for f in freqs])axb.set_xlabel("Frequency [Hz]")axb.set_ylabel("Sound power level LW [dB re 1 pW]")axb.legend()plt.show()
A machine that is long relative to the measurement distance gets the reference source at several locations along its sides (clause 7.3.3), and the levels arrive as one grid per location:
# The same compressor with the reference source run at two locations, one# along each long side; the second sits nearer a wall and reads 1.2 dB lower,# and was calibrated in a similar position 0.4 dB lower.two = emission.sound_power_in_situ( st, np.stack([rss, rss - 1.2]), np.stack([lw_rss, lw_rss - 0.4]), freqs, background_levels=background,)print(two.reference_levels.shape) # (2, 7): mean level per location (Eq. 10)print(np.round(two.sound_power_level, 1)) # [89.1 92. 93. 92.2 89.3 85.1 78.9]print(round(two.sound_power_level_a, 1)) # 96.5 dB(A)How the measurement goes
Section titled “How the measurement goes”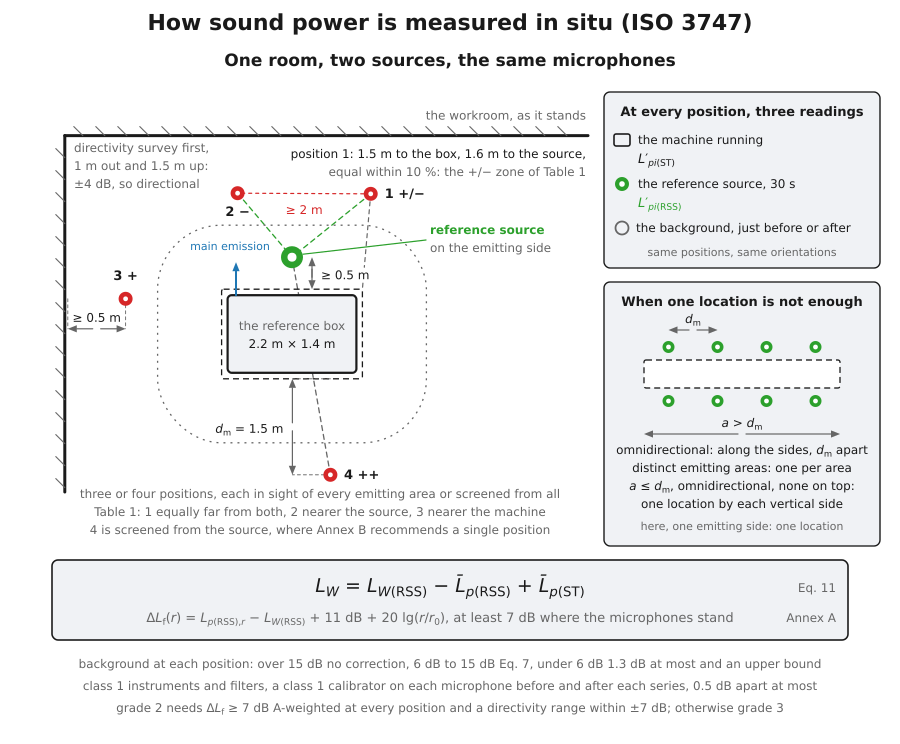
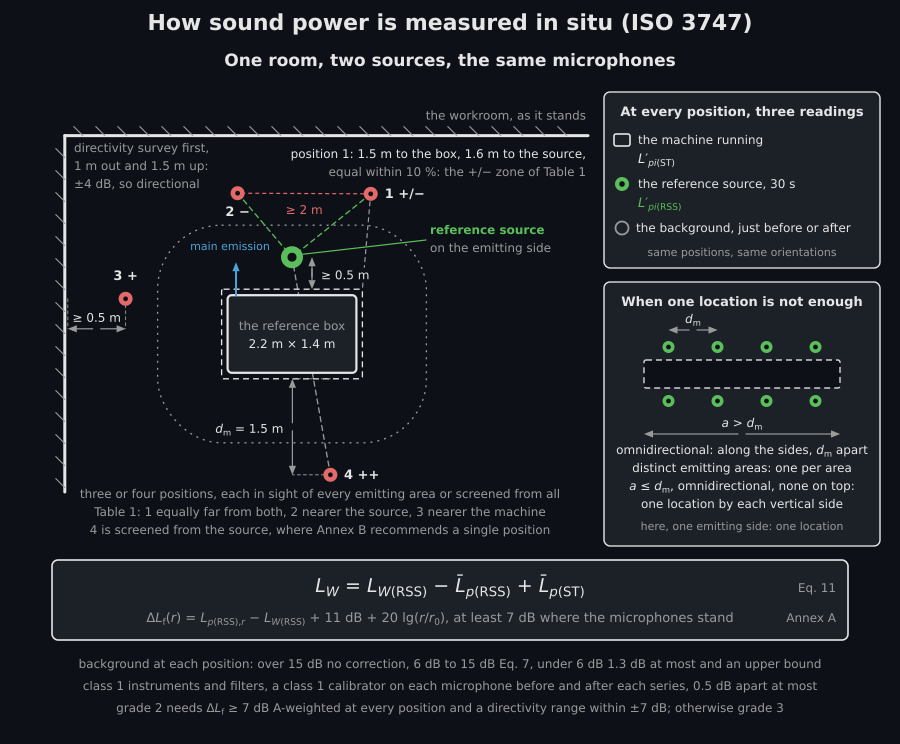
Use class 1 instruments and filters, and a class 1 calibrator on every microphone before and after each series, discarding the series if the two readings differ by more than 0,5 dB. Listen to the machine first: where the sound of one component predominates, the geometric centre of that component is the acoustic centre and the reference box is drawn just round that component, down to the floor it stands on; where no component sounds more than any other, leave out every component that clearly emits nothing and take the geometric centre and the box of what is left. Then survey the directivity 1 m from the reference box, normally 1,5 m up and at 2 m intervals or less along a side: within ±2 dB the machine counts as omnidirectional, and beyond ±7 dB the result stays at survey grade. Put the reference source as close to the acoustic centre as you can: for a directional machine, where it simulates the emission pattern, otherwise on top, and only failing that alongside, avoiding positions closer than 0,5 m to the reference box. One location normally does. Where the largest dimension of the reference box is greater than the measurement distance, use several: along the sides, one measurement distance apart, for an omnidirectional machine, and one per area for a machine with clearly definable emission areas. Where that dimension does not exceed the measurement distance and an omnidirectional machine cannot take the source on top, use four locations, one adjacent to each vertical side of the box. Place three or four microphones round the machine, at least 2 m apart and 0,5 m from every boundary, where Annex A gives dB, seeking positions as far from the source as from the box, within 10 %; where they cannot all be there, take one nearer the box, one equally far and one or two nearer the source. At each position, with the same orientation, read the machine, the reference source for about 30 s and the background just before or after, in octave bands from 125 Hz to 8 kHz; an impulsive machine takes at least five events. Correct each position for background: above 15 dB nothing, 6 dB to 15 dB by Eq. 7, below 6 dB 1,3 dB at most, and that band is an upper bound the report must flag. Record what the aural examination found, the dimensions of the reference box, the measurement distance, the positions, the source locations and , and report band and A-weighted levels to 0,1 dB with the grade, , its coverage factor and probability.
sound_power_in_situ() parameters
Section titled “sound_power_in_situ() parameters”| Parameter | Type | Units | Range / default | Notes |
|---|---|---|---|---|
levels | 2D array | dB | (n, bands) | Measured , one row per microphone position, three or four positions (7.4.1) |
levels_ref | 2D or 3D array | dB | (n, bands) or (m, n, bands) | The reference source at the same positions, one grid per location, corrected per its manufacturer for speed, temperature and pressure but not for background |
lw_ref | 1D or 2D array | dB | (bands,) or (m, bands) | Calibrated , per location when each was calibrated in its own similar position (Eq. 12) |
frequencies | 1D array | Hz | 63 Hz to 8 kHz octaves | Nominal octave mid-band frequencies of Table D.1; required. Clause 3.11 puts the general-purpose range at 125 Hz to 8 kHz; the 63 Hz row of Table D.1 carries footnote a, which allows it only where the test environment, the reference sound source and the instrumentation are satisfactory at that frequency |
background_levels | 1D or 2D array | dB | (bands,) or (n, bands) | ; one spectrum serves every position. None warns and leaves background_requirement_met False in every band, since 7.5 measures it at each position and 8.1 needs the margin |
background_levels_ref | 1D or 2D array | dB | same shapes | Background for the reference-source reading; None reuses background_levels (7.5) |
temperature_c | float | °C | default 23.0 | Air temperature at the test, for |
static_pressure_kpa | float | kPa | default 101.325 | Static pressure at the test, for ; see static_pressure_from_altitude |
conditions | GradeConditions | The two conditions Table 2 reads together: excess_levels, the at each position (n,) in decibels (Annex A), and directivity_range, the half-width of the A-weighted directivity survey in decibels (7.2). Either one left out leaves the determination at survey grade | ||
sigma_omc | float | dB | Standard deviation of the operating and mounting conditions (9.2); None leaves the uncertainty NaN | |
coverage_factor | float | default 2.0 | of Eq. 23; 1,6 for a one-sided comparison with a limit |
The function returns an InSituSoundPowerResult: sound_power_level (Eq. 11
or 12, at the conditions of the test), mean_source_level and
mean_reference_level (Eq. 8, 9), reference_levels per location (Eq. 10),
reference_power_level, background_correction per position and band,
background_correction_ref per location, position and band,
background_requirement_met per band, c2, grade, sigma_r0,
sigma_omc, sigma_tot, expanded_uncertainty, coverage_factor,
sound_power_level_a and quantity. sound_power_level_ref adds c2 to
the level (section 3).
2. Impulsive sources: the sound energy level (Eq. 13 to 20)
Section titled “2. Impulsive sources: the sound energy level (Eq. 13 to 20)”A press stroke or a door slam has no steady power to report. Clause 8.4 measures the single event level at each position instead, either one event at a time, at least five of them (clause 7.6), or once over a run of successive events, and clause 8.5 turns the mean into a sound energy level in dB re 1 pJ by the same comparison, with the reference source still read time-averaged over 30 s. Measured one at a time, each event is corrected for background with Eq. 14 (Eq. 7 with the event level in the margin) and the corrected levels are energy-averaged into the mean single event level of the position (Eq. 13, 15); measured once over events, the level is corrected and reduced by to one event (Eq. 16, 17). The per-position levels are energy-averaged over the positions (Eq. 18), and
(Eq. 19), or its several-location form (Eq. 20), which is Eq. 12 with the
event mean in the last term. sound_energy_in_situ takes the events as a
3D (n, N, bands) array for the one-at-a-time form or as a 2D (n, bands)
measurement with events=N for the other, and returns the same result type
with quantity='energy', the level in sound_energy_level and the Annex D
total in sound_energy_level_a.
One line of Eq. 14 deserves a note. It subtracts the time-averaged
background level from a time-integrated event level,
and asks only that both be measured over the same integration time . As
printed, the difference is a true signal-to-background margin for = 1 s;
for a longer the background holds dB more energy
over the event’s interval than its time-averaged level says (clause 3.4,
NOTE 1), and the margin is overstated by that much. ISO 3741 and ISO 3744
print the same line for their single-event clauses, so it is the family’s
convention and not a misprint of this part. The library applies Eq. 14 as
printed by default and offers integration_time to carry the background to
the event’s interval first; the two agree at = 1 s.
# The same room, a press beside the compressor: six strokes measured one at a# time at the four positions, each integrated over 4 s, with the same# reference source reading and the same floor.strokes = np.array([ [96.3, 98.1, 99.4, 98.8, 96.0, 92.1, 86.4], [95.1, 97.4, 98.7, 98.0, 95.3, 91.4, 85.6], [97.0, 98.9, 100.1, 99.5, 96.6, 92.8, 87.0], [95.8, 97.9, 99.0, 98.4, 95.8, 91.9, 86.0],])events = np.stack([strokes + d for d in (-0.3, 0.2, 0.0, 0.4, -0.2, 0.1)], axis=1)energy = emission.sound_energy_in_situ( events, rss, lw_rss, freqs, # (4 positions, 6 events, 7 bands) background_levels=background, integration_time=4.0, conditions=emission.GradeConditions(excess_levels=[8.2, 7.6, 8.9, 8.0], directivity_range=4.0), sigma_omc=2.0,)print(energy.quantity) # energyprint(np.round(energy.sound_energy_level, 1)) # [103.7 105.3 106.1 105.3 102.4 98.6 93. ]print(round(energy.sound_energy_level_a, 1)) # 109.7 dB(A) re 1 pJprint(round(energy.expanded_uncertainty, 1)) # 5.0 dB: grade 2 with sigma_omc = 2 dBThe 125 Hz band is an upper bound here too, and for the reason the steady determination gave: the reference source’s own margin over the floor is below 6 dB there, and the flag follows both sources. The 5,0 dB is the standard’s own example in clause 9.5, reproduced because the inputs are the same: grade 2, = 2,0 dB, = 2.
sound_energy_in_situ() parameters
Section titled “sound_energy_in_situ() parameters”| Parameter | Type | Units | Range / default | Notes |
|---|---|---|---|---|
event_levels | 3D or 2D array | dB | (n, N, bands) or (n, bands) | per event, or of one measurement over events |
events | int | for the 2D form (Eq. 17); must be None with the 3D form. Clause 7.6 asks for at least five events, so fewer than five warns and the determination is nonconforming, on either form | ||
integration_time | float | s | of the event measurement; None applies Eq. 14 as printed | |
levels_ref, lw_ref, frequencies, background_levels, background_levels_ref, temperature_c, static_pressure_kpa, excess_levels, directivity_range, sigma_omc, coverage_factor | As in sound_power_in_situ() |
3. Grade, uncertainty and reference conditions
Section titled “3. Grade, uncertainty and reference conditions”Grade (Table 2). Engineering grade 2 needs the A-weighted excess dB at every microphone position and a source directivity range within ±7 dB from the survey of clause 7.2, taken 1 m from the reference box at intervals of 2 m or less; either indicator failing, or not determined at all, gives survey grade 3. The table pairs each grade with a typical upper bound of the reproducibility of the method, 1,5 dB for grade 2 and 4,0 dB for grade 3, valid for a relatively flat spectrum in which the 250 Hz to 4 kHz octaves carry the A-weighted level; a source dominated by bands below 500 Hz reproduces worse than that. The excess itself is Annex A (Eq. A.1),
measured along a line of sight from the reference source at varying ,
and it is zero in a free field: excess_sound_pressure_level evaluates it
and broadcasts, so one calibrated power serves a whole traverse.
Uncertainty (clause 9). The standard deviation of reproducibility of the method and the deviation of the operating and mounting conditions of the source, , combine in quadrature (Eq. 22) and the expanded uncertainty follows with the coverage factor (Eq. 23):
with = 2 for the two-sided 95 % interval the standard assumes, or 1,6
for a one-sided comparison with a limit value. is the
user’s number, from repeated determinations under the conditions of clause
9.2 and E.3; the NOTE of 9.2 puts it near 0,5 dB for a steady source, 2 dB
for one with material flow and 4 dB for stone breaking, metal cutting or a
press under load. The standard’s own example (clause 9.5), grade 2 with
= 2,0 dB and = 2, gives
dB = 5 dB, which the energy example above
reproduces. Without a sigma_omc the result carries sigma_r0 and leaves
sigma_tot and expanded_uncertainty NaN rather than reporting a method
uncertainty as if it were the whole.
Reference conditions (Annex C). Eq. 11 gives the level at the meteorological conditions of the test. Annex C carries it to 101,325 kPa and 23,0 °C with the radiation-impedance correction
the same as ISO 3741 clause 9.1.4 (the library evaluates it through
that module), valid for a monopole and a mean value for other sources, and
estimates the static pressure from the altitude of the site when no barometer
was read (Eq. C.2):
with = 2,2560 × 10⁻⁵ m⁻¹ and = 5,2553. The result exposes c2 and
the properties sound_power_level_ref and sound_energy_level_ref
(Eq. C.1, C.3); the A-weighted total under reference conditions is
sound_power_level_a + c2, since the shift is the same in every band. One
detail of the annex is worth knowing: is printed as
296 K beside a reference temperature of 23,0 °C, which is 296,15 K, so at
exactly the reference conditions is +0,003 3 dB and not zero. ISO 3741
and ISO 3744 print the same 296 K, so it is the family’s rounding and the
library keeps it.
# A plant 640 m above sea level, at 27 degC, with no barometer on site.ps = emission.static_pressure_from_altitude(640.0)print(round(ps, 2))                                 # 93.87 kPa (Eq. C.2)high = emission.sound_power_in_situ(    st, rss, lw_rss, freqs, background_levels=background,    temperature_c=27.0, static_pressure_kpa=ps,)print(round(high.c2, 3))                            # 0.423 dBprint(round(float(high.sound_power_level[3]), 2), round(float(high.sound_power_level_ref[3]), 2))# 91.76 at the test conditions, 92.18 under the reference conditions (1 kHz)
# Annex A along a line of sight from the reference source, A-weighted.print(np.round(emission.excess_sound_pressure_level([81.0, 76.5, 73.8], 92.5, [1.5, 3.0, 6.0]), 2))# [3.02 4.54 7.86]: reverberant enough for grade 2 only from about 6 m out
A-weighted totals (Annex D). and are the
energy sums of the band levels plus the Table D.1 corrections , which
are −26,2, −16,1, −8,6, −3,2, 0,0, 1,2, 1,0 and −1,1 dB from 63 Hz to 8 kHz,
the ISO 3744 Annex E octave values digit for digit; the library reads them
from the shared table and requires every entry of frequencies to be one of
those eight nominal centres, distinct and in ascending order; the 63 Hz row
is for use only where the environment and the instrumentation are
satisfactory there (Table D.1, footnote a).
What this guide covers
Section titled “What this guide covers”Covered
The ISO 3747 comparison in situ (
sound_power_in_situ): the per-position background correction of clause 8.1 with its 6 dB and 15 dB rules and the 1,3 dB cap, the mean corrected levels of clause 8.2, the sound power level for one (Eq. 11) or several (Eq. 12) reference-source locations, the single-event levels of clause 8.4 in both forms and the sound energy level of clause 8.5 (sound_energy_in_situ), the Table 2 grade with its , the clause 9 uncertainty (Eq. 22, 23), the Annex A excess of sound pressure level (excess_sound_pressure_level), the Annex C reference conditions with Eq. C.2 (static_pressure_from_altitude) and the Annex D A-weighted totals.Not covered
The Annex E uncertainty budget (Table E.2 and its sensitivity coefficients) is documented but not modelled: is the typical upper bound of Table 2 by grade, not a machine-specific value from a round robin (9.3.2) or from the model of 9.3.3. The zoning of Table 1, the directivity survey of clause 7.2 and the placement rules of clause 7.3 are the operator’s decisions, made before the levels exist; the library takes the levels and the two indicators the grade needs. The reference source’s own corrections for speed, temperature and static pressure are its manufacturer’s, applied before the levels arrive. The other in situ routes are their own guides: Sound Power by Pressure Methods for the enveloping surface, Sound Power by Intensity Scanning for the probe.
References
Section titled “References”- International Organization for Standardization. (2010). Acoustics — Determination of sound power levels and sound energy levels of noise sources using sound pressure — Engineering/survey methods for use in situ in a reverberant environment (ISO 3747:2010). The comparison method of this guide: the background correction of clause 8.1, the mean levels and the sound power and sound energy levels of clauses 8.2 to 8.5, the Table 2 grades, the clause 9 uncertainty and Annexes A, C and D.
- International Organization for Standardization. (2010). Acoustics — Determination of sound power levels and sound energy levels of noise sources using sound pressure — Precision methods for reverberation test rooms (ISO 3741:2010). The precision comparison method of a qualified room, whose Eq. 21 is Eq. 11 of this guide plus the same radiation-impedance correction C2 (clause 9.1.4), reused here for Annex C.