Room acoustic parameters (ISO 3382-1/2)
Standards: ISO 3382Key references: Kuttruff 2016Schroeder 1965Hak et al. 2012
Room acoustics starts from one measurement: the impulse response (IR) between a source and a receiver. Filter it into bands and integrate it, and it yields reverberation time, clarity and centre time: everything ISO 3382-1/2 asks about the sound field inside a single room. This page turns a measured IR into those parameters: the Schroeder decay curve, the evaluation windows, the validity flags and the accredited fiche. Acquiring the IR itself (sweeps, MLS, where to measure) lives in Measuring the Room Impulse Response, and the open-plan speech metrics of ISO 3382-3 in Open-Plan Office Acoustics. Two separate decay measurements in a reverberation room, one with the room empty and one with the specimen installed, yield a material’s sound absorption; that method (ISO 354) lives in Sound Absorption Measurement and Rating. For sound insulation between spaces (the same IR measured either side of a partition) see the companion Field Insulation Measurement (ISO 16283) guide.
Decay analysis and room parameters (ISO 3382-1/2)
Section titled “Decay analysis and room parameters (ISO 3382-1/2)”The IR is filtered into octave (or one-third-octave) bands and each band is turned into a decay curve by Schroeder backward integration of the squared IR:
Integrating backwards removes the fluctuation that plagues a raw squared IR and yields a smooth curve whose slope is the decay rate. Background noise would make level off, so integration is truncated where the fitted decay line crosses the noise floor and the missing tail is compensated assuming an exponential decay.
Reverberation times come from a least-squares line fit over an evaluation range, extrapolated to a full 60 dB drop, : EDT over 0 to −10 dB (perceived reverberance), T20 over −5 to −25 dB and T30 over −5 to −35 dB. Energy splits at an early/late boundary give clarity and definition,
with ms → C50 (speech) and ms → C80 (music), plus the centre time . Each parameter has a just-noticeable difference (ISO 3382-1 Table A.1: EDT 5 %, C80 1 dB, D50 0.05, Ts 10 ms) that sets how precisely it is worth reporting.
Where is. All three energy integrals start at the arrival of the
direct sound, not at the start of the file. ISO 3382-1 A.3.4 places that
point where the response first rises significantly above the background while
still being more than 20 dB below its maximum, and room_parameters applies
that trigger per band before integrating, so any propagation and system delay
carried by the recording is removed automatically. A measured IR needs no
manual trimming. It matters asymmetrically. The reverberation times use only the
slope of the decay and are indifferent to where it starts, but C50, C80 and
integrate from , so an onset placed one millisecond late throws
away part of the direct sound and can move C50 and C80 by several decibels and
by tens of milliseconds, while leaving T20 and T30 almost untouched. The
error is invisible in the number everyone checks. The detector deliberately errs
early, which is the harmless direction. Two working rules follow: never trim an
IR by hand to remove its pre-delay, and be suspicious of C50/C80 from a
recording whose direct sound is soft or has been pre-ringed by external
processing, because the trigger can then fire late.
The tail energy of the squared impulse response fills from the end while the backward integral advances toward t = 0, and the Schroeder decay curve emerges on a companion axis, ending with the T20 and T30 regression lines.
The tail energy of the squared impulse response fills from the end while the backward integral advances toward t = 0, and the Schroeder decay curve emerges on a companion axis, ending with the T20 and T30 regression lines.
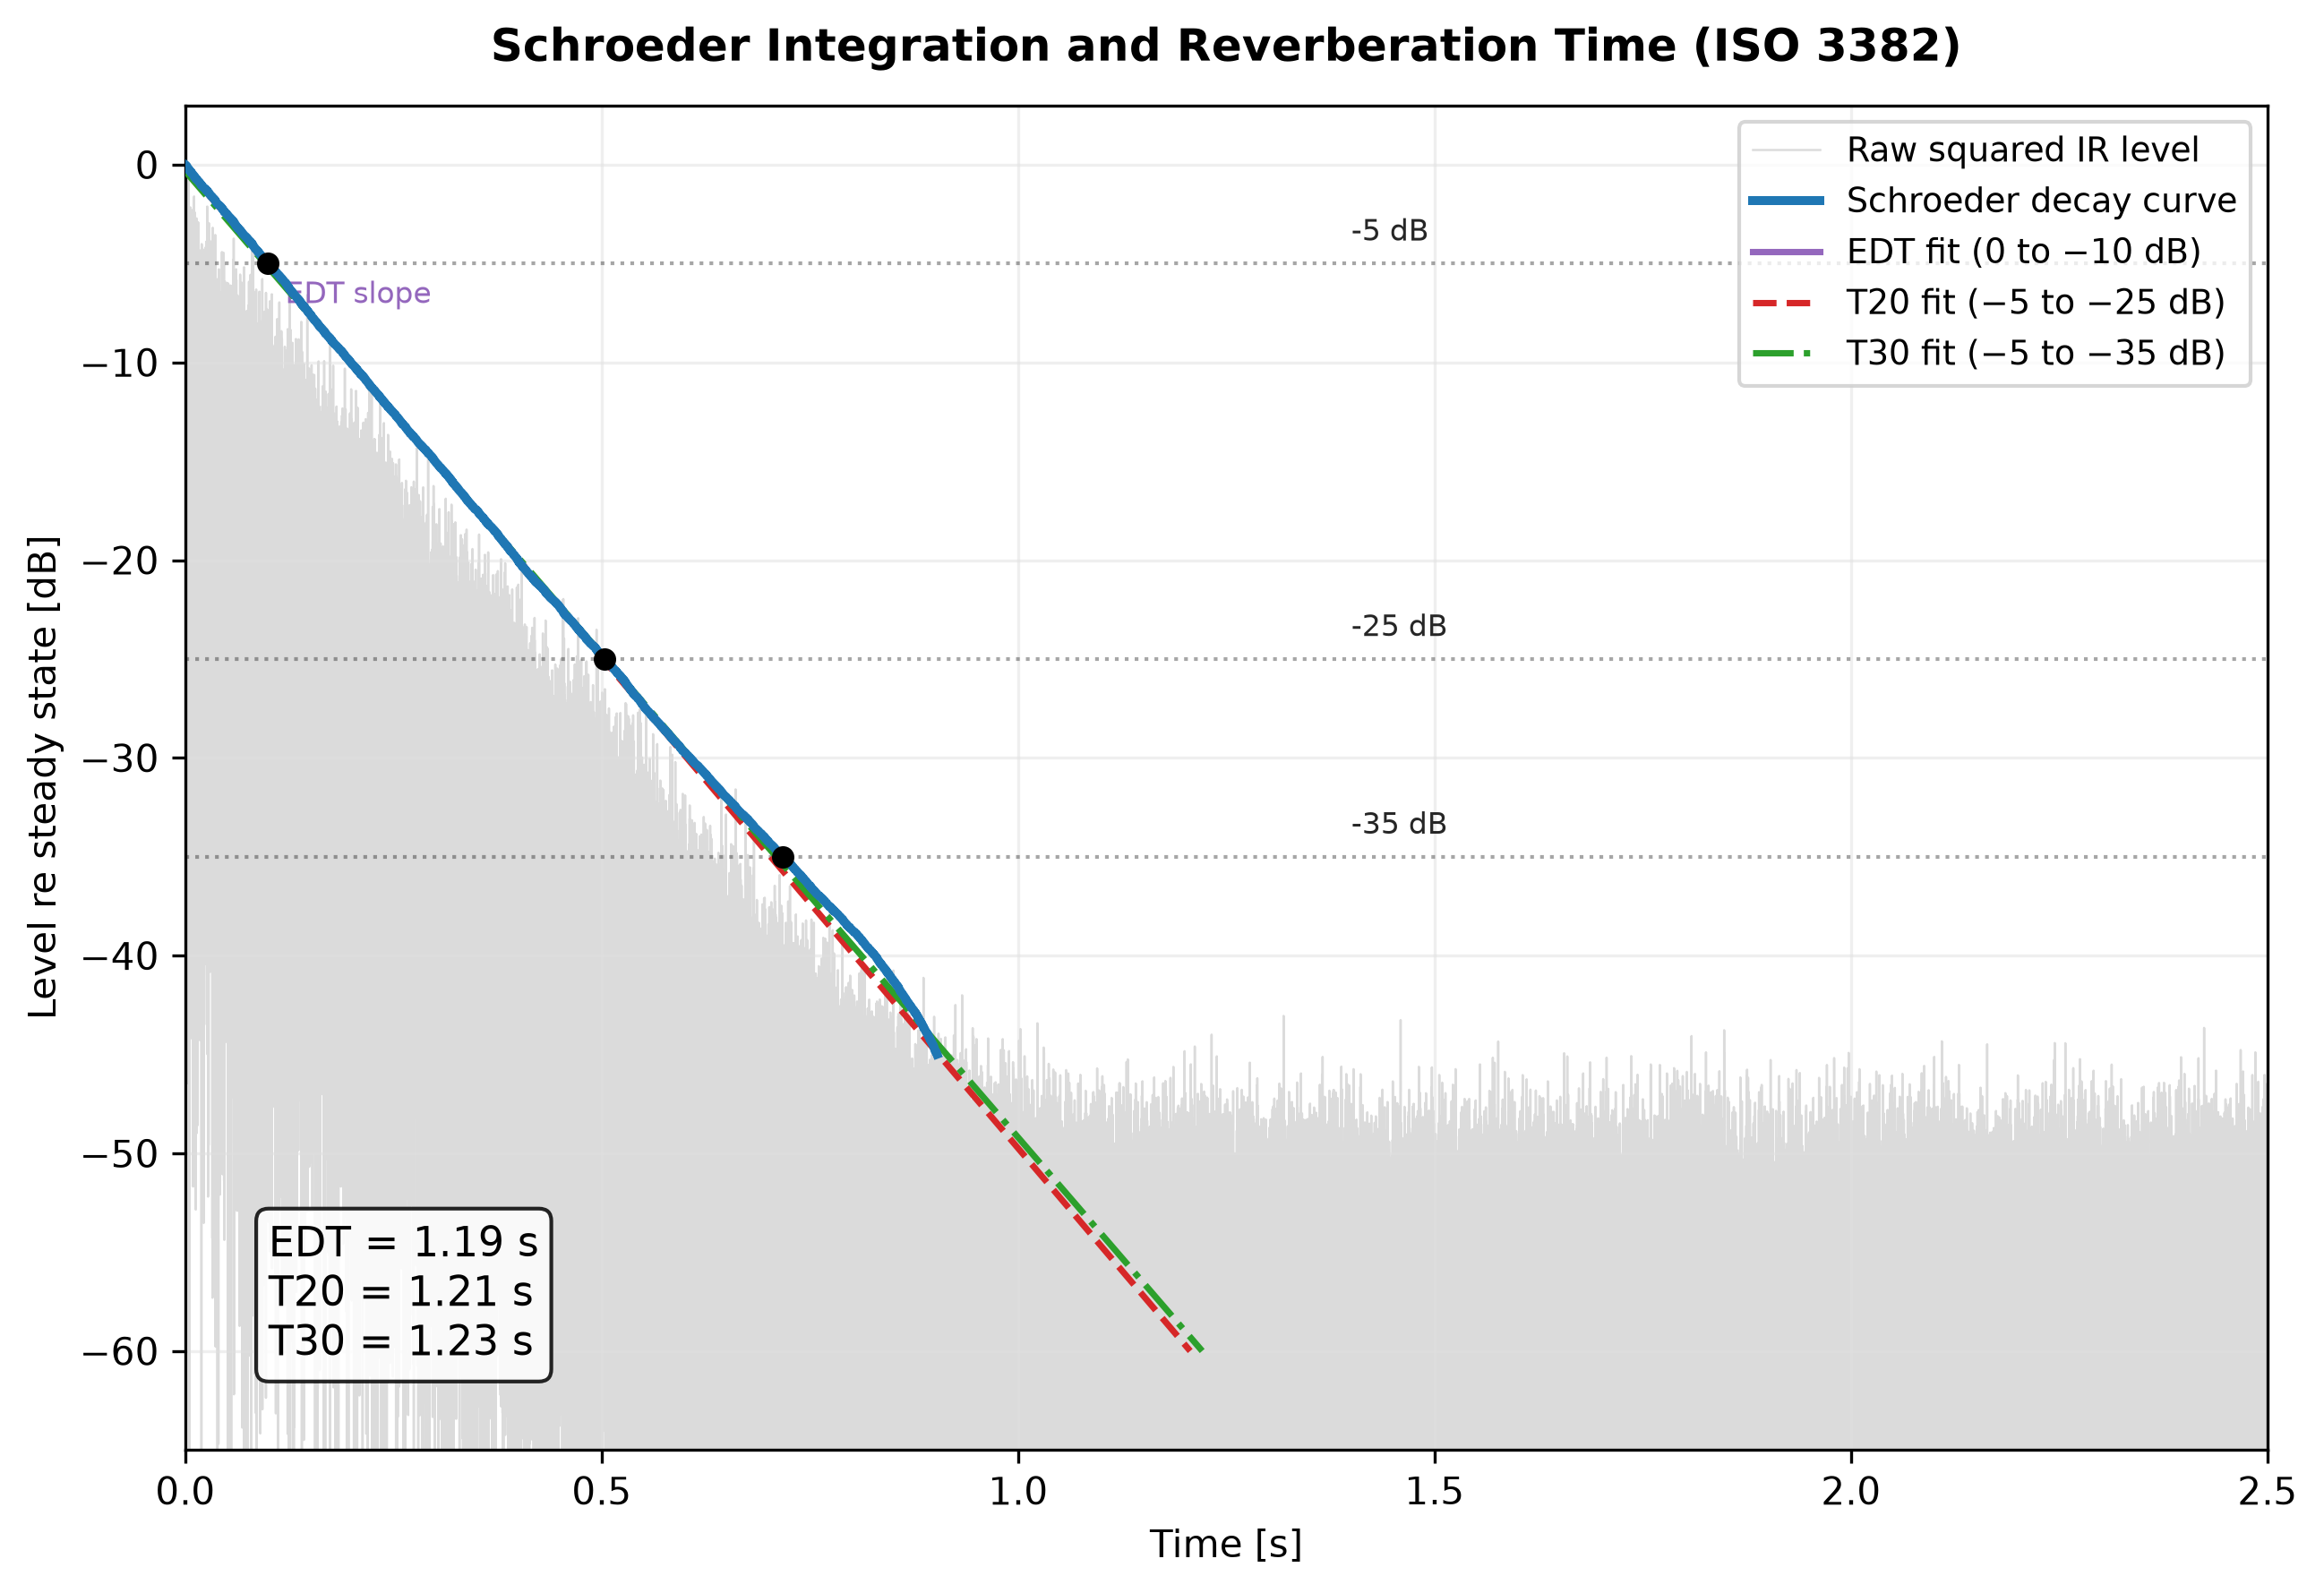
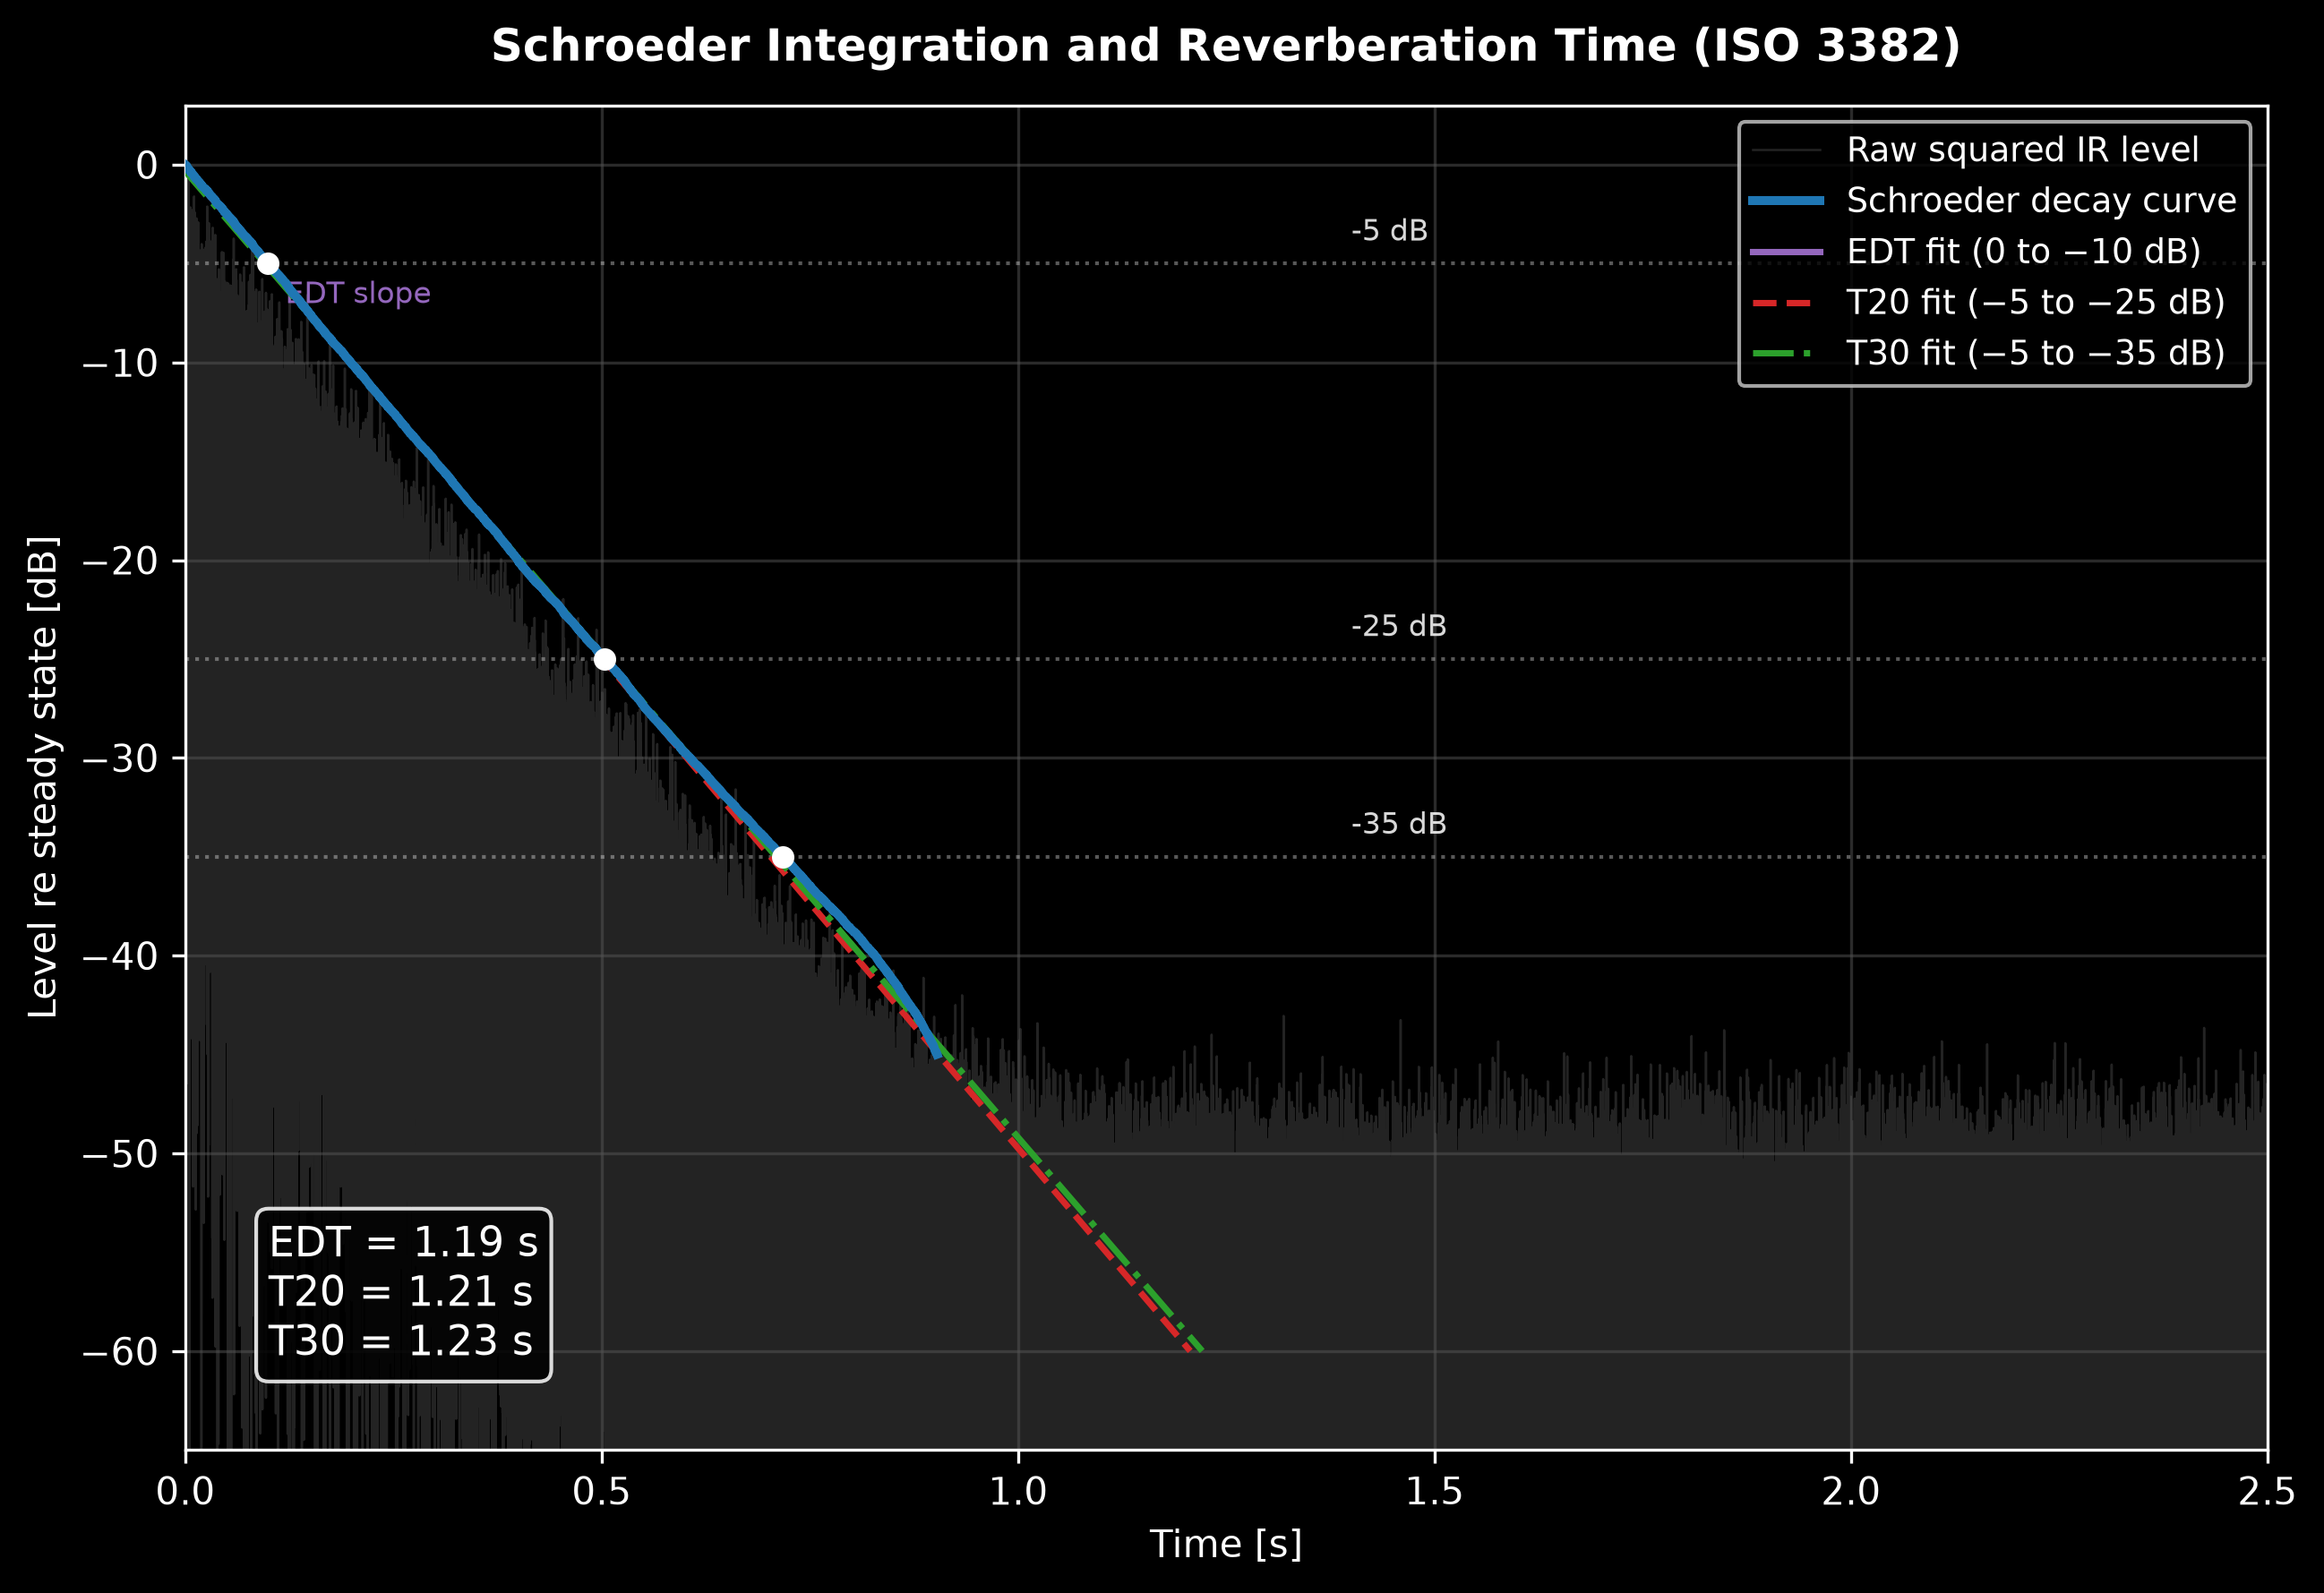
The jagged squared IR (grey) integrates to the smooth Schroeder curve (blue); the EDT, T20 and T30 windows are fitted on that curve and each extrapolated to a 60 dB decay.
import numpy as npfrom phonometry import room
fs = 48000# Single-slope decay with T = 1 s: p^2 = exp(-13.8155 t)  (60/ln(10)/13.8155 = 1)t = np.arange(fs) / fs# ir: measured room impulse response; a synthetic single-slope decay stands in here.ir = np.concatenate([np.zeros(10), np.exp(-13.8155 * t / 2.0)])
time, level = room.decay_curve(ir, fs)                    # Schroeder curve (0 dB at t = 0)
res = room.room_parameters(ir, fs, limits=None)           # broadband single bandprint(round(float(res.t30[0]), 2))                   # 1.0  sprint(round(float(res.c80[0]), 2))                   # 3.05 dBprint(round(float(res.d50[0]), 3))                   # 0.499print(round(float(res.ts[0]) * 1000, 0))             # 72 ms
# Octave bands 125 Hz - 4 kHz (ISO 3382-1 default); use fraction=3 for thirdsoctaves = room.room_parameters(ir, fs)print(octaves.frequencies)                             # ~[126, 251, 501, 1000, 1995, 3981]print(octaves.t30_valid)                             # per-band dynamic-range flags
octaves.plot()               # per-band EDT/T20/T30 + C50/C80 bars (needs matplotlib)room.decay_curve(ir, fs).plot()   # Schroeder decay with EDT/T20/T30 fit overlays
Show the code for this figure
import matplotlib.pyplot as pltimport numpy as npfrom phonometry import room
fs = 48000# Single-slope decay with T = 1 s: p^2 = exp(-13.8155 t)  (60/ln(10)/13.8155 = 1)t = np.arange(fs) / fs# ir: measured room impulse response; a synthetic single-slope decay stands in here.ir = np.concatenate([np.zeros(10), np.exp(-13.8155 * t / 2.0)])time, level = room.decay_curve(ir, fs)                    # Schroeder curve (0 dB at t = 0)
# One line — Schroeder decay with the EDT/T20/T30 straight-line fits:decay = room.decay_curve(ir, fs)          # a DecayCurve (still unpacks as time, level)decay.plot()plt.show()
# By hand, the decay is just the Schroeder curve; mark the evaluation levels:fig, ax = plt.subplots()ax.plot(time, level, color="#1f77b4", label="Schroeder decay")for db in (-5.0, -25.0, -35.0):      # T20 / T30 evaluation-window edges    ax.axhline(db, ls=":", alpha=0.4)ax.set_xlabel("Time [s]")ax.set_ylabel("Level re steady state [dB]")ax.set_ylim(top=3.0)ax.legend()plt.show()
For this single-slope decay EDT, T20 and T30 all return ≈ 1.0 s, and the energy parameters match their closed forms (C80 = 3.05 dB, D50 = 0.499, Ts = 72 ms). A real room has a steeper early slope, so EDT < T30.
What the energy parameters mean. C50 and D50 are the same measurement in two units, tied by ; the printed pair above satisfies it, since = 0.499 gives = −0.02 dB, so a speech space aiming at is aiming at dB, and there is no point quoting both as if they were independent evidence. For music, C80 in unoccupied concert and multi-purpose halls up to 25 000 m³ typically runs between −5 dB and +5 dB (the “typical range” column of ISO 3382-1 Table A.1), with negative values reading as blended or reverberant and values above about +3 dB as dry; in the same halls runs between 60 ms and 260 ms and moves inversely with clarity, and between 0.3 and 0.7. Two cautions go with those ranges. They are single-position values in unoccupied halls, and an audience shortens the decay and raises clarity, so an occupied hall is not described by them. And unlike T30, the energy parameters are early-energy quantities that vary strongly from seat to seat, so a single-position value means little: report the spatial mean with its spread (below). The JND column sets the reporting resolution in the other direction: a 0.5 dB difference in C80 between two designs is not a difference at all.
On a real, frequency-dependent decay the per-band .plot() is the working
summary of the whole measurement: the decay times as grouped bars per octave
(invalid bands hatched) over a second panel with C50 and C80.
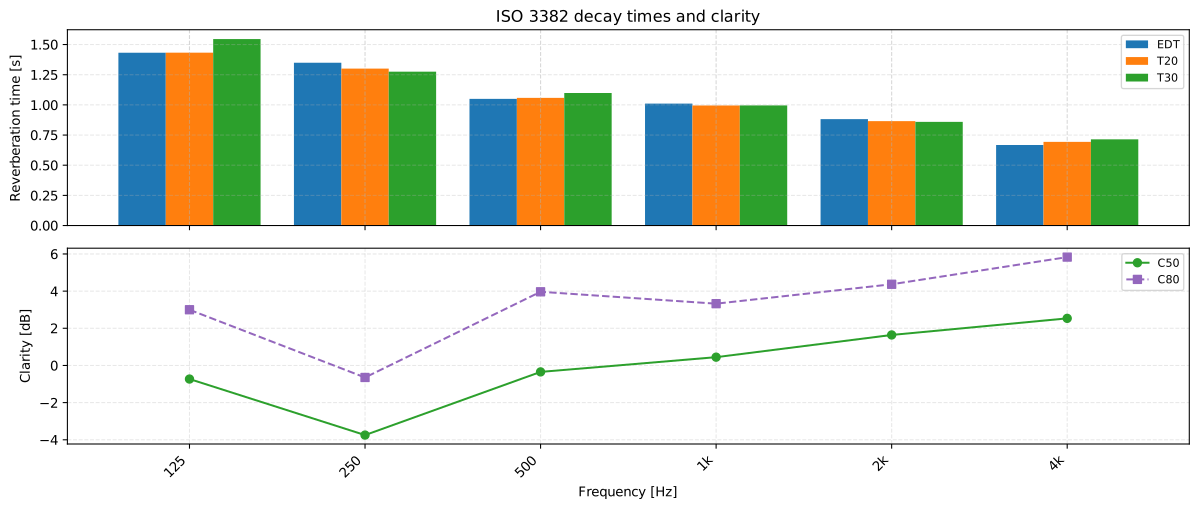
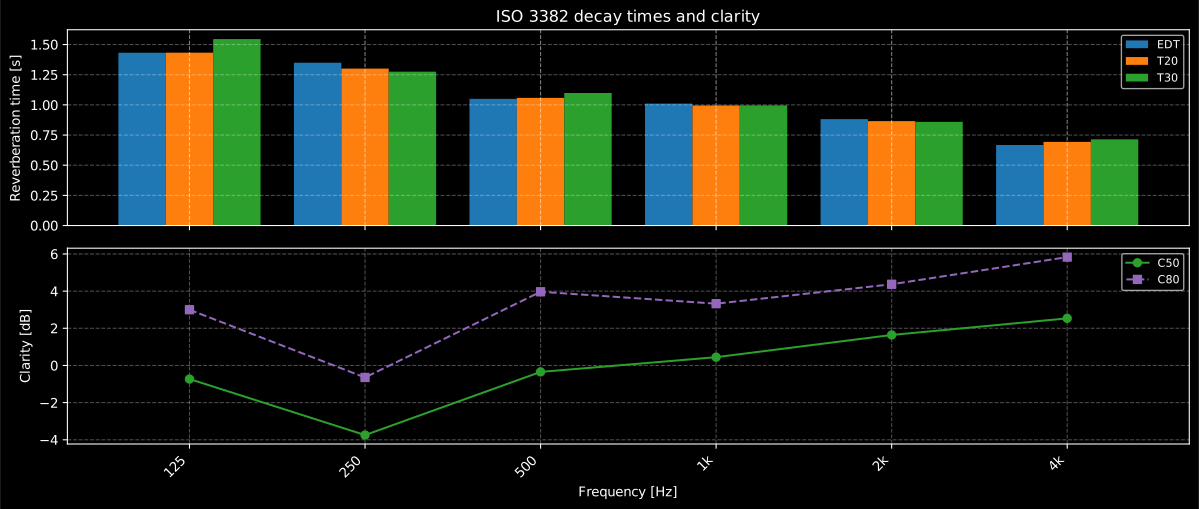
A room whose reverberation time falls from 1.4 s at 125 Hz to 0.7 s at 4 kHz, the typical signature of a furnished room whose absorption grows with frequency; clarity rises as the decay shortens.
Show the code for this figure
import matplotlib.pyplot as pltimport numpy as npfrom scipy import signalfrom phonometry import room
# A synthetic room IR with a frequency-dependent decay: octave-band noise# carriers whose T60 falls from 1.4 s at 125 Hz to 0.7 s at 4 kHz.fs = 48000rng = np.random.default_rng(3382)t = np.arange(int(1.6 * fs)) / fsir = np.zeros_like(t)for fc, t60 in [(125.0, 1.4), (250.0, 1.25), (500.0, 1.1),                (1000.0, 1.0), (2000.0, 0.85), (4000.0, 0.7)]:    sos = signal.butter(4, [fc / np.sqrt(2), fc * np.sqrt(2)],                        btype="bandpass", fs=fs, output="sos")    carrier = signal.sosfilt(sos, rng.standard_normal(t.size))    ir += carrier * np.exp(-3.0 * np.log(10.0) / t60 * t)
# One line: per-band EDT/T20/T30 bars + C50/C80 (needs matplotlib).octaves = room.room_parameters(ir, fs)octaves.plot()plt.show()
# By hand: the T30 spectrum from the result's fields.fig, ax = plt.subplots()ax.bar(np.arange(octaves.t30.size), octaves.t30)ax.set_xticks(np.arange(octaves.t30.size))ax.set_xticklabels([f"{f:g}" for f in octaves.frequencies])ax.set_xlabel("Octave-band centre frequency [Hz]")ax.set_ylabel("T30 [s]")plt.show()
Reading EDT, T20 and T30 against each other
Section titled “Reading EDT, T20 and T30 against each other”The three times extrapolate the same 60 dB decay from different windows, so their disagreement carries information:
- T20 ≈ T30 (curvature below 10 %): the decay is close to a single straight slope over both evaluation windows, which is consistent with (though not proof of) a diffuse field, and either time can stand for “the” reverberation time of the band.
- T30 > T20 (curvature above 10 %): the decay sags, with late energy decaying more slowly than early energy. The usual causes are coupled volumes (an open door to a corridor or stairwell, a deep balcony or a stage house feeding energy back) and strongly uneven absorption that leaves one room axis reverberant. No single number describes such a decay: report both windows together with the curvature, and treat the statistical predictions with suspicion, because their diffuse-field assumption has visibly failed.
- EDT far from T20/T30: EDT is fitted where the direct sound and the first reflections still dominate, so it varies from seat to seat while T30 barely moves. EDT below T30 means the position receives strong early energy (close to the source, under a reflector): the room sounds drier there than its T30 suggests, because perceived reverberance follows EDT. EDT above T30 at one seat points to an echo or a focusing surface concentrating late energy there.
The three cases are three shapes, and they are worth seeing side by side before you have to diagnose one.
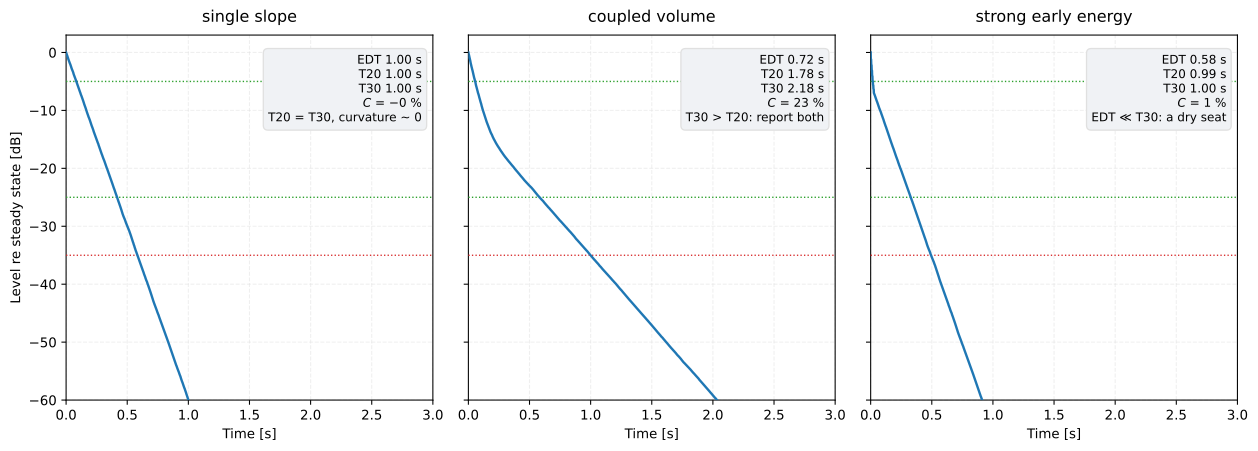
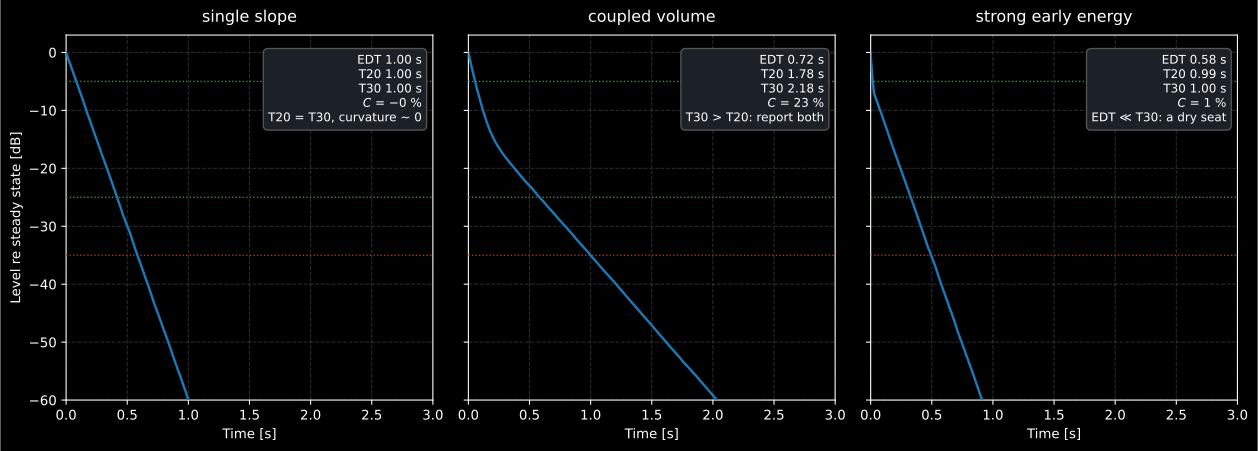
Three decays, one axis, all read by room_parameters. Left, a single
exponential at = 1.0 s: EDT, T20 and T30 all return 1.00 s and the curvature
is −0.1 %. Middle, a coupled volume: 98 % of the energy decaying at 0.6 s over
a 2.5 s tail, which puts a visible knee in the Schroeder curve and returns
EDT 0.72 s, T20 1.78 s, T30 2.18 s and a curvature of 23 %: no single number
describes it. Right, the same 1.0 s tail preceded by a cluster of strong early
reflections in the first 25 ms: T20 and T30 are untouched at 0.99 s and 1.00 s,
the curvature stays at 0.5 %, and EDT collapses to 0.58 s: the seat sounds
drier than its reverberation time says, and only EDT knows.
Show the code for this figure
import matplotlib.pyplot as plt# `np`, `fs` and `room` are the imports of the decay block above.
rng = np.random.default_rng(3382)span = np.arange(int(4.0 * fs)) / fs

def energy(t60):                       # the p^2 envelope of a T60 = t60 decay    return np.exp(-6.0 * np.log(10.0) / t60 * span)

noise = rng.standard_normal(span.size)tail = noise * np.sqrt(energy(1.0))
early = tail.copy()                    # a cluster of strong early reflectionsamplitude = np.sqrt(6.0 * float(np.sum(tail ** 2)) / 8.0)for k, i in enumerate(np.linspace(0, int(0.025 * fs), 8).astype(int)):    early[i] += amplitude * 0.85 ** k * (1.0 if k % 2 == 0 else -1.0)
cases = {    "single slope": tail,    "coupled volume": noise * np.sqrt(0.98 * energy(0.6) + 0.02 * energy(2.5)),    "strong early energy": early,}fig, axes = plt.subplots(1, 3, sharey=True, figsize=(13.0, 4.4))for ax, (name, signal) in zip(axes, cases.items()):    res = room.room_parameters(signal, fs, limits=None)    room.decay_curve(signal, fs).plot(ax=ax)    ax.set_title(f"{name}\nEDT {res.edt[0]:.2f}  T20 {res.t20[0]:.2f}  "                 f"T30 {res.t30[0]:.2f}  C {res.curvature[0]:.0f} %")plt.show()
How much decay range the noise floor allows
Section titled “How much decay range the noise floor allows”A fit window is only as good as
the decay range underneath it. The impulse-to-noise ratio (INR) is the
level distance between the peak of the band-filtered IR and its noise
floor; the fit window plus a safety margin must fit inside it, which is the
ISO 3382 requirement of at least 35 dB of usable decay range for T20 and
45 dB for T30. An undersized range biases the fitted time upward, toward
the flat tail the noise floor imposes on the decay curve, and the bias
grows quietly before the fit visibly fails (Hak, Wenmaekers, & van
Luxemburg, 2012). room_parameters reports that INR per band as
dynamic_range and tightens the acceptance limits to 46 dB (T20) and 54 dB
(T30) before
flagging a value valid, so the residual truncation-and-compensation bias of
a flagged-valid time stays inside 5 %: the relative JND Table A.1 tabulates
for EDT and the value customarily applied to T20 and T30, for which the table
gives none. When a band fails its flag,
the order of remedies is: use T20 instead of T30 (its window needs 10 dB
less range under the ISO minima, 8 dB under the tightened flags); raise the
INR at acquisition, since doubling the sweep length or
the number of synchronous averages buys 3 dB each time; and only then fall
back to EDT, never to a fit stretched into the noise.
Where the noise floor comes from, and how to lose it. The background level
is estimated from the last tenth of the onset-trimmed response, so the
recording must actually contain the room’s steady background after the decay
has finished (half a second or more of it). A file trimmed to the audible decay,
or a length= set to the decay alone, makes the analyser measure decaying
signal as if it were noise: the estimated floor sits too high, the truncation
point moves earlier, the compensated tail is computed from the wrong crossing,
and the per-band validity flags are applied to a fictitious dynamic range, all
without an error or a warning. Record silence after the excitation (the same
silence ISO 18233 6.2.2.3 asks for), keep it in the file, and let
room_parameters find the crossing rather than trimming to taste. The
diagnostic for the mistake: an implausibly large dynamic_range on a band that
should be noisy, together with a curvature near zero, is the signature of a
missing noise tail.
The whole budget fits in one drawing, and so does the bias it controls.
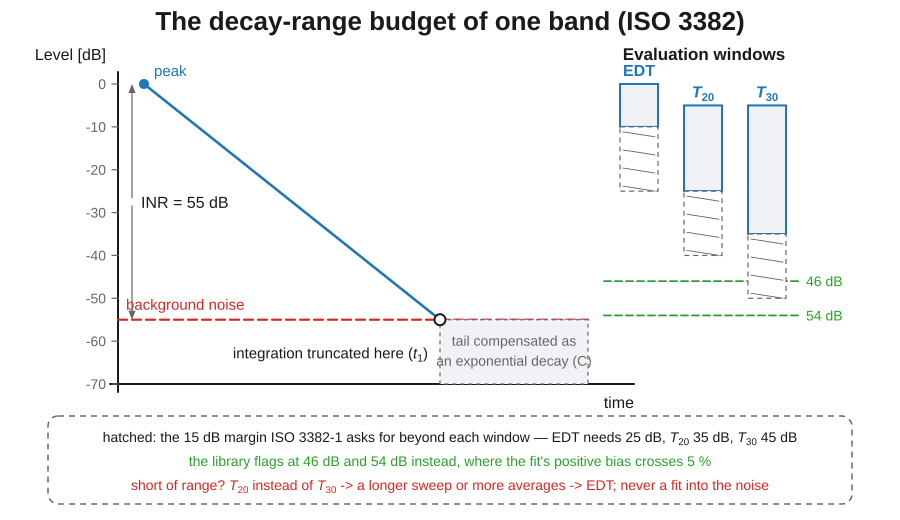
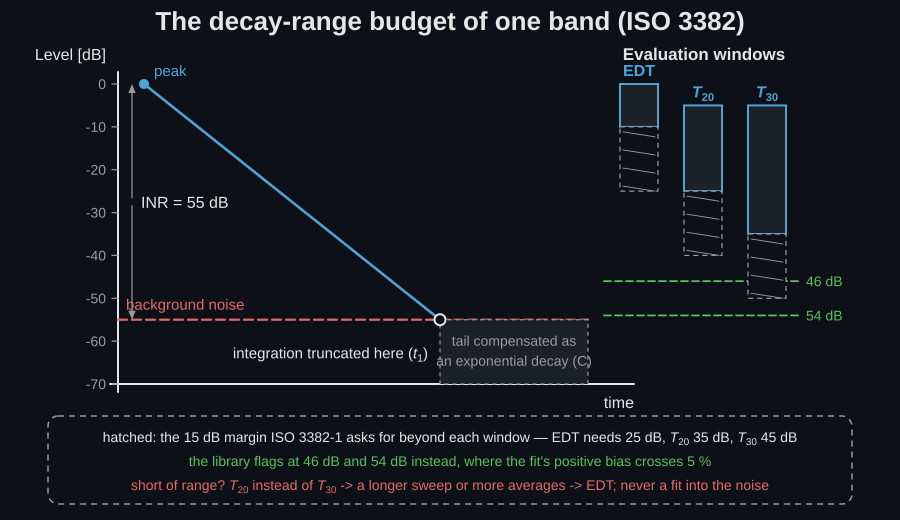
The level budget of one band. The INR is the whole vertical space you have; the evaluation window plus the 15 dB margin of ISO 3382-1 clause 5.3.3 has to fit inside it, which is where 35 dB (T20) and 45 dB (T30) come from. The integration stops where the fitted line crosses the background estimate, and the tail beyond is replaced by the exponential continuation of the fit, a compensation whose residual bias is positive, which is why phonometry adds a further 11 dB and 9 dB of headroom before it calls a band valid.
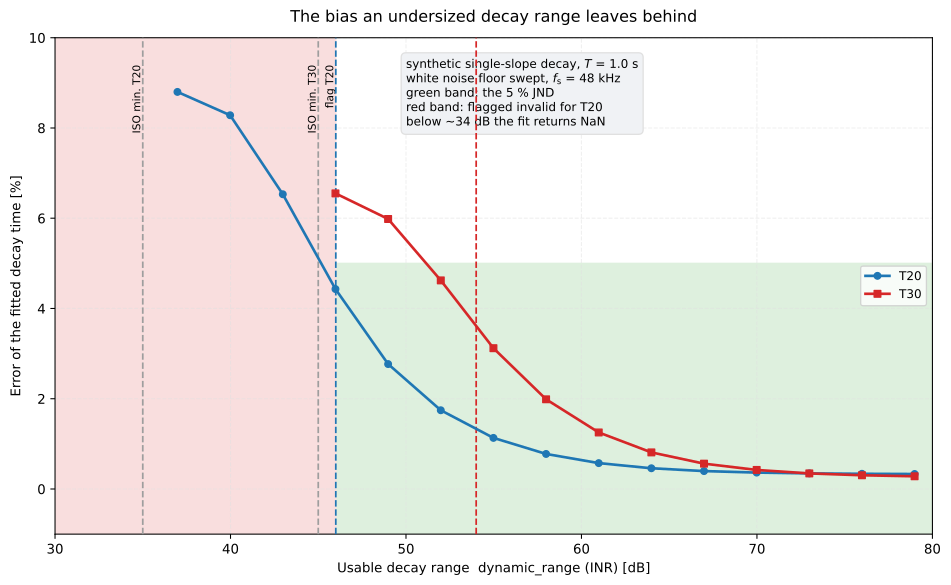
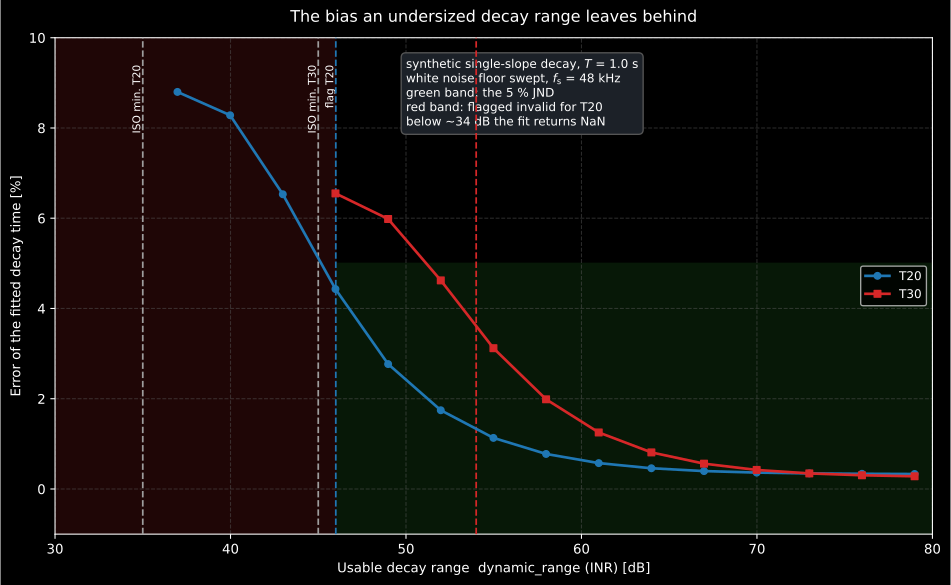
A synthetic = 1.0 s decay with its noise floor swept, measured with
room_parameters. The bias is always positive: the flat noise tail can
only make the fitted decay look longer, and it grows as the range shrinks:
+0.4 % at 70 dB, +1.3 % (T30) at 61 dB, +3.1 % at 55 dB, +6.6 % at 46 dB and
+8.8 % for T20 at 37 dB, just above the ISO minimum. That is the whole argument
for the tightened flags: at ISO’s own 35 dB and 45 dB minima the surviving bias
is already outside the 5 % JND, and only at 46 dB and 54 dB does it fall inside.
Below about 34 dB the fit does not converge at all and the parameters return
NaN, which is the visible failure the bias creeps up on.
Show the code for this figure
import matplotlib.pyplot as plt# `np`, `fs` and `room` are the imports of the decay block above.
rng = np.random.default_rng(3382)grid = np.arange(int(3.0 * fs)) / fsclean = rng.standard_normal(grid.size) * np.exp(-3.0 * np.log(10.0) * grid)noise = rng.standard_normal(grid.size)peak = float(np.max(np.abs(clean)))
ranges, bias20, bias30 = [], [], []for inr in range(25, 81, 3):    res = room.room_parameters(clean + noise * peak * 10 ** (-inr / 20.0),                               fs, limits=None)    ranges.append(float(res.dynamic_range[0]))    bias20.append(100.0 * (float(res.t20[0]) - 1.0))    bias30.append(100.0 * (float(res.t30[0]) - 1.0))
fig, ax = plt.subplots()ax.plot(ranges, bias20, "-o", label="T20")ax.plot(ranges, bias30, "-s", label="T30")ax.axhspan(-5.0, 5.0, alpha=0.15)for limit, name in ((35.0, "ISO T20"), (45.0, "ISO T30"),                    (46.0, "flag T20"), (54.0, "flag T30")):    ax.axvline(limit, ls=":", alpha=0.6)ax.set_xlabel("dynamic_range (INR) [dB]")ax.set_ylabel("Error of the fitted decay time [%]")ax.legend()plt.show()
Below the Schroeder frequency: modes, not decay
Section titled “Below the Schroeder frequency: modes, not decay”Below the Schroeder frequency ( in m³, in s) these decay statistics stop telling the whole story: the field is ruled by discrete room modes. The constant is not a physical one. Each mode damped to a reverberation time has a half-power bandwidth of about hertz, the modal density grows as , and requiring roughly three modes inside one bandwidth gives : a choice of how much overlap counts as diffuse, which is why stricter texts quote 4000 for the same physics. The transition is soft, so a band straddling should be checked position by position rather than trusted, and the mode ladder of the image-sources guide enumerates what is actually down there. The simulation below drives the same rigid 5 m by 3.5 m room at its (2,1) mode and then between two modes; on resonance a standing-wave pattern with fixed nodal lines grows until it dominates the RMS pressure map, off resonance the room still responds, but the forced field stays weak and never organises into that (2,1) nodal pattern.
A 2D FDTD simulation of a rigid 5 by 3.5 metre room driven at the 84 Hz (2,1) mode and at an off-mode frequency side by side. On resonance a standing-wave pattern with fixed nodal lines grows until it dominates the RMS pressure map; off resonance the forced response stays weak and never organises into that nodal structure.
A 2D FDTD simulation of a rigid 5 by 3.5 metre room driven at the 84 Hz (2,1) mode and at an off-mode frequency side by side. On resonance a standing-wave pattern with fixed nodal lines grows until it dominates the RMS pressure map; off resonance the forced response stays weak and never organises into that nodal structure.
room_parameters() parameters
Section titled “room_parameters() parameters”| Parameter | Type | Units | Range / default | Notes |
|---|---|---|---|---|
ir | 1D array | any | non-silent | Measured impulse response |
fs | int | Hz | > 0 | Sample rate |
limits | (float, float) or None | Hz | default (125.0, 4000.0) | Band-centre limits; None = broadband single band |
fraction | int | — | 1 (octave, default) / 3 (third) | Bandwidth fraction |
zero_phase | bool | — | default False | Forward-backward octave filtering (ISO 3382-2 §7.3 NOTE, which relaxes to ); removes the filter group delay before the backward integration and roughly halves the 125 Hz short-decay T30 bias (~+4.9 % → +2.4 % at = 0.2 s). decay_curve accepts it too |
is the bandwidth-time product: the bandwidth of the analysis band in hertz and the reverberation time in that band, in seconds. The two symbols in that cell are not the same as the filter’s: ” = 0.2 s” means the reverberation time. The 125 Hz octave is about 88 Hz wide, so a 0.2 s decay gives and only just clears the ISO 3382-2 §7.3 threshold of 16; halve the decay or move to third octaves and it does not, which is the regime the NOTE’s relaxation exists for.
Returns a RoomAcousticsResult: frequencies (band centres, or None
broadband), edt/t20/t30 (s), c50/c80 (dB), d50, ts (s),
dynamic_range (dB, the per-band INR: band-filtered peak minus noise floor),
the edt_valid/t20_valid/t30_valid flags (ISO
3382-1 §5.3.3: noise ≥ 25 dB below the peak for EDT, tightened to 46 dB for
T20 and 54 dB for T30 so the tail-compensation bias of a flagged-valid value
stays within the 5 % JND) and curvature
% (values above 10 % flag a non-straight
decay). decay_curve(ir, fs, band=None, fraction=1, zero_phase=False) returns
just the (time, level) curve for one band or the broadband response.
Averaging over positions
Section titled “Averaging over positions”Everything above analyses one impulse response; a reported room parameter is
never one impulse response. ISO 3382-2 clause 8 gives two admissible procedures,
and the one this API supports is the first: the arithmetic mean of the
individual reverberation times over all independent source-microphone
combinations (the alternative, ensemble-averaging the decay curves themselves
with their beginnings synchronised, is a different operation and is not what
averaging t30 does). Four rules travel with it. The standard deviation across
positions is part of the answer, not a diagnostic afterthought, and should be
quoted whenever it exceeds the parameter’s JND. , the customary
single-number room descriptor, is the mean of the 500 Hz and 1 kHz octaves. The
energy parameters vary far more between seats than T30 does, so their spread is
the interesting number rather than a nuisance. And a band that fails its
validity flag at some positions must not be quietly averaged in: mask it, and
say how many positions survived.
# `np`, `fs` and `room` are the imports of the decay block above.
# measured: one impulse response per source-microphone combination. Three# synthetic decays of 0.95, 1.00 and 1.08 s stand in for three positions.rng = np.random.default_rng(3382)grid = np.arange(int(3.0 * fs)) / fsresponses = [rng.standard_normal(grid.size) * np.exp(-3.0 * np.log(10.0) / t60 * grid)             for t60 in (0.95, 1.00, 1.08)]
results = [room.room_parameters(each, fs) for each in responses]t30 = np.array([res.t30 for res in results])valid = np.array([res.t30_valid for res in results])
mean = np.nanmean(np.where(valid, t30, np.nan), axis=0)spread = np.nanstd(np.where(valid, t30, np.nan), axis=0)print(np.round(mean, 2))                  # [0.99 1.   1.02 1.02 1.03 1.01] sprint(np.round(100.0 * spread / mean, 1))  # [4.  4.7 4.8 5.1 4.9 4.8] %print(int(valid.sum(axis=0).min()))        # 3 positions survived the flag
Here the spread runs 4 to 5 %, right at the JND, so it belongs in the report
beside the mean: three positions that agree to 5 % are three positions that
disagree audibly. Note also what the mask is for: np.nanmean over the masked
array is the arithmetic mean clause 8 a) prescribes, but only over the
combinations whose band actually passed, and the surviving count is part of the
result.
ISO 3382 report (.report())
Section titled “ISO 3382 report (.report())”RoomAcousticsResult.report(path) renders a one-page PDF fiche laid out like a
room-acoustics measurement report (a performance space per ISO 3382-1:2009 or
an ordinary room per ISO 3382-2:2008, both evaluated by the integrated
impulse-response method): a standard-basis line, an optional metadata header
block, the full-width per-band parameter table (, , EDT,
, , , ) above the result’s own per-band
decay-time plot (.plot()), the boxed mid-frequency reverberation time
(the mean of the 500 Hz and 1000 Hz octave , the
customary room descriptor) with the mid-frequency EDT alongside, and a footer
with the fixed disclaimer. ISO 3382-1/-2 are characterisation standards
with no intrinsic pass/fail, so a verdict row appears only when a target
reverberation time is supplied through the metadata’s requirement field
(ReportMetadata(requirement=...), read as the maximum acceptable value of
whichever descriptor the box carries, the usual form of a classroom or
open-plan limit). A broadband result has no 500 Hz / 1000 Hz octaves to
average, so its box and verdict fall back to the plain broadband with
no “500-1000 Hz” claim, and so do a band range that misses those two octaves
and one that reaches them with a non-evaluable in either, which fall
back to the first band whose could be evaluated. It uses the same
ReportMetadata container and rendering engine as the ISO 11654 absorption
fiche;
the room-specific fields room_volume, source_positions and
receiver_positions populate the header (ISO 3382 requires the room volume and
the number of source and microphone positions to be reported), alongside
test_room (the room name), specimen (the room description and occupancy
state), area, instrumentation, temperature_c,
relative_humidity_percent, static_pressure_kpa, measurement_standard,
test_date, laboratory, operator, report_id and notes. Passing
metadata=None produces a bare characterisation fiche. Rendering needs
reportlab and, for the figure the fiche embeds, matplotlib (pip install "phonometry[report,plot]"); only engine="reportlab" is supported. The fiche
renders in English by default; pass language="es" for a Spanish fiche
(translated fixed strings and a comma decimal separator).
from phonometry import room, ReportMetadata
result = room.room_parameters(ir, fs)   # octave bands 125 Hz - 4 kHzresult.report(    "room_fiche.pdf",    metadata=ReportMetadata(        # The room condition clause 9.2 e) asks for: furnishing state and the        # number of persons present (clause 4.1 allows at most two to stand in        # for the unoccupied state).        specimen="Small auditorium, fully furnished, unoccupied (1 operator present)",        test_room="Auditorium A",        room_volume=2830.0, area=340.0,        source_positions=2, receiver_positions=8,        # Clause 9.2 i) requires the accuracy grade to be stated.        measurement_standard="ISO 3382-2 (engineering grade)",        temperature_c=21.0, relative_humidity_percent=45.0,        laboratory="Phonometry Reference Laboratory",        notes="16 source-microphone combinations, 2 decays each; "              "positions and heights on the attached scaled plan",        requirement=1.3,           # adds a verdict against a target T_mid    ),)                                  # T_mid + the per-band parameter table
Three of those entries are there because ISO 3382-2 clause 9.2 asks for them and
the fiche has no dedicated field for any of them. Clause 9.2 i) requires the
degree of precision (survey, engineering or precision), so it belongs in
measurement_standard rather than being left implied. Clause 9.2 e) requires
the condition of the room, furnishing and the number of persons present, and
clause 4.1 fixes what “unoccupied” may mean: no people, or at most two allowed
to stand in for the unoccupied state unless otherwise specified; that goes in
specimen. And clause 9.2 c) and i) together require a scaled sketch plan
carrying the source and microphone positions with their heights, which the fiche
does not draw: produce it alongside and reference it, as notes does here.
Clause 9.2 f) adds the temperature and relative humidity for the precision
method only, which the climate fields already carry.
The example fiche is regenerated with make reports and kept rendered in the
repository; click the preview to open the PDF.
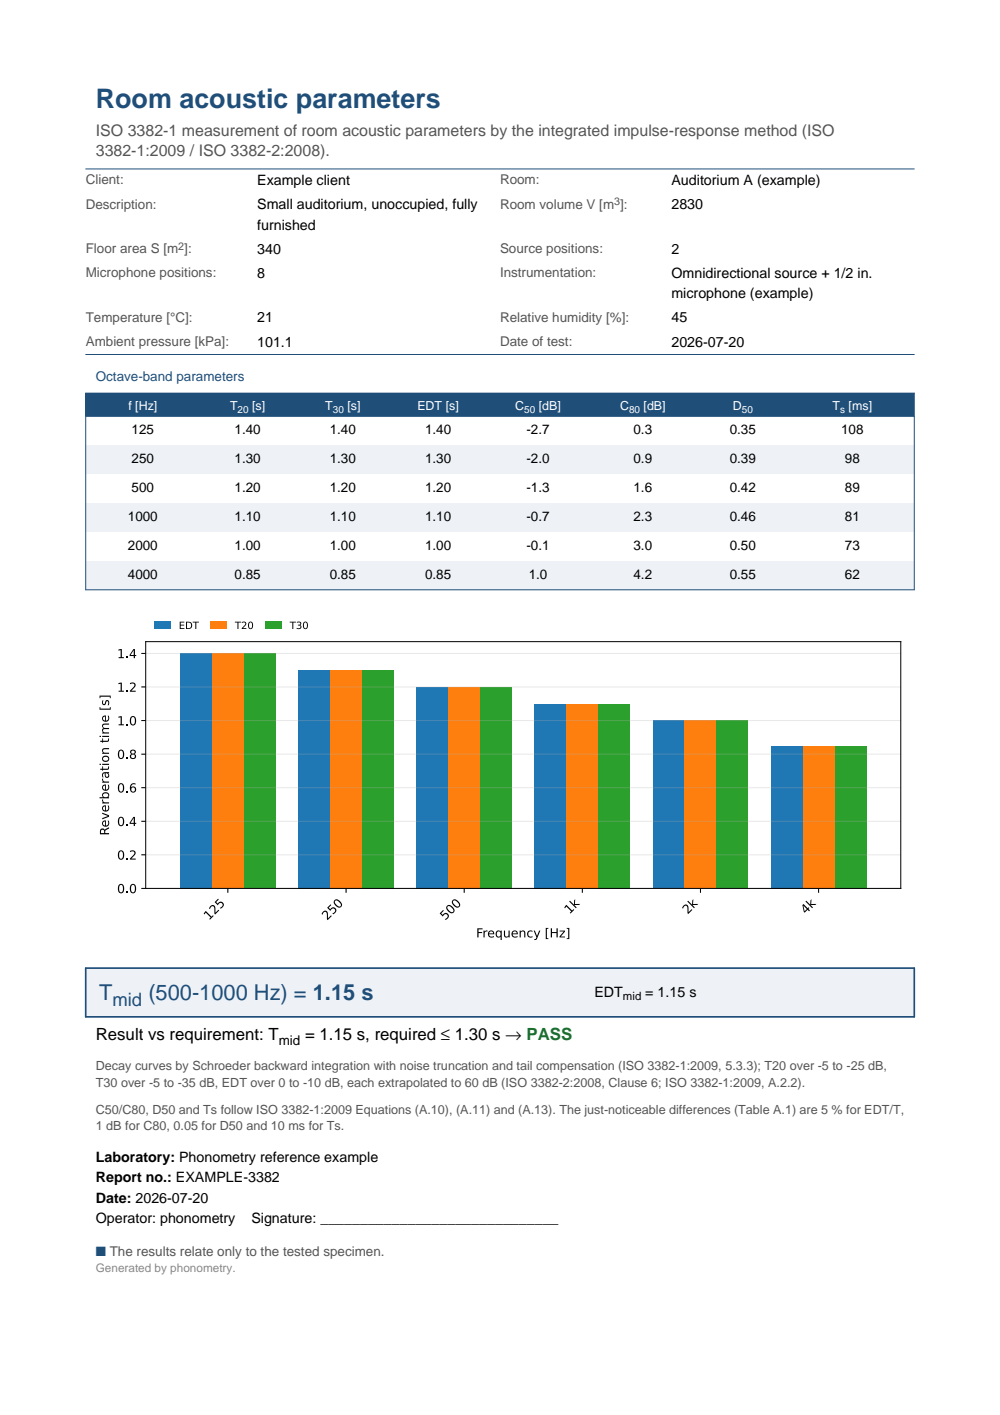
One-page room-acoustics fiche: a metadata header (client, room, description, room volume, floor area, source and microphone positions, instrumentation, temperature, humidity and pressure), the octave-band parameter table (T20, T30, EDT, C50, C80, D50 and Ts from 125 Hz to 4 kHz) above the per-band decay-time bar plot, the boxed mid-frequency reverberation time T_mid = 1.15 s with the mid-frequency EDT alongside, and a PASS verdict against the 1.3 s target.
With the parameters in hand, the two neighbouring links in the chain are the acquisition that produced the impulse response (Measuring the Room Impulse Response) and, for an open-plan floor rather than a closed room, the ISO 3382-3 line of workstations (Open-Plan Office Acoustics).
What this guide covers
Section titled “What this guide covers”Covered
ISO 3382-1:2009 (clause 5.3.3 backward integration and the Annex A parameter formulae) and ISO 3382-2:2008 (Clause 6 and the 5.3.3 dynamic-range criterion), computed by
room.room_parameters/room.decay_curve: EDT, T20, T30, C50, C80, D50, Ts and the per-band validity and curvature flags, with the optional zero-phase band filtering of the ISO 3382-2 §7.3 NOTE, and the one-page ISO 3382 fiche through.report().Not covered
ISO 3382-1 Annex A also defines the sound-strength and the binaural parameters LF/LFC and IACC; phonometry implements only the reverberance and clarity family named above (EDT, T20, T30, C50, C80, D50, Ts). The acquisition of the impulse response (ISO 18233) and the open-plan quantities (ISO 3382-3) have guides of their own, Measuring the Room Impulse Response and Open-Plan Office Acoustics. The ISO 354 reverberation-room absorption that consumes the measured / pair lives in Sound Absorption Measurement and Rating.
Quick answers
Section titled “Quick answers”How are EDT, T20 and T30 defined?
Section titled “How are EDT, T20 and T30 defined?”Each band of the impulse response is turned into a decay curve by Schroeder backward integration of the squared IR, and a least-squares line fitted over an evaluation range is extrapolated to a full 60 dB drop, (ISO 3382-1/2): EDT over 0 to −10 dB (perceived reverberance), T20 over −5 to −25 dB and T30 over −5 to −35 dB.
How much decay range do I need for a valid T20 or T30?
Section titled “How much decay range do I need for a valid T20 or T30?”The fit window plus a safety margin must fit inside the impulse-to-noise ratio (res.dynamic_range), the level distance between the band-filtered IR peak and its noise floor: ISO 3382 requires at least 35 dB of usable decay range for T20 and 45 dB for T30. An undersized range biases the fitted time upward, so room_parameters tightens its validity flags to 46 dB and 54 dB, keeping the bias inside the 5 % JND. The noise floor is estimated from the last tenth of the response, so the recording must contain silence after the decay.
References
Section titled “References”- Hak, C. C. J. M., Wenmaekers, R. H. C., & van Luxemburg, L. C. J. (2012). Measuring room impulse responses: Impact of the decay range on derived room acoustic parameters. Acta Acustica united with Acustica, 98(6), 907-915. https://doi.org/10.3813/aaa.918574The INR analysis behind the dynamic-range discussion and the tightened validity flags of this page.
- International Organization for Standardization. (2008). Acoustics — Measurement of room acoustic parameters — Part 2: Reverberation time in ordinary rooms (ISO 3382-2:2008). The accuracy grades and the dynamic-range criterion behind the decay analysis; its position rules are applied in the room-impulse-response guide.
- International Organization for Standardization. (2009). Acoustics — Measurement of room acoustic parameters — Part 1: Performance spaces (ISO 3382-1:2009). The parameter definitions and just-noticeable differences behind the decay analysis.
- Kuttruff, H. (2016). Room acoustics (6th ed.). CRC Press. https://doi.org/10.1201/9781315372150The reference monograph behind this page: the statistical theory of decaying sound fields, the Schroeder frequency and the perceptual room parameters of this page.
- Schroeder, M. R. (1965). New method of measuring reverberation time. The Journal of the Acoustical Society of America, 37(3), 409-412. https://doi.org/10.1121/1.1909343The backward-integration method that turns the squared impulse response into the smooth decay curve of this page.