A reverberation time says what a room does to a decay in time. It says very little about what a factory hall does to a worker standing 20 m from a press. The question there is a question about distance: how much quieter does it get as you walk away, and how much louder is it than open air would be?
ISO 14257 answers both with one measurement. A calibrated source stands where a machine would, a microphone walks away from it along a straight path, and the curve of level against distance is the room’s own signature.
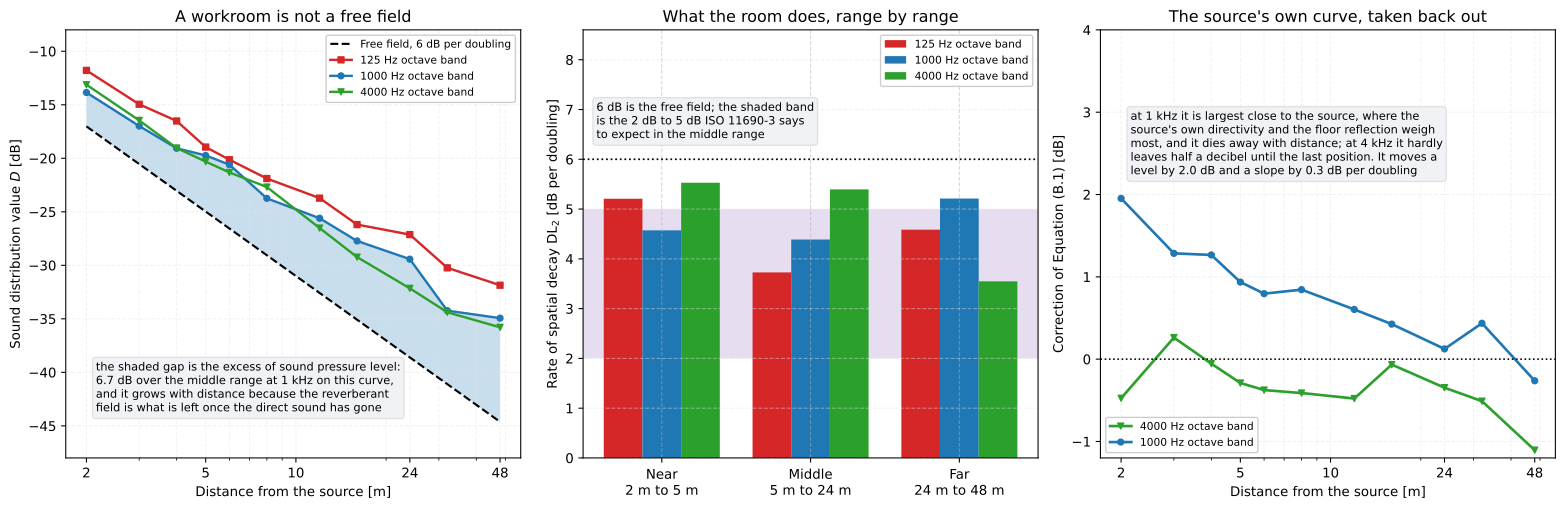
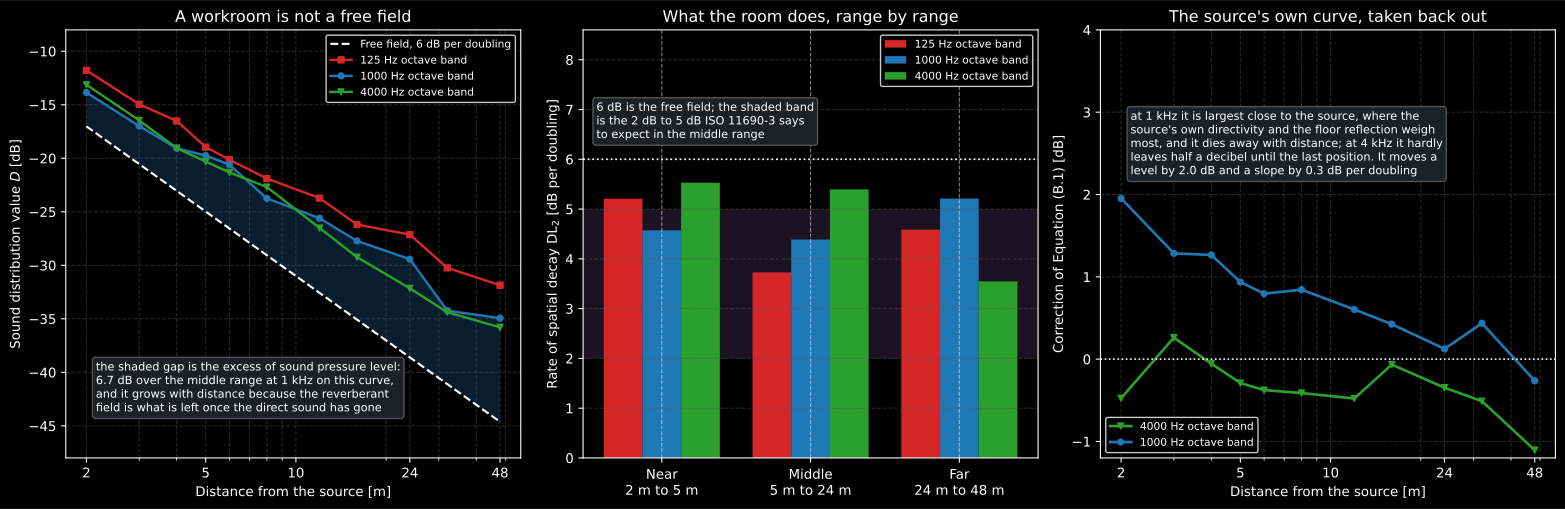
The curve, what it yields range by range, and the correction that takes the source’s own directivity back out. The data is the shipyard hall of Annex C.
1. The curve: a level referred to the power that made it
Section titled “1. The curve: a level referred to the power that made it”A level on its own cannot be compared between two rooms, because it depends on how loud the source was. ISO 14257 therefore works with the sound distribution value, Equation (1): the level at a position, less the sound power level of the source that produced it.
In a free field that quantity is known exactly. A point source over a reflecting plane gives Equation (2), which is the line every measured curve is read against:
with m. The 11 dB is , rounded.
from phonometry import room
distances = [2.0, 3.0, 4.0, 5.0, 6.0, 8.0, 12.0, 16.0, 24.0, 32.0, 48.0]levels = [98.9, 95.1, 93.0, 92.0, 91.0, 87.9, 85.8, 83.5, 81.5, 77.0, 75.6]
d = room.sound_distribution_value(levels, 110.8)print(d[:3].round(1))                                       # [-11.9 -15.7 -17.8]print(room.reference_distribution_value([2.0, 4.0]).round(2))  # [-17.02 -23.04]
At 2 m the measured curve is already 5 dB above the free field, and the gap grows with distance: that is the room, holding the level up long after the direct sound has fallen away.
2. Two descriptors, and what each of them is for
Section titled “2. Two descriptors, and what each of them is for”Clause 6 reads two numbers off the curve, over a stated distance range.
DL2, the rate of spatial decay per distance doubling, Equation (5), is the slope: the least-squares fit of against , converted from a decade to a doubling and signed so that a decay is positive. A free field gives 6 dB. Any room gives less, and how much less is the useful number.
DLf, the excess over a free field, Equations (6) to (8), is the height: how far above open air the room sits. It is what tells a designer that a hall is 10 dB noisier than it needs to be at the far workstations.
res = room.spatial_decay_curve(d, distances, region="middle", far_limit_m=24.0)print(round(res.decay_rate_db, 2)) # 4.73 dB per doublingprint(round(res.mean_excess_db, 2)) # 7.33 dBprint(res.region) # middleThe two answer different design questions and they do not substitute for each other. A room can decay steeply and still be loud, and a room with a healthy absorbed ceiling can be quiet at the near workstations and decay hardly at all past them.
The distance ranges are 6.2: near from 1 m to , middle from
to , far beyond , with 5 m and 16 m the typical pair. The middle
region is the one occupational work reads, and the clause asks for it to reach
24 m whenever the room is big enough, which is what far_limit_m above does.
print(room.distance_region(12.0)) # middleprint(room.typical_decay_range("middle")) # (2.0, 5.0)print(room.typical_excess_range("middle"))# (2.0, 10.0)Those last two ranges are ISO 11690-3, 4.3: what a workroom usually gives. A middle-range DL2 of 4,7 dB per doubling and an excess of 7,3 dB put this hall inside both.
3. Where the numbers come from
Section titled “3. Where the numbers come from”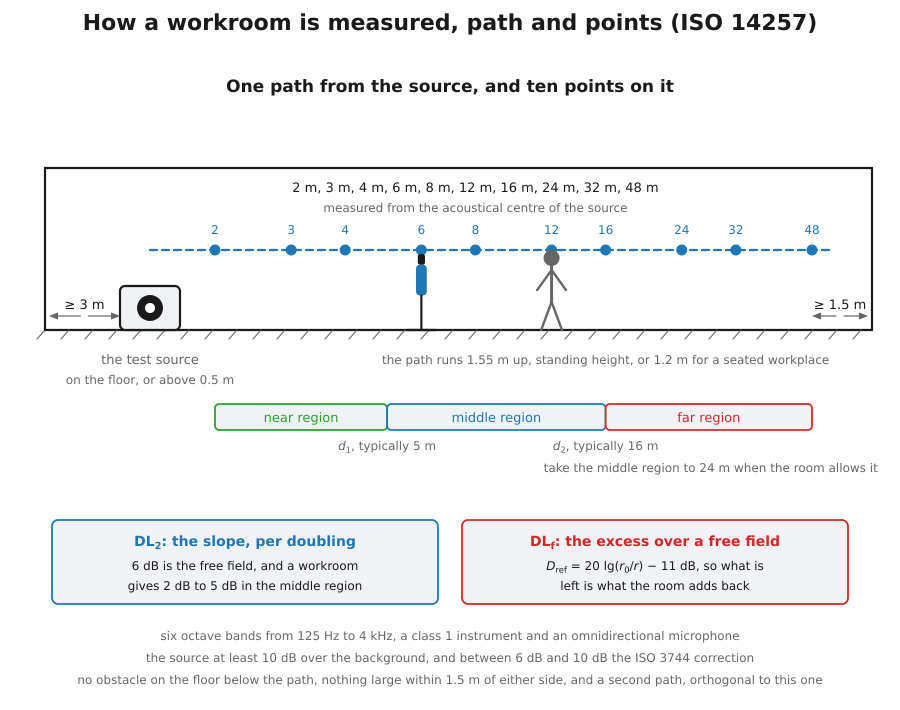
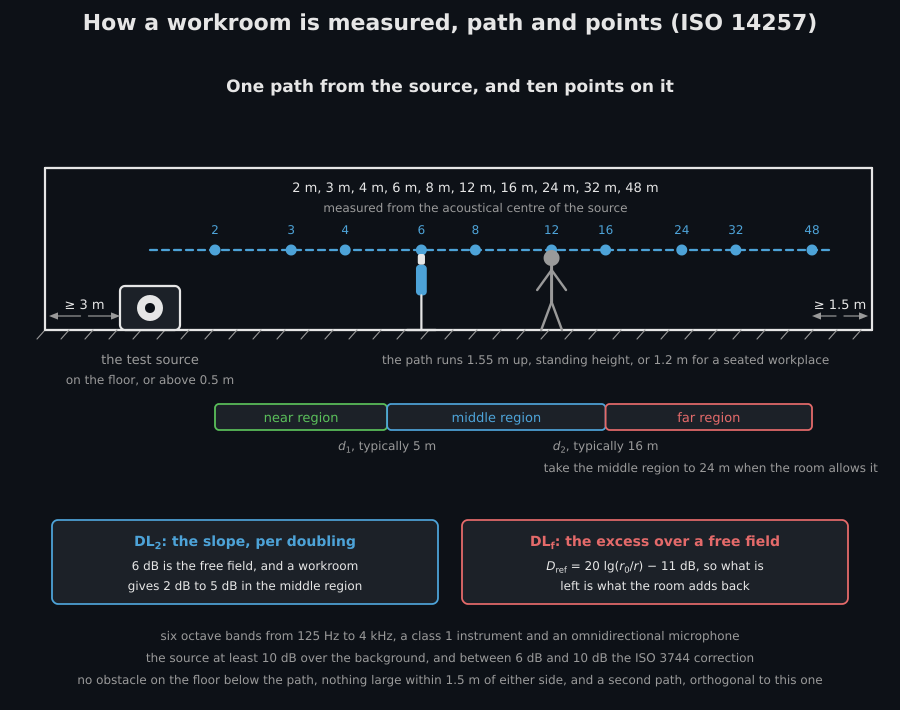
The path is 5.3.1: parallel to the floor, beginning on the source, at 1,55 m for a standing workplace or 1,2 m for a seated one, with no obstacle on the floor below it and nothing large within 1,5 m of either side. The points are one of the two distributions 5.3.2 recommends, and the one used here is the logarithmic one, which is what makes a least-squares fit against sensible in the first place.
How the measurement goes
Section titled “How the measurement goes”Put the source where a machine would stand, with its acoustical centre either on the floor or at least 0,5 m above it, and at least 3 m from any wall or other reflecting object. Run it and check the margin over the background at every position and in every one of the six octave bands from 125 Hz to 4 kHz: 10 dB or more needs no correction, between 6 dB and 10 dB takes the ISO 3744 correction, and under 6 dB there is no measurement to make. Walk the path from the source outwards, taking a band spectrum at each of the recommended distances, measured from the acoustical centre rather than from the cabinet. Stop the last point at least 1,5 m short of any wall. Then, if the room allows it, walk a second path at right angles to the first: one path describes a direction, and two describe a room. Record the path height, the source position, and any obstacle you could not avoid, because the report is what makes the curve reproducible.
The margin is a judgement the library will make for you, one octave band at a time, and it says which of the three cases each position falls in rather than correcting anything: the correction 5.1.4 asks for between 6 dB and 10 dB is the one ISO 3744 prints, and applying it here would move a measured level behind your back.
check = room.check_background_margin([80.0, 70.0, 66.0], 60.0)print(check.margins_db) # [20. 10. 6.]print(check.unusable) # [False False True]print(check.satisfied) # FalseTwo other conditions are read where they can be seen rather than asked about. A
region that holds exactly the two positions a regression needs gives a rate that
is the line through them, with nothing left over to check either position
against, and 5.3.2 calls the count of its recommended distributions a minimum.
And level_excess_at reading the fitted line outside the distances it was
fitted over is an extrapolation, which is what the 30 m of 6.4.3 asks of a path
that stopped at 24 m. Both emit SpatialDecayWarning, so a result that came
out of one of them says so.
The source itself has to qualify first. Annex A asks for more than ISO 6926: its directivity index must stay inside ± 2 dB up to 630 Hz, rising to ± 8 dB at 1 kHz and holding there to 5 kHz, its spectrum may not step more than 8 dB between adjacent one-third octaves, and its output must be stable to 0,5 dB over the measurement.
print(room.omnidirectionality_tolerance_db(630.0)) # 2.0print(room.omnidirectionality_tolerance_db(800.0)) # 5.0print(room.omnidirectionality_tolerance_db(1000.0)) # 8.0The 800 Hz value is a reading rather than a quotation: the clause says the tolerance rises “linearly” between 630 Hz and 1 kHz without saying linear in what, and the band index is the only reading on which both endpoints land on printed bands.
4. Taking the source’s own curve back out
Section titled “4. Taking the source’s own curve back out”Close to the source, a good part of what the microphone hears is not the room: it is the source’s own directivity and the reflection off the floor under it. Annex B removes both. It measures the same source over a reflecting plane outdoors or in a large room, then swaps that measured curve for the theoretical one of Equations (B.2) to (B.4):
which for a source on the floor becomes the flat 3 dB of a half space. Equation (B.1) then does the swap in energy.
free_field = [98.8, 94.7, 92.3, 90.3, 88.7, 86.1, 82.6, 79.8, 75.7, 73.7, 67.8]reference = room.sound_distribution_value(free_field, 110.8)corrected = room.corrected_distribution_value(d, reference, distances)
fixed = room.spatial_decay_curve(corrected, distances, region="middle", far_limit_m=24.0)print(round(fixed.decay_rate_db, 2))    # 4.39 dB per doublingprint(round(fixed.mean_excess_db, 2))   # 6.73 dB
The correction moves the slope by 0,3 dB per doubling and the level by 0,6 dB, which is the general shape of it: it tilts a curve a little and shifts it a lot, because it is largest where the measurement starts.
That difference is also how the library found an error in the annex. Annex C prints 4,4 dB per doubling for this band and range, which is the corrected figure, and 7,3 dB of excess, which is the uncorrected one. Applying the correction to one descriptor and not to the other cannot be right, and 28 of the 36 printed results in the annex leave their own rounding if the two are swapped. The registry entry is in Errata.
5. One number for six bands
Section titled “5. One number for six bands”Six octave bands are six numbers, and a report often wants one. Equation (3) weights the curve by the spectrum of the machine that will actually stand there, and Equation (4) fixes that spectrum as A-weighted pink noise, Table 1, so that two rooms can be compared without a machine in mind.
by_band = [-11.9, -13.6, -12.5, -11.9, -12.4, -13.6] # 125 Hz to 4 kHzprint(round(room.normalized_distribution_value(by_band), 2)) # -12.58Clause 4.2.3 says why the fixed spectrum is a normalisation and not an average machine: the spectra met in industry are too varied for an average of them to mean anything.
6. From measurement to design
Section titled “6. From measurement to design”ISO 11690-3 is the other half of the subject: predicting, before the hall is built, the curve ISO 14257 would measure in it. It sorts the ways of doing that into four categories, one diffuse-field and three geometrical, and pairs each with the level of detail it has to be fed.
print(room.prediction_method("2b").family)          # geometricalprint(room.ROOM_DETAIL_LEVELS[1])# the volume and the mean absorption coefficient of the surfaces
print(room.detail_is_sufficient("1", room_detail=3,                                fitting_detail=3, source_detail=1).satisfied)   # Falseprint(room.detail_is_sufficient("2b", room_detail=3,                                fitting_detail=3, source_detail=1).satisfied)   # True
Table E.1 reads in both directions, which is the useful part. A reader with nothing but a volume and one mean absorption coefficient is limited to the diffuse-field method, and a reader who wants to trace rays over the real shape of the room has to go and gather a description at that level of detail first.
The fittings are part of the room, and 6.2.2 measures them by density, , the surface of everything standing in the hall over four times its volume. Annex C then answers the narrower question of what the room adds at the workstation of the machine itself.
print(round(room.fitting_density(480.0, 1200.0), 2)) # 0.1print(round(room.workstation_level(sound_power_level_db=95.0, emission_level_db=85.0, absorption_area_m2=200.0), 2)) # 85.79print(round(room.total_workstation_level([86.0, 83.0, 80.0]), 2)) # 88.44The increase is , with the area the machine’s own emission implies. It is small in a well-absorbed hall and large in a bare one, and it is the term that turns a catalogue of quiet machines into a noisy workshop.
What this guide covers
Section titled “What this guide covers”Covered
- ISO 14257:2001: the sound distribution value of Equation (1) and the free-field reference of Equation (2); the single numbers of Equations (3) and (4) with the Table 1 weightings; the rate of spatial decay of Equation (5); the excess of Equations (6), (7) and (8) with the evaluation distances of 6.4.3; the distance ranges of 6.2; the source requirements of Annex A; the correction of Annex B, Equations (B.1) to (B.4); and the conditions of clause 5 as constants.
- ISO 11690-3:1998: the detail levels of Tables 1, 2 and 3; the four categories of Table 4 with the pairing of Table E.1; the typical ranges of 4.3; the fitting density of 6.2.2; and the workstation increase of Annex C.
- The worked example of Annex C of ISO 14257 is reproduced band by band in the conformance evidence.
Not covered
- Predicting the curve itself. ISO 11690-3 describes what a prediction method must model and how much detail it needs; it does not print one, and neither ray tracing nor a radiosity solver is implemented here.
- The reverberation-room calibration of the source, which is ISO 6926 and ISO 3741, and the directivity survey of Annex A, which needs a turntable rather than a formula.
- The full reporting checklist of clause 7, which is a list of what a report says rather than a quantity to compute.
References
Section titled “References”- International Organization for Standardization. (1998). Acoustics — Recommended practice for the design of low-noise workplaces containing machinery — Part 3: Sound propagation and noise prediction in workrooms (ISO 11690-3:1998). What to expect of the two descriptors (4.3), the four categories of prediction method of Table 4, the detail levels of Tables 1 to 3 with the pairing of Table E.1, and the workstation increase of Annex C.
- International Organization for Standardization. (2001). Acoustics — Measurement and parametric description of spatial sound distribution curves in workrooms for evaluation of their acoustical performance (ISO 14257:2001). The measurement and the two descriptors: the sound distribution value of Equation (1), the free-field reference of Equation (2), the single numbers of Equations (3) and (4), the rate of spatial decay of Equation (5), the excess of Equations (6) to (8), the distance ranges of 6.2, the source requirements of Annex A and the correction of Annex B. Read from BS EN ISO 14257:2001.
- International Organization for Standardization. (2010). Acoustics — Determination of sound power levels and sound energy levels of noise sources using sound pressure — Engineering methods for an essentially free field over a reflecting plane (ISO 3744:2010). The background-noise correction ISO 14257 calls for when the margin falls between 6 dB and 10 dB.
- International Organization for Standardization. (2012). Acoustics — Measurement of room acoustic parameters — Part 3: Open plan offices (ISO 3382-3:2012). The same idea for speech in an office: a line of positions, a rate of spatial decay, and a level at a fixed distance.
- International Organization for Standardization. (2016). Acoustics — Determination of sound power levels of noise sources — Requirements for the performance and calibration of reference sound sources (ISO 6926:2016). The calibration of the source, which Annex A of ISO 14257 then tightens for directivity and stability.