Laboratory Insulation Measurement
Standards: ISO 10140Key references: Hopkins 2007Vigran 2008
To rate a building element on its own (a wall type, a floating floor, a window) you take it to a qualified laboratory, where suppressed flanking makes the direct transmission the whole story. This page covers the ISO 10140 laboratory chain: the sound reduction index , the normalized impact level , the background-noise correction and the accredited test fiches. Three sibling laboratory methods have guides of their own: Sound Insulation by Intensity (ISO 15186), Floor-Covering Impact Improvement (ISO 16251-1) and Laboratory Flanking Transmission (ISO 10848). Field measurement lives in Field Insulation Measurement (ISO 16283), the single-number ratings in Insulation Ratings (ISO 717), and the prediction that consumes these laboratory ratings in Predicting Sound Insulation (EN 12354).
Laboratory measurement (ISO 10140)
Section titled “Laboratory measurement (ISO 10140)”What the laboratory buys is comparability. Once flanking is suppressed the primes disappear, and with them the dependence on the particular pair of rooms the element happened to be built into: the receiving room’s absorption area becomes a known property of the facility rather than a quantity of the building, so the same wall measured in Madrid and in Munich should produce the same number. That is what makes a catalogue possible, and it is why every prediction on this site takes laboratory and as its input. Nothing else in building acoustics is transferable in that way. The two quantities are the sound reduction index (not ) and the normalized impact level (not ):
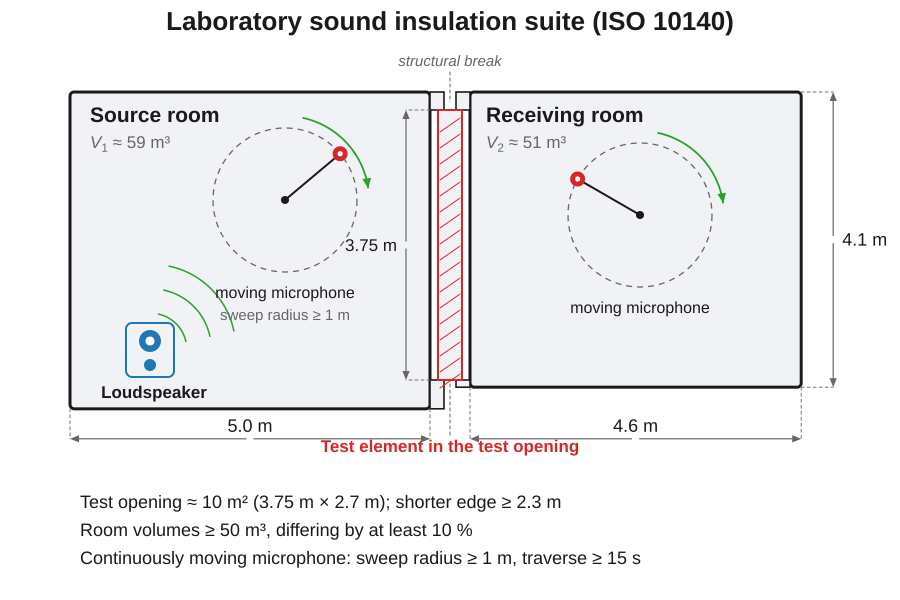
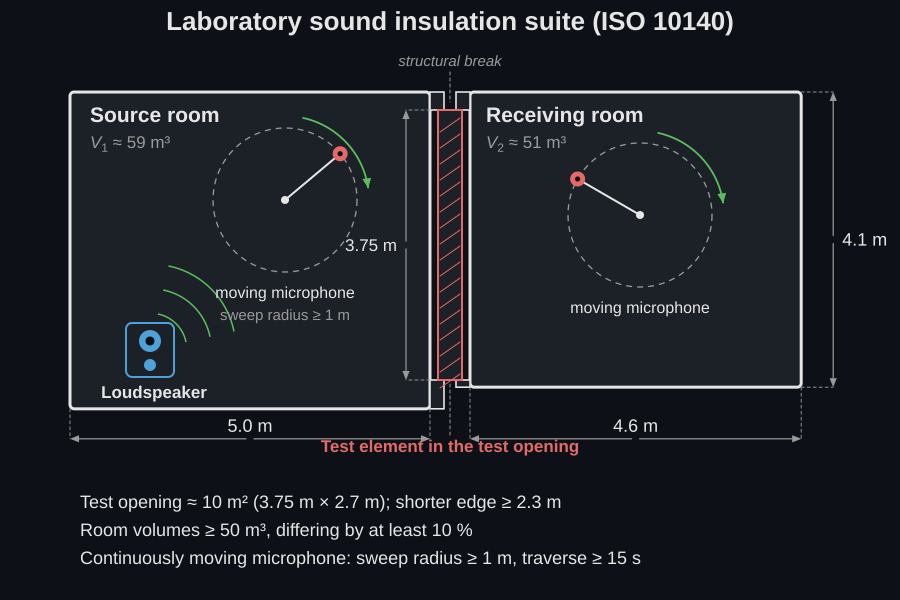
The facility itself is what suppresses the flanking: two structurally decoupled reverberation rooms of at least 50 m³ each, with the element under test mounted in a test opening of about 10 m² between them.
Suppression is never total, and the residual matters. Every suite has a maximum measurable sound reduction index , set by the indirect paths that survive and estimated by the normative Annex A of ISO 10140-5:2010; a specimen measured near that ceiling is reporting the facility rather than itself, which is why an accredited report states the suite’s curve alongside the result. Annex A qualifies it on representative constructions rather than in the abstract: six of them, from a twin-leaf lightweight partition to a (400 ± 40) kg/m² masonry wall with an independent lining. The values obtained apply only to the configurations tested. Its own illustrative table, for a suite able to measure type C walls and floors up to dB, runs from 45.0 dB at 100 Hz to 86.0 dB at 3150 Hz, and the standard says in as many words that these are examples and not targets. When a specimen is expected to run into that ceiling, the intensity route of Sound Insulation by Intensity (ISO 15186) reads the transmitted power off the radiating face instead and is the tool of choice when flanking is high, which is also, exactly, what the -modified intensity index exists to make comparable again.
| Field (ISO 16283) | Laboratory (ISO 10140) | |
|---|---|---|
| Airborne element index | apparent (with flanking) | direct (flanking suppressed) |
| Airborne room pair | , (no prime: room quantities) | — |
| Impact | , apparent | direct |
| Single number | , , , | , |
| Absorption area | measured in the room | property of the facility |
The apostrophe is the flanking marker of building acoustics, and it travels with the quantity into its single number: rates a laboratory spectrum, a field one. The standardized and normalized level differences and carry no prime because they describe the room pair rather than an element, so there is no flanking-free counterpart to mark. In a well-built construction lands a few dB below the laboratory of the same partition; a much larger gap says flanking dominates, and the EN 12354 model tells you which path carries it. The figure below shows all three curves for one wall.
The single-number ratings reuse the very same ISO 717-1/2 engines
(weighted_rating, weighted_impact_rating): an spectrum rates to
exactly as an spectrum rated to . Before forming the index the
receiving-room levels must be corrected for background noise (Clause 4.3):
the energy subtraction (Formula (4))
applies for a margin above 6 dB and below 15 dB, a fixed 1.3 dB correction (the
limit of measurement) at or below 6 dB, and no correction at or above 15 dB.
Those are the laboratory thresholds; ISO 16283-1 uses 6 dB and 10 dB in the
field, so the two rules are not interchangeable: see
Field Insulation Measurement.
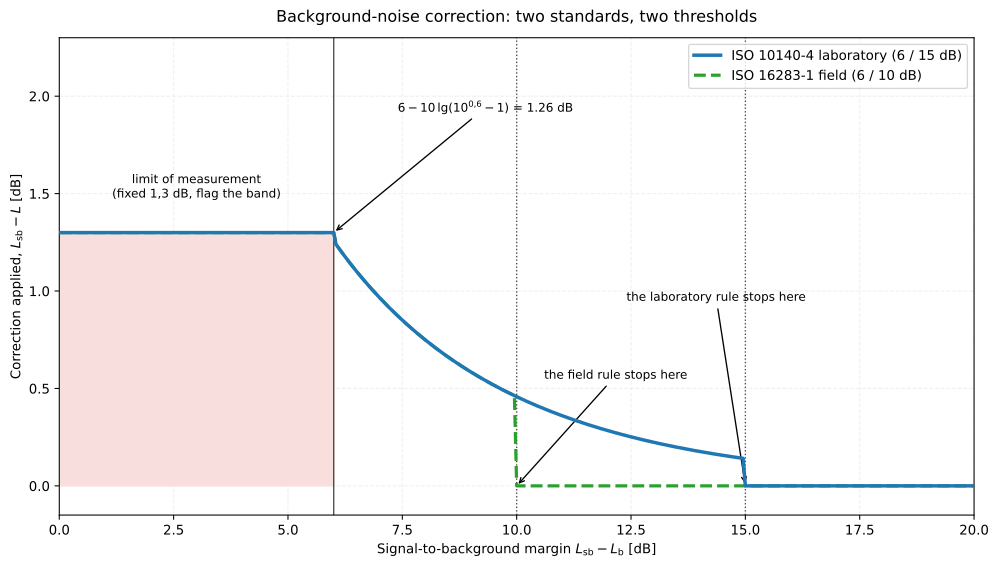
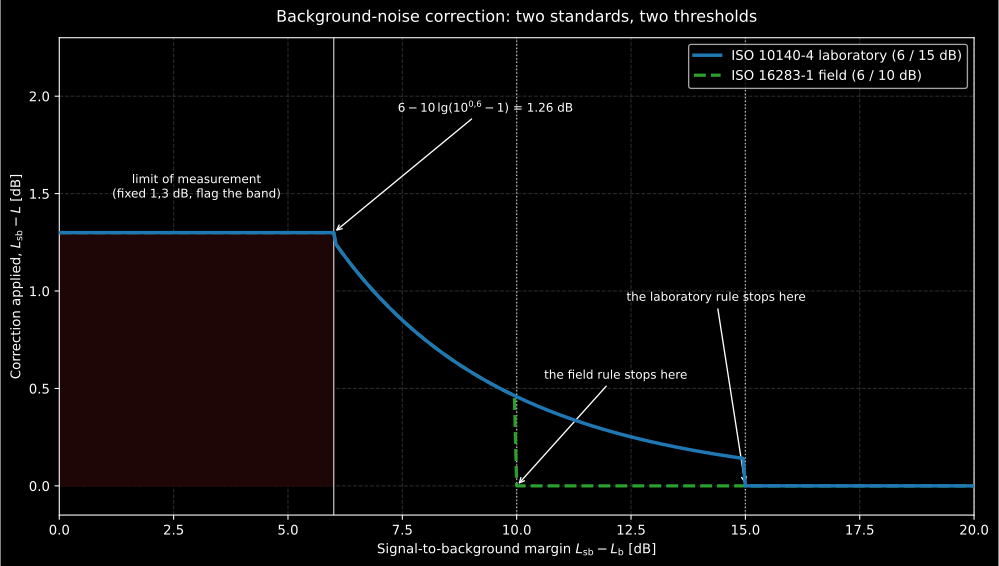
A three-branch rule with two thresholds, and the thresholds are not the same in the two standards. The 1.3 dB cap is not a magic constant: it is the value of the energy subtraction at exactly 6 dB of margin, dB, rounded up and frozen. Between 6 and 10 dB the two rules coincide: the dashed field curve is hidden under the laboratory one, and they part company above 10 dB, where the field standard stops correcting and the laboratory standard keeps going to 15 dB. Bands corrected by the cap are lower bounds on the insulation and must be flagged as the limit of measurement.
Show the code for this figure
import matplotlib.pyplot as pltimport numpy as np
margin = np.linspace(0.0, 20.0, 401)# The energy subtraction of Formula (4), written on the margin alone. It is# only ever used above 6 dB, where the logarithm is finite.with np.errstate(divide="ignore"):    formula = margin - 10 * np.log10(10 ** (margin / 10) - 1)cap = 1.3lab = np.where(margin <= 6, cap, np.where(margin < 15, formula, 0.0))field = np.where(margin <= 6, cap, np.where(margin < 10, formula, 0.0))print(round(float(formula[np.searchsorted(margin, 6.0)]), 2))   # 1.26
fig, ax = plt.subplots()ax.fill_between(margin, 0.0, cap, where=margin <= 6, alpha=0.25)ax.plot(margin, lab, label="ISO 10140-4 laboratory (6 / 15 dB)")ax.plot(margin, field, "--", label="ISO 16283-1 field (6 / 10 dB)")ax.set(xlabel="Signal-to-background margin Lsb - Lb [dB]",       ylabel="Correction applied, Lsb - L [dB]", ylim=(-0.15, 2.3))ax.legend()plt.show()
import numpy as npfrom phonometry import building
# The ISO 717-1 Annex C wall in an ISO 10140 suite: source-room level, the# receiving-room level it produces, and the receiving-room T, over the 16# one-third-octave bands. S = 10 m2 is the free test opening, V = 50 m3.r_annex_c = np.array([20.4, 16.3, 17.7, 22.6, 22.4, 22.7, 24.8, 26.6, 28.0, 30.5, 31.8, 32.5, 33.4, 33.0, 31.0, 25.5])l1 = np.full(16, 90.0)t2 = np.full(16, 0.8)lab = building.lab_airborne_insulation(l1, l1 - r_annex_c, t2, area=10.0, volume=50.0)print(round(float(lab.absorption[0]), 1)) # 10.0 A = 0.16 V / T (m^2)print(round(float(lab.r[0]), 1)) # 20.4 R = L1 - L2 + 10 lg(S/A)print(lab.rating.rating, lab.rating.c, lab.rating.ctr) # 30 -2 -3 Rw(C;Ctr)
# Impact: the tapping-machine level Li normalized to A0 = 10 m^2 gives Lnli = np.array([62.1, 63.2, 63.5, 66.2, 68.5, 70.0, 71.7, 73.1, 73.8, 73.5, 73.8, 73.3, 73.1, 73.0, 72.4, 71.2])imp = building.lab_impact_insulation(li, t2, volume=50.0)print(round(float(imp.l_n[0]), 1)) # 62.1 Ln = Li + 10 lg(A/A0)print(imp.rating.rating, imp.rating.ci) # 79 -11 -> Ln,w(CI)
# Sanity check on the algebra, not a wall: with S = A the 10 lg(S/A) term# vanishes, so a flat 40 dB level difference reads back as a flat R = 40 dB.flat = building.lab_airborne_insulation(np.full(16, 80.0), np.full(16, 40.0), np.full(16, 0.5), area=16.0, volume=50.0)print(round(float(flat.r[0]), 1)) # 40.0
# Background correction: margins 6 / 1 / 20 dB -> capped / capped / unchangedcorrected = building.background_correction([30.0, 33.0, 50.0], [24.0, 32.0, 30.0])print(np.round(corrected, 1)) # [28.7 31.7 50.0] (1.3 dB cap twice)
lab.rating.plot() # measured R vs shifted ISO 717-1 reference (needs matplotlib)Read the numbers rather than collecting them. dB is a light
partition (a single plasterboard leaf or a thin glazed unit) well below the
45 to 55 dB a dwelling separating wall is normally specified at, and its
dB says it gives up a further 3 dB against traffic, so it would
be quoted as 27 dB against a road. dB is a bare structural slab
with no covering and no floating floor: European impact limits for dwellings
sit around 50 to 60 dB, so this floor fails every one of them by roughly
20 dB. Its dB is the interesting half: a strongly negative
means the measured spectrum is far more high-frequency-weighted
than the reference contour, so the slab is better at the low frequencies
footsteps actually excite than alone suggests, and a soft
covering (which acts at high frequency) will improve the single number more
than it improves what the neighbour hears. Both single numbers are formed only
when exactly 16 one-third-octave or 5 octave values are supplied (rating is
None otherwise). A margin at or below 6 dB emits a LabInsulationWarning and
flags the band as the limit of measurement; catch it with
warnings.simplefilter("error", LabInsulationWarning).
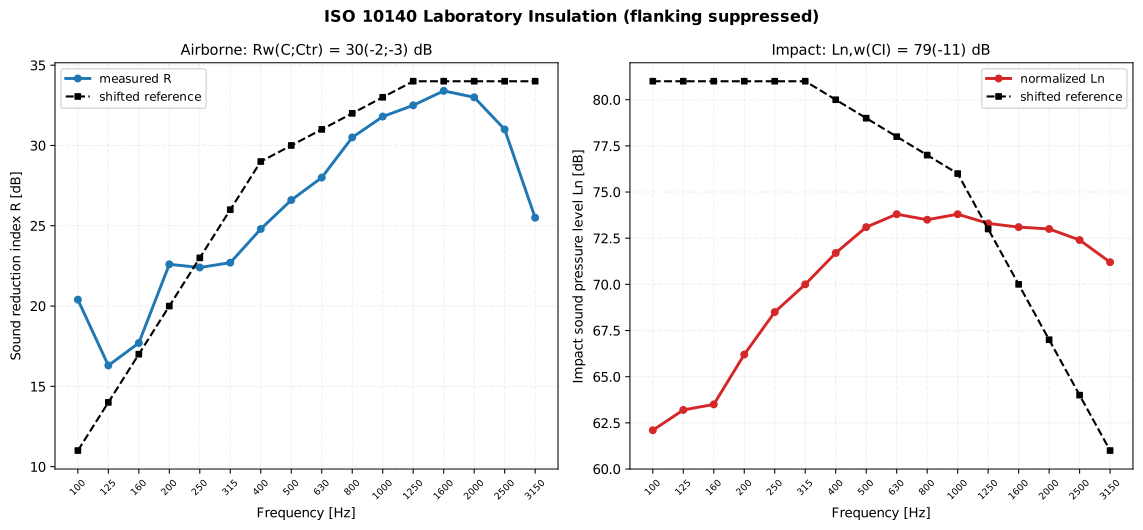
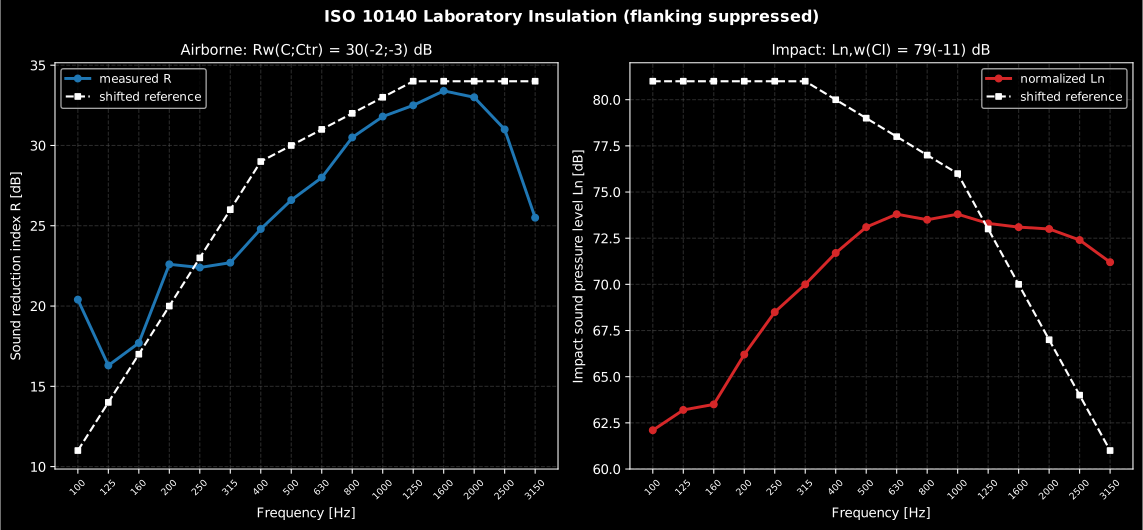
The two laboratory quantities of ISO 10140 with their ISO 717 ratings: the
airborne is rated where the reference sits above the measurement,
the impact where the measurement sits above the reference (a
higher impact level is worse). lab.plot() and imp.plot() draw either
panel on its own.
Show the code for this figure
import matplotlib.pyplot as pltimport numpy as npfrom phonometry import building
# The ISO 717-1 Annex C wall in an ISO 10140 suite (S = 10 m2, V = 50 m3,# T = 0.8 s) and the ISO 717-2 Annex C floor under the tapping machine.r = np.array([20.4, 16.3, 17.7, 22.6, 22.4, 22.7, 24.8, 26.6,              28.0, 30.5, 31.8, 32.5, 33.4, 33.0, 31.0, 25.5])l1 = np.full(16, 90.0)t2 = np.full(16, 0.8)lab = building.lab_airborne_insulation(l1, l1 - r, t2, area=10.0, volume=50.0)li = np.array([62.1, 63.2, 63.5, 66.2, 68.5, 70.0, 71.7, 73.1,               73.8, 73.5, 73.8, 73.3, 73.1, 73.0, 72.4, 71.2])imp = building.lab_impact_insulation(li, t2, volume=50.0)
# One line each — R (or Ln) vs its shifted ISO 717 reference:lab.plot()imp.plot()plt.show()
# By hand, both panels from the results' fields:fig, (ax1, ax2) = plt.subplots(1, 2, figsize=(11, 4.5))ax1.semilogx(lab.rating.band_centers, lab.r, "o-", label="measured R")ax1.semilogx(lab.rating.band_centers, lab.rating.shifted_reference, "s--",             label="shifted reference")ax1.set_title(f"Rw = {lab.rating.rating} dB")ax2.semilogx(imp.rating.band_centers, imp.l_n, "o-", label="normalized Ln")ax2.semilogx(imp.rating.band_centers, imp.rating.shifted_reference, "s--",             label="shifted reference")ax2.set_title(f"Ln,w = {imp.rating.rating} dB")for ax in (ax1, ax2):    ax.set_xlabel("Frequency [Hz]")    ax.legend()ax1.set_ylabel("Sound reduction index R [dB]")ax2.set_ylabel("Impact sound pressure level Ln [dB]")plt.show()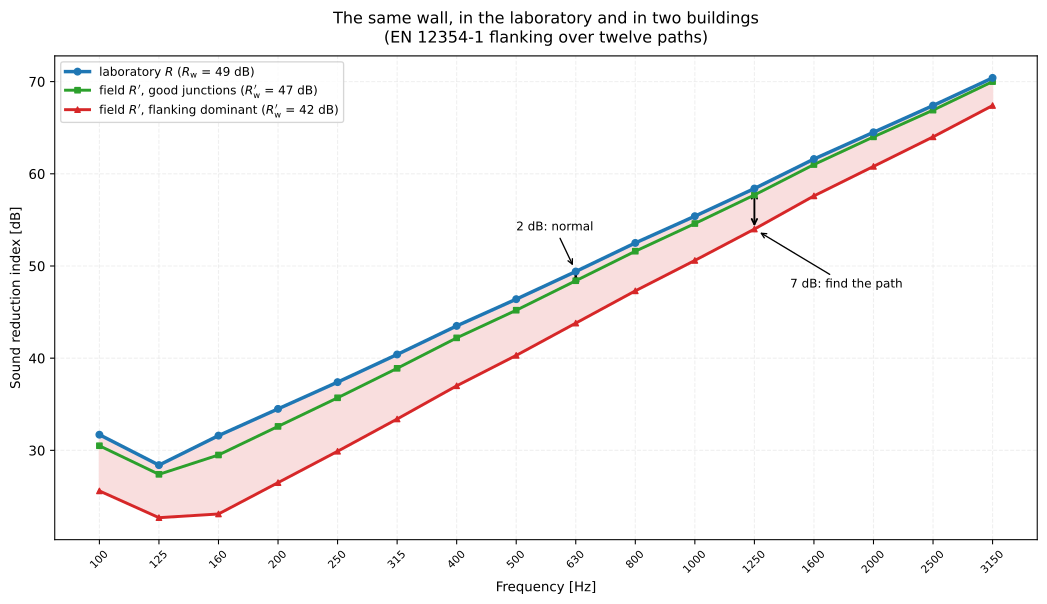
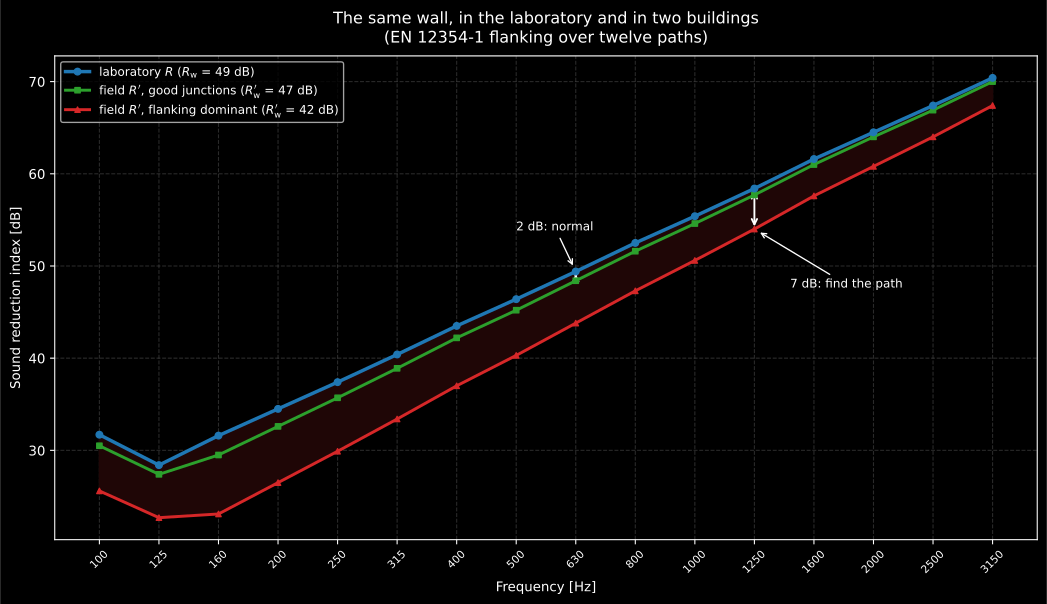
The same 150 mm concrete wall, measured three ways. Two decibels of loss is what a well-built junction costs and is the number to expect; seven says the sound is arriving by a route the partition does not control, and the twelve flanking paths of the EN 12354-1 model (three per flanking element) are where to look for it. The two field curves are predictions, not offsets: only the junction quality changes between them, through the direction-averaged velocity level difference that an ISO 10848 measurement supplies.
Show the code for this figure
import matplotlib.pyplot as pltimport numpy as np# `building` is the import of the laboratory block above.
freqs = np.array([100, 125, 160, 200, 250, 315, 400, 500, 630, 800,                  1000, 1250, 1600, 2000, 2500, 3150], dtype=float)lab_r = np.round(building.single_panel_transmission_loss(    freqs, 345.0, critical_frequency=125.0).transmission_loss, 1)floor = np.round(building.single_panel_transmission_loss(    freqs, 322.0, critical_frequency=135.0).transmission_loss, 1)facade = np.round(building.single_panel_transmission_loss(    freqs, 230.0, critical_frequency=160.0).transmission_loss, 1)
def apparent(dv_100):    """R' over the direct path plus twelve flanking paths (Formula 15)."""    dv = dv_100 + 6 * np.log10(freqs / 100)    tau = 10 ** (-lab_r / 10)    for r_flank, area, length in ((floor, 13.5, 4.5), (floor, 13.5, 4.5),                                  (facade, 7.65, 2.55), (facade, 7.65, 2.55)):        for _ in range(3):                      # the Ff, Fd and Df paths            r_ij = building.flanking_reduction_index(                index_i=r_flank, index_j=r_flank,                velocity_level_difference=dv,                separating_area=11.5, area_i=area, area_j=area)            tau = tau + 10 ** (-np.asarray(r_ij) / 10)    return np.round(-10 * np.log10(tau), 1)
good, poor = apparent(14.0), apparent(4.0)print(building.weighted_rating(lab_r).rating,      building.weighted_rating(good).rating,      building.weighted_rating(poor).rating)          # 49 47 42
fig, ax = plt.subplots()x = np.arange(16)ax.fill_between(x, poor, lab_r, alpha=0.2)ax.plot(x, lab_r, "-o", label="laboratory R")ax.plot(x, good, "-s", label="field R', good junctions")ax.plot(x, poor, "-^", label="field R', flanking dominant")ax.set_xticks(x, [f"{f:g}" for f in freqs], rotation=45, fontsize=8)ax.set(xlabel="Frequency [Hz]", ylabel="Sound reduction index [dB]")ax.legend()plt.show()
Procedure (ISO 10140-4:2010)
Section titled “Procedure (ISO 10140-4:2010)”The laboratory rules are not the field rules, and a reader moving between this page and its field sibling will apply the wrong ones unless they are stated side by side.
Bands (Clause 4.1). One-third octaves from 100 Hz to 5000 Hz: 18 bands, two more than the 16 the ISO 717 rating consumes, with 50, 63 and 80 Hz added when low-frequency information is wanted (Annex A).
Microphones (Clauses 4.2.2, 4.2.3). Minimum separations, to be exceeded where possible: 0.7 m between fixed positions, 0.7 m from the room boundaries, 0.7 m from any diffuser, 1.0 m from the test element and 1.0 m from the sound source. The field standard’s 0.7 m / 1.0 m pattern looks similar and is not the same list. Average at least 6 s per band at each fixed position from 100 Hz to 400 Hz, dropping to no less than 4 s above that; a continuously moving microphone integrates over a whole number of traverses and never less than 30 s.
Airborne (Clauses 4.4.1 to 4.4.3). Loudspeakers in at least two positions, or one loudspeaker moved to at least two, or a moving loudspeaker, qualified per ISO 10140-5:2010 Annex D. With fixed microphones: at least five positions in each room, no two in the same plane relative to the boundaries and never in a regular grid; with a single loudspeaker, five per room per loudspeaker position. With a continuously moving microphone: sweep radius at least 1 m, the plane of the traverse inclined so that it lies at least 10° to every room surface, traverse period at least 15 s, and one measurement per loudspeaker position.
Impact (Clause 4.5). The standard tapping machine of ISO 10140-5:2010 Annex E: five hammers in a line at mm centres, each an effective mass of 500 g falling freely 40 mm (so it lands at m/s), successive impacts ms apart, the whole machine under 25 kg so it does not load a lightweight floor; in not less than four positions. With fixed microphones the number of microphone positions equals the number of tapping-machine positions or an integer multiple of it: with four or five machine positions, at least two measurements at each from at least two microphone positions; with six or more, at least one measurement per machine position, each at a different microphone position. ISO 10140-5:2010 Annex F specifies the rubber ball alongside the tapping machine, and its low-frequency thumps are rated by an entirely different engine: see Heavy and Soft Impact Sources.
Reverberation time (Clause 4.6). ISO 3382-2 engineering method (the precision method is allowed), evaluated from 5 dB below the initial level over a preferred 20 dB range whose bottom stays at least 10 dB above the system’s background. At least six measurements per band: interrupted noise with one loudspeaker position and either three microphone positions measured twice or six measured once; or the integrated impulse response with one source position and six fixed microphone positions, reverse-integrated. Then (Formula (5)).
Mounting is a variable, not a caption
Section titled “Mounting is a variable, not a caption”The mounting string in the fiche metadata below is the one piece of report
text that changes the number. ISO 10140-1:2010 fixes the boundary and mounting
conditions per element type, one annex each: walls, doors, windows, glass
panes, floor coverings and so on, because there is no single rule that could
serve them all:
- For a lightweight twin-leaf wall (Annex A.3) the decisive parameters are the niche depth and where the partition sits relative to the laboratory’s acoustic break. The partition shall be built on one side of the break, not across it, precisely because mounting it across can give a higher sound reduction index (NOTE 1): a laboratory could otherwise flatter a product by construction.
- For a window (Annex C.3) the niches on the two sides shall have different depths, preferably in a ratio of about 2:1, and the 10 mm to 13 mm perimeter gap is filled with absorbing material and sealed airtight on both sides.
- Any other mounting may be used, but it shall be fully described in the test report. That sentence is why the label exists.
The test opening itself is part of it: approximately 10 m² for walls, 10 m² to 20 m² for floors, shorter edge not less than 2.3 m (ISO 10140-5:2010, Clause 3.3.1). For a heavy specimen the surround must not damp it into a better result, so the loss factor of the test element shall be at least (Formula (2)), checked with a (400 ± 40) kg/m² brick or block wall plastered on one side. A catalogue quoted without its mounting label and its opening geometry is not a property of the product, and the same specimen in a different opening is a different measurement.
lab_airborne_insulation() / lab_impact_insulation() parameters
Section titled “lab_airborne_insulation() / lab_impact_insulation() parameters”| Parameter | Type | Units | Range / default | Notes |
|---|---|---|---|---|
l1 / l2 | 1D or 2D array | dB | one/band, or (positions, bands) | Source / receiving levels (airborne) |
li | 1D or 2D array | dB | one/band, or (positions, bands) | Impact SPL from the tapping machine (impact) |
t2 | 1D array | s | > 0, one per band | Receiving-room reverberation time |
area | float | m² | > 0 | Free test-opening area (airborne only) |
volume | float | m³ | > 0 | Receiving-room volume |
lab_airborne_insulation() returns a LabAirborneInsulationResult (r,
absorption, rating); lab_impact_insulation() a
LabImpactInsulationResult (l_n, absorption, rating);
background_correction(signal_and_background, background) returns the corrected
levels directly.
ISO 10140 laboratory test report (.report())
Section titled “ISO 10140 laboratory test report (.report())”Both laboratory results write the one-page ISO 10140 test report directly, laid
out like the accredited laboratory reports rated per ISO 717.
LabAirborneInsulationResult.report() renders the sound reduction index
fiche (ISO 10140-2:2010) and LabImpactInsulationResult.report() the
normalized impact sound pressure level fiche (ISO 10140-3:2010). Each
fiche names the laboratory standard in its basis line, evaluates the
ISO 717-1 / ISO 717-2 single-number rating (16 one-third-octave bands from
100 Hz to 3150 Hz, or the 5 octave bands), states the quantity to one decimal
place both in tabular form and as a curve against the shifted reference curve,
boxes the laboratory rating (Rw (C; Ctr) or Ln,w (CI)) and prints the
statement that the evaluation is based on laboratory measurement results
obtained by a precision method. Because a qualified suite suppresses flanking
transmission, the reported quantity is the direct / , not the field
/ .
verbose=True annexes the per-band equivalent sound absorption area
(ISO 10140-4:2010) beside the reported quantity, the
normalization datum the laboratory report carries. Metadata (client, specimen,
mounting, room volumes, climatic conditions), the requirement verdict (airborne
passes at or above it, impact at or below it), language="es" and the
phonometry[report] extra behave exactly as in the ISO 717 and ISO 16283
fiches.
import numpy as npfrom phonometry import building, ReportMetadata
# Laboratory airborne: source/receiving levels and T per one-third-octave bandl1 = np.full(16, 90.0)r = np.array([20.4, 16.3, 17.7, 22.6, 22.4, 22.7, 24.8, 26.6,              28.0, 30.5, 31.8, 32.5, 33.4, 33.0, 31.0, 25.5])lab = building.lab_airborne_insulation(    l1, l1 - r, np.full(16, 0.8), area=10.0, volume=50.0)lab.plot()   # measured R vs shifted ISO 717-1 reference (needs matplotlib)metadata = ReportMetadata(    specimen="100 mm autoclaved aerated concrete block wall",    client="Example client",    area=10.0, mass_per_area=75.0,    source_volume=53.0, receiving_volume=50.0,    test_room="Transmission suite (example)",    mounting="Type A mounting, mortar-bedded perimeter (ISO 10140-1)",    measurement_standard="ISO 10140-2",    laboratory="Phonometry Reference Laboratory",    report_id="PHN-2026-0143",    requirement=30.0,               # Rw >= 30 dB -> PASS/FAIL row)lab.report("Rw_lab.pdf", metadata=metadata)            # Rw (C; Ctr)lab.report("Rw_lab_chain.pdf", metadata=metadata,           verbose=True)                               # f | A | R
# Laboratory impact: tapping-machine levels in the receiving roomli = np.array([62.1, 63.2, 63.5, 66.2, 68.5, 70.0, 71.7, 73.1,               73.8, 73.5, 73.8, 73.3, 73.1, 73.0, 72.4, 71.2])imp = building.lab_impact_insulation(li, np.full(16, 0.8), volume=50.0)imp.report("Lnw_lab.pdf",           metadata=ReportMetadata(requirement=80.0))  # Ln,w (CI)
Both example fiches are regenerated with make reports and kept in the
repository. Click either preview to open the PDF:
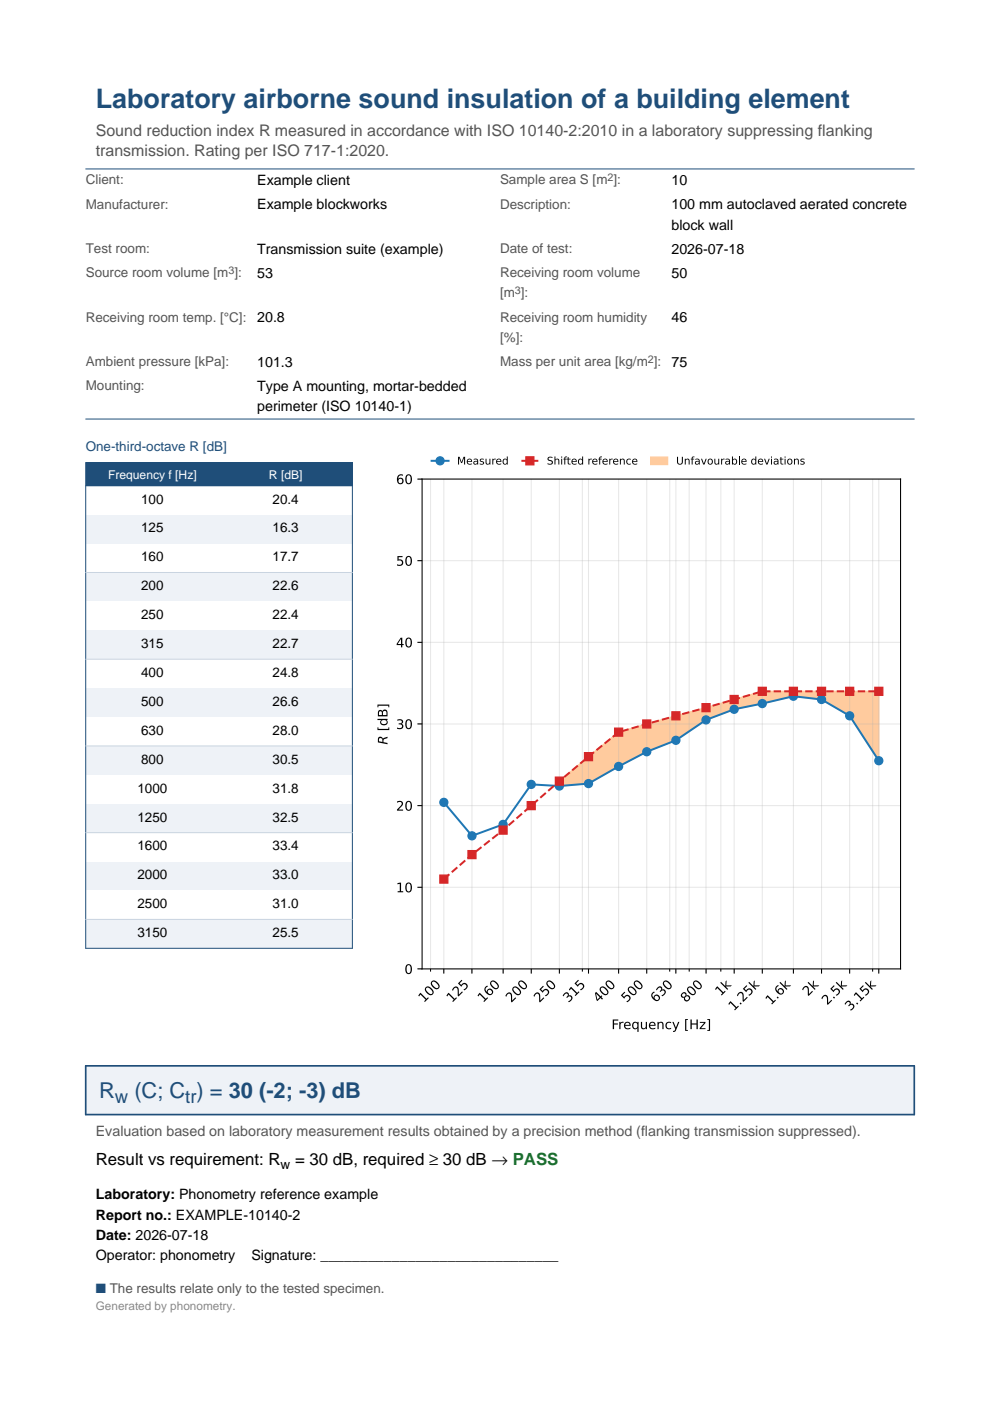
One-page laboratory airborne sound insulation test report of a building element: the metadata header (client, specimen description, mounting, sample area, room volumes, climate), the one-third-octave R table beside the measured-versus-shifted-reference curve, the boxed Rw (C; Ctr) laboratory rating, the precision-method statement and a PASS verdict against the 30 dB requirement.
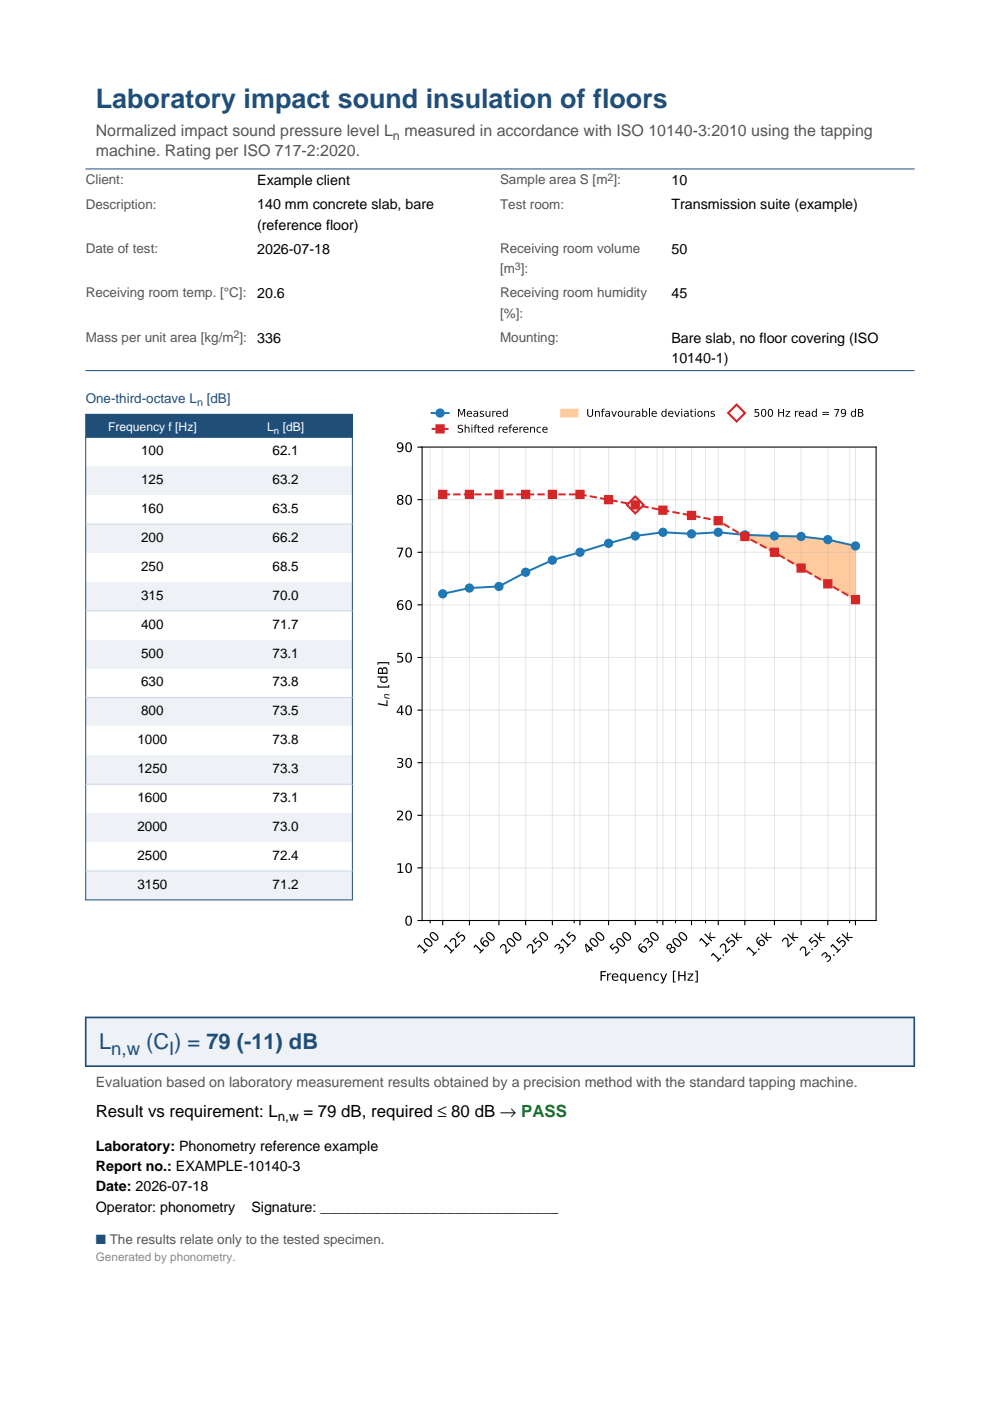
One-page laboratory impact sound insulation test report for a floor under tapping-machine excitation: the metadata header, the one-third-octave Ln table beside the measured-versus-shifted-reference curve with the 500 Hz read-off, the boxed Ln,w (CI) laboratory rating, the precision-method statement and a PASS verdict against the 80 dB requirement (a lower impact level is better).
Beyond the pressure method
Section titled “Beyond the pressure method”Three neighbouring laboratory measurements have guides of their own. When flanking is too high for the pressure method, Sound Insulation by Intensity (ISO 15186) reads the transmitted power directly off the radiating face. For a soft floor covering, Floor-Covering Impact Improvement (ISO 16251-1) replaces the two-room suite with a small heavyweight mock-up. And the junction data the EN 12354 prediction consumes is measured per Laboratory Flanking Transmission (ISO 10848).
What this guide covers
Section titled “What this guide covers”Covered
ISO 10140-2:2010 (the laboratory sound reduction index with the Clause 4.3 background-noise correction) and ISO 10140-3:2010 (the laboratory normalized impact level ), via
building.lab_airborne_insulation,building.lab_impact_insulationandbuilding.background_correction; the single-number ratings reuse the verified ISO 717-1/ISO 717-2 engines, and both results write the one-page ISO 10140 fiche through.report(), with the ISO 10140-4:2010 absorption-area annex in the verbose form.Not covered
The ISO 10140-4:2010 procedure and the ISO 10140-1:2010 and ISO 10140-5:2010 facility and mounting requirements are documented above and implemented nowhere: nothing checks the position counts, the separations, the averaging times, the band range, the test-opening geometry or the loss-factor requirement, and the mounting condition survives only as a free-text label in report metadata (
"Type A mounting, mortar-bedded perimeter (ISO 10140-1)"): this is what ISO 10140-1 asks for, since it requires any mounting to be described rather than selected from a list. Nothing estimates the suite’s either, so a result approaching the facility’s ceiling will be produced without complaint; that qualification has to come from the laboratory’s own Annex A tests. The neighbouring laboratory measurements are covered by their own guides: sound insulation by intensity (ISO 15186), the floor-covering improvement (ISO 16251-1) and flanking transmission (ISO 10848).
References
Section titled “References”- Hopkins, C. (2007). Sound insulation. Butterworth-Heinemann. https://doi.org/10.4324/9780080550473The reference monograph for laboratory sound-insulation measurement and the interpretation of the laboratory indices. ISBN 978-0-7506-6526-1.
- International Organization for Standardization. (2010). Acoustics — Laboratory measurement of sound insulation of building elements — Part 2: Measurement of airborne sound insulation (ISO 10140-2:2010). The laboratory sound reduction index R with the background-noise correction (Clause 4.3).
- International Organization for Standardization. (2010). Acoustics — Laboratory measurement of sound insulation of building elements — Part 3: Measurement of impact sound insulation (ISO 10140-3:2010). The laboratory normalized impact level Ln.
- International Organization for Standardization. (2010). Acoustics — Laboratory measurement of sound insulation of building elements — Part 4: Measurement procedures and requirements (ISO 10140-4:2010). The measurement procedures and the background-noise correction shared by the airborne R and impact Ln.
- Vigran, T. E. (2008). Building acoustics. CRC Press. https://doi.org/10.1201/9781482266016The transmission theory of single and double constructions that laboratory indices quantify. ISBN 978-0-415-42853-8.