Room-noise criteria (NC / RC Mark II)
Standards: ANSI/ASA S12.2Key references: Beranek 1957Kosten & van Os 1962Blazier 1997
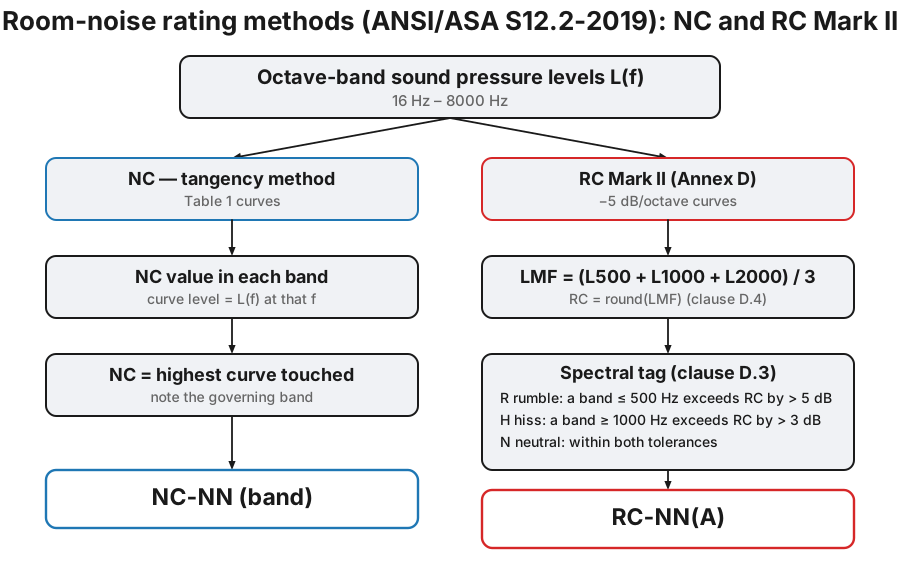
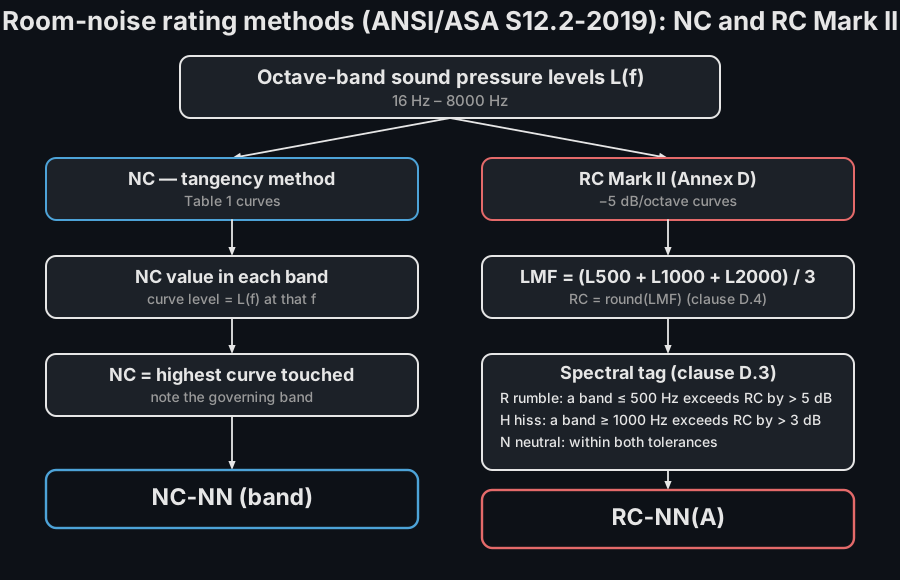
Steady background noise in an occupied room (from ventilation, diffusers or distant traffic) is rated against a family of octave-band criterion curves. ANSI/ASA S12.2-2019, Criteria for Evaluating Room Noise, defines two spectrum-in ratings that phonometry implements: the Noise Criteria (NC) rating (the NC-(SIL) designation of clause 5.2.2, with the tangency method when the spectrum exceeds it), and the Room Criteria Mark II (RC) rating with its rumble/hiss spectral tag. Both work on octave-band sound pressure levels over the ten bands from 16 Hz to 8000 Hz.
0. Measuring the spectrum
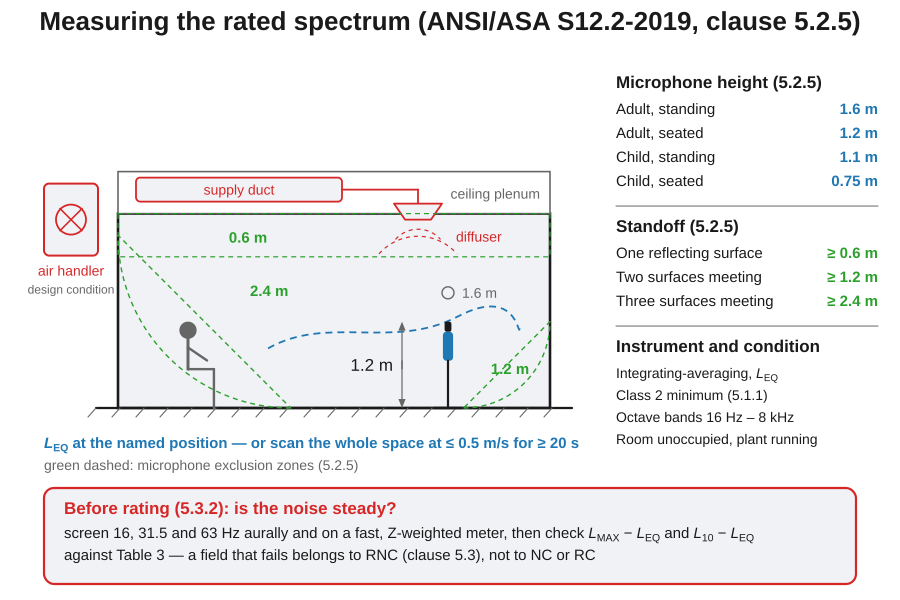
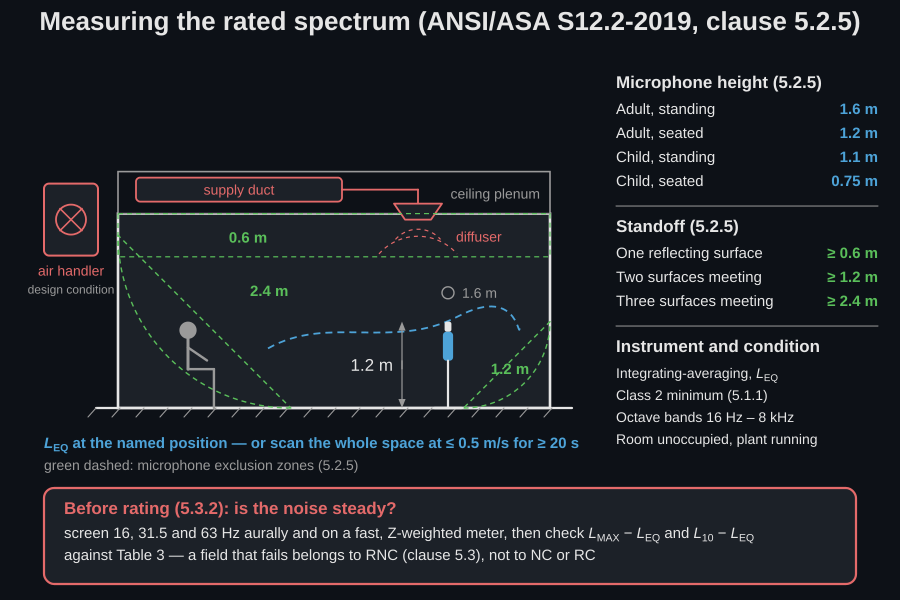
Section titled “0. Measuring the spectrum”Both ratings consume ten numbers, and the standard is specific about how those ten numbers are obtained. Clause 5.2.5 (repeated at 5.1.2 for the A-weighted criteria) fixes the instrument, the height and the clearances.
The instrument and the quantity. The measured quantity is per octave band, taken with an integrating-averaging meter (not a needle read by eye). Clause 5.1.1 sets the floor for the A-weighted criteria at a meter meeting at least the class 2 requirements of ANSI/ASA S1.4 Part 3 / IEC 61672-3; use a class 1 chain when the result will be argued over. There are two admissible geometries: characterise a specific position, in which case the microphone stands at that position, or characterise the whole space, in which case the microphone is swept slowly around it at not more than 0.5 m/s for not less than 20 s.
Where the microphone goes. At the occupants’ ear height: 1.6 m standing and 1.2 m seated for adults, 1.1 m and 0.75 m for children; and no closer than 0.6 m to any reflecting surface, 1.2 m to the intersection of two, or 2.4 m to the intersection of three. The standoff rule is the one that bites in a small room: a microphone tucked into a corner sees pressure doubling in the low bands and can add several decibels below 250 Hz, which is enough to fabricate a rumble tag or to move the NC governing band.
The operating condition. The room is measured unoccupied, with the services running at their design condition, not with the plant at part load; the informative criteria of Annex C and Annex D are written for that state, with human activity excluded. Intermittent events (a door, a printer, a passing vehicle) are excluded from the integration or reported separately.
The octave-band arithmetic behind the input spectrum (filters, weighting, energetic averaging) is in Levels and Filter Banks.
1. Noise Criteria: SIL designation and tangency
Section titled “1. Noise Criteria: SIL designation and tangency”Before you rate: is the noise steady?
Section titled “Before you rate: is the noise steady?”The NC curves (ANSI/ASA S12.2-2019 Table 1) are a family of octave-band limits, each designated by its value at 1000 Hz (NC-15 up to NC-70). Clause 5.2.2 rates a spectrum in two steps. First the speech interference level (clause 3.2, the average of the 500/1000/2000/4000 Hz levels) selects the NC-(SIL) curve: if no octave band exceeds it, the spectrum is simply designated NC-(SIL). Only when the spectrum pokes above that curve does the tangency method (clause 5.2.3) take over: for each octave band, the NC index whose curve passes through the measured level is found, and the rating is the maximum across bands. The band where that maximum occurs, the one that pushes the spectrum up against the curves, is reported as the governing band.
import numpy as npfrom phonometry import room
# Octave-band SPL, 16 Hz - 8000 Hz (a ventilation-dominated room).spl = np.array([62.0, 62.0, 59.0, 57.0, 52.0, 42.0, 35.0, 29.0, 24.0, 19.0])
nc = room.noise_criterion(spl)print(round(nc.sil, 1))           # 32.5   (clause 3.2)print(nc.method)                  # 'tangency'  (the NC-32 curve is exceeded)print(round(nc.rating, 1))        # 42.5print(nc.governing_frequency)     # 250.0  (the tangent band)print(nc.label)                   # 'NC-42.5 (250 Hz)'nc.plot()   # the spectrum over the NC curve family (left panel below)
Because a tangency rating interpolates between the tabulated curves it is a
continuous number: an NC rating of sits half-way between NC-40 and
NC-45 (a SIL designation is always an integer). The tangency rating is kept
on tangency_rating even when the SIL designation applies. A subset of the
octave bands may be supplied together with their centre frequencies
(room.noise_criterion(levels, frequencies)); without the four SIL bands the
tangency rating alone sets the designation.
The Table 1 family ends at NC-70 and NC-15, and the standard defines no
rating beyond it. A spectrum above the NC-70 curve (or entirely below the
NC-15 curve) therefore gets rating = nan and an out_of_range flag of
"above" / "below", with nc.label reading '>NC-70 (63 Hz)' (the band
with the largest exceedance over NC-70 governs) or '<NC-15'; no NC-71 or
NC-14 style numbers are ever fabricated.
Reading the low-frequency excess
Section titled “Reading the low-frequency excess”The tangency rating stops at “which band?”, but clause 5.2.4 goes one step further and asks “by how much, and does it matter?”. The procedure is four steps, in the standard’s order: compute the SIL; select the NC criterion curve with the same number as the SIL; plot the measured spectrum against that curve; and read the differences in the octave bands below 500 Hz against Table 2.
| Deviation above the NC-(SIL) curve | 31.5 Hz | 63 Hz | 125 Hz | 250 Hz |
|---|---|---|---|---|
| Possible serious dissatisfaction | — | 6–9 dB | 6–9 dB | 6–9 dB |
| Likely serious dissatisfaction | — | > 9 dB | > 9 dB | > 9 dB |
The 31.5 Hz column is blank in the standard because there were not enough data to quantify it. That is worth knowing, because these bands are not a model: they come from measured spectra in offices, lecture halls and meeting rooms where the low-frequency noise had already been severe enough to require remedial work on the HVAC system. So the procedure is diagnostic, not pass/fail: more than 9 dB over the curve in any one of the 63, 125 or 250 Hz bands means complaints strong enough to require remedial action are likely. The table’s footnote adds the other half of the story: in some of those same rooms the 31.5 Hz levels were high enough to indicate clearly perceptible vibration and rattle, which is the condition behind the tag this module does not implement.
Everything the procedure needs is already on the result: nc.sil selects the
curve, nc.levels carries the measured spectrum, and verbose=True on the
fiche (section 4) prints the per-band NC contour the tangency method read.
2. Room Criteria Mark II: rating and spectral tag
Section titled “2. Room Criteria Mark II: rating and spectral tag”The RC Mark II curves (ANSI/ASA S12.2-2019 Annex D, Table D.1) have a constant slope of −5 dB/octave, keyed to their value at 1000 Hz, with the 16 Hz level equal to the 31.5 Hz level and a low-frequency floor of 55 dB. The numerical rating is the mid-frequency average , the mean of the 500, 1000 and 2000 Hz levels, rounded to the nearest decibel (clause D.4):
A spectral tag then describes the character of the noise by how the spectrum deviates from the reference RC curve (clause D.3): rumble () when a band at or below 500 Hz exceeds the curve by more than 5 dB, hiss () when a band at or above 1000 Hz exceeds it by more than 3 dB, and neutral () when neither happens.
None of those four shape rules is arbitrary. The −5 dB per octave slope is
the balance point at which a broadband ventilation background is heard as
bland rather than boomy or hissy, close enough to the ear’s own falling
sensitivity that the spectrum carries no timbre of its own, which is why
Annex D was derived from 68 offices where nobody complained. The 55 dB
floor on the low RC numbers exists because below it the question stops being
audibility and becomes perceptible vibration and rattle in lightweight
walls, ceilings and ductwork: that region is what the tag and its
separate Table 6 test address, and it is the same effect the Table 2 footnote
recorded at 31.5 Hz. The asymmetric tolerances follow from where the
excess sits: a low-frequency excess is spread over the four bands at and below
500 Hz and is tolerated to 5 dB before it colours the sound, whereas a
high-frequency excess at or above 1 kHz lands squarely in the speech range and
is objectionable at 3 dB. The tag is computed only over the bands actually
supplied, which is why a spectrum missing bands still rates but emits a
UserWarning.
import numpy as npfrom phonometry import room
spl = np.array([62.0, 62.0, 59.0, 57.0, 52.0, 42.0, 35.0, 29.0, 24.0, 19.0])
rc = room.room_criterion(spl)print(rc.label)             # RC-35(R)   -  a rumbly roomprint(round(rc.lmf, 1))     # 35.3print(rc.classification)    # Rrc.plot()   # the spectrum over the RC reference (right panel below)
# The whole Table D.1 family is one call away, so a design target exists# before any spectrum does: rc_curve(index) returns the octave-band levels# of a named RC curve over the same 16 Hz - 8 kHz bands.target = room.rc_curve(35.0)print(target.round(1))      # [60. 60. 55. 50. 45. 40. 35. 30. 25. 20.]print((spl - target).round(1))   # [ 2.  2.  4.  7.  7.  2.  0. -1. -1. -1.]
That last line is the number a specification is written against: band by band,
how far the room sits above or below “RC-35(N)”. rc_curve accepts any index,
while Table D.1 tabulates RC-25 to RC-50 only, which is what
RCResult.out_of_family flags.
The strong low-frequency content of this spectrum lifts the 63–250 Hz bands well above the reference curve, so the noise is tagged (rumble): the subjective “throb” of an oversized air handler.
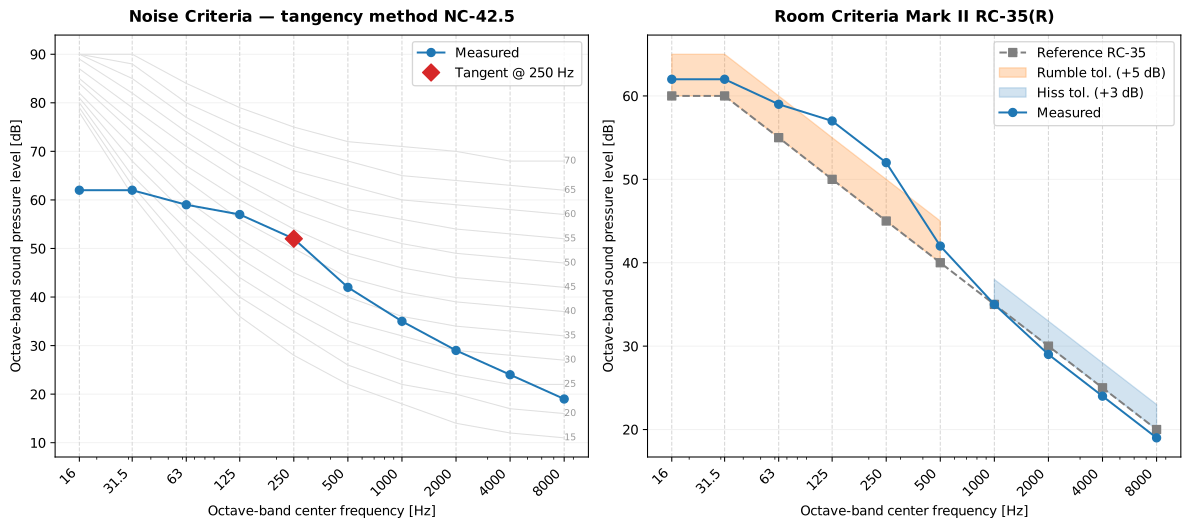
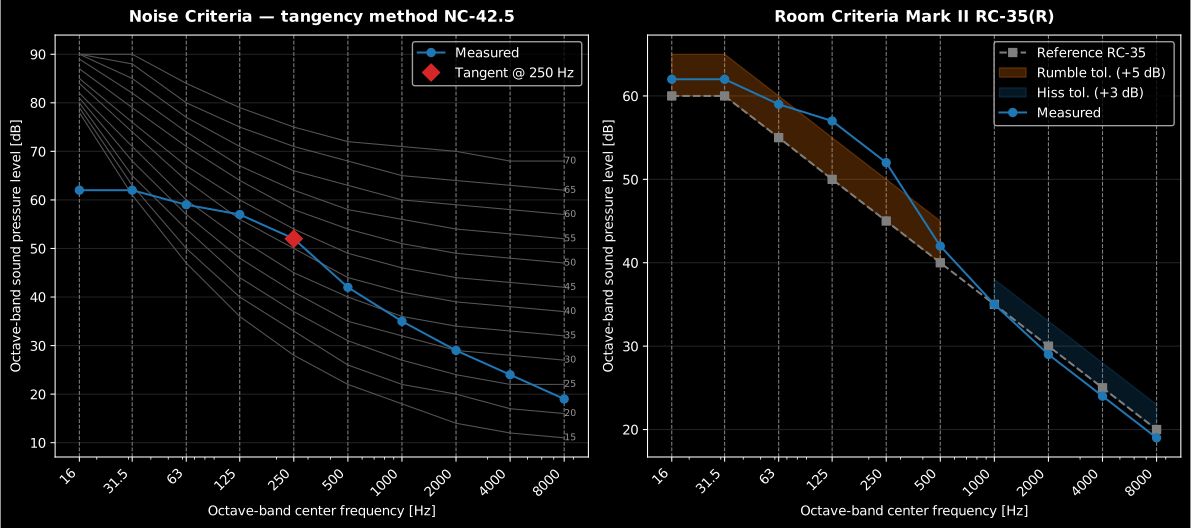
The same ten numbers read two ways. Left, the Table 1 NC family with the 250 Hz tangency that sets NC-42.5; right, the Table D.1 RC family, whose −5 dB/octave lines flatten onto the 55 dB floor at 16 and 31.5 Hz, with the measured spectrum breaking the +5 dB rumble tolerance of its RC-35 reference.
Show the code for this figure
import numpy as npimport matplotlib.pyplot as pltfrom phonometry import room
spl = np.array([62.0, 62.0, 59.0, 57.0, 52.0, 42.0, 35.0, 29.0, 24.0, 19.0])
# One line each:room.noise_criterion(spl).plot()room.room_criterion(spl).plot()plt.show()
# By hand, mirroring what NCResult.plot() / RCResult.plot() draw. Either# family can also be built one curve at a time from the public helpers# room.nc_curve(index) and room.rc_curve(index), which is what the RC panel# below does; OCTAVE_BANDS is re-exported at the top level as well.from phonometry.room.noise_criteria import NC_CURVES, NC_INDICES, OCTAVE_BANDSnc, rc = room.noise_criterion(spl), room.room_criterion(spl)fig, (ax1, ax2) = plt.subplots(1, 2, figsize=(12, 5))
for row, idx in zip(NC_CURVES, NC_INDICES):    ax1.plot(OCTAVE_BANDS, row, color="#bbbbbb", lw=0.8)ax1.plot(OCTAVE_BANDS, spl, "o-", label="Measured")gov = spl[OCTAVE_BANDS == nc.governing_frequency][0]ax1.plot([nc.governing_frequency], [gov], "D", color="#d62728")ax1.set_xscale("log"); ax1.set_title(f"NC-{nc.rating:g}")
for idx in range(25, 51, 5):        # the Table D.1 family, RC-25 to RC-50    ax2.plot(OCTAVE_BANDS, room.rc_curve(float(idx)), color="#bbbbbb", lw=0.8)ref = rc.reference_curvelow, high = OCTAVE_BANDS <= 500, OCTAVE_BANDS >= 1000ax2.plot(OCTAVE_BANDS, ref, "s--", color="#7f7f7f", label=f"Reference RC-{rc.rating}")ax2.fill_between(OCTAVE_BANDS[low], ref[low], ref[low] + 5, color="#ffbb78", alpha=0.35)ax2.fill_between(OCTAVE_BANDS[high], ref[high], ref[high] + 3, color="#aec7e8", alpha=0.45)ax2.plot(OCTAVE_BANDS, spl, "o-", label="Measured")ax2.set_xscale("log"); ax2.set_title(rc.label)plt.show()
The NCResult carries the rating, the sil, the tangency_rating, the
method ('SIL' or 'tangency'), the governing_frequency, the
out_of_range flag and the measured levels, plus a convenience label
('NC-44', 'NC-51 (125 Hz)', '>NC-70 (63 Hz)'); the RCResult carries
the rating, the lmf, the classification, the reference_curve, an
out_of_family flag (Table D.1 tabulates RC-25 through RC-50 only) and a
convenience label in the RC-NN(A) form. Clause D.3.5 admits the tags
, , or ; when both the rumble and hiss deviations fire, the
library reports the combined RH as a diagnostic extension. Each result
exposes a .plot() that renders its panel above. Clause D.4 expects at
least the 31.5 Hz to 4000 Hz octave bands: a spectrum missing any of them
still rates, but emits a UserWarning because the absent bands are skipped
by the tag deviation tests.
3. Choosing a criterion: NC, RC Mark II or NR
Section titled “3. Choosing a criterion: NC, RC Mark II or NR”What rating a room should meet
Section titled “What rating a room should meet”A rating on its own is not an answer, and the standard knows it: S12.2 pairs each method with an informative table of recommended criteria by occupancy: an A-weighted table (Annex C, Table C.1), an NC/RNC table (Annex C, Table C.2, which clause 5.2.6 points at) and an RC Mark II table (Annex D, Table D.2). A specification normally cites one of them, or a national equivalent. Anchors from the NC/RNC table:
| Occupancy | Recommended NC / RNC |
|---|---|
| Concert halls, opera houses, recital halls | 15–18 |
| TV and broadcast studios (close pickup) | 15–25 |
| Large auditoriums and drama theatres (> 500 seats) | 20–25 |
| Small auditoriums (≤ 500 seats) | 25–30 |
| Bedrooms | 25–30 |
| Lecture and classrooms, core learning space ≤ 566 m³ | 25–30 |
| Lecture and classrooms, core learning space > 566 m³ | 30–35 |
| Apartments, family and living rooms | 30–40 |
| Hotel individual rooms or suites | 30–35 |
| Open-plan office areas | 35–40 |
| Hotel service support areas | 40–50 |
These are informative and unoccupied values, with the noise of human
activity excluded, and the RC table adds (N) to every entry: only a neutral
spectrum should normally be accepted as a specification (clause D.3.1). Read
them as ranges: a rating inside the range complies, and the governing band
tells you where the margin is thinnest. They are also written for steady
noise, so an intermittent source is assessed separately and, per the screen
at the head of section 1, a fluctuating or surging one is not assessed by
these methods at all.
The two numbers are not on the same scale
Section titled “The two numbers are not on the same scale”The spectrum of section 1 rates NC-42.5 and the same spectrum in section 2 rates RC-35. Nothing went wrong: they are different scales and must never be substituted for one another. NC by tangency is set by the single worst band wherever it falls (here the 250 Hz rumble), while the RC number is the arithmetic mean of the 500, 1000 and 2000 Hz levels and ignores everything else in its numeric part, moving the character of the spectrum into the tag instead. A rumbly spectrum therefore always rates worse on NC than on RC, and the size of the NC-minus-RC gap is itself a measure of the imbalance; a room where the two agree closely already follows the criterion shape. The specification rule follows: rate against whichever family the specification cites, report both when the client wants a diagnosis, and never claim compliance with an NC limit using an RC value, or the reverse.
The corollary is the one worth carrying away. Two rooms can share an NC rating and sound nothing alike:
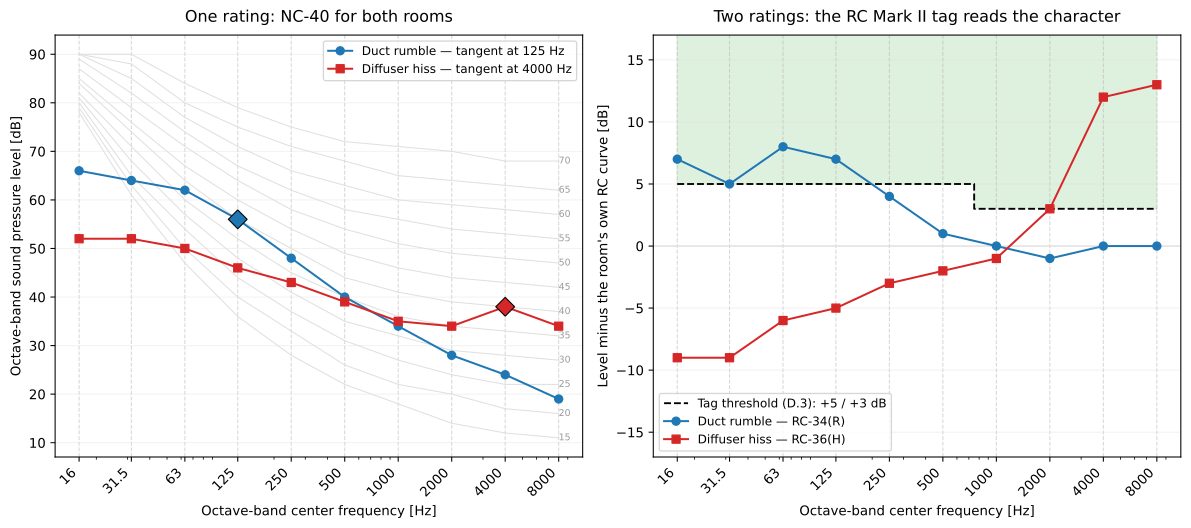
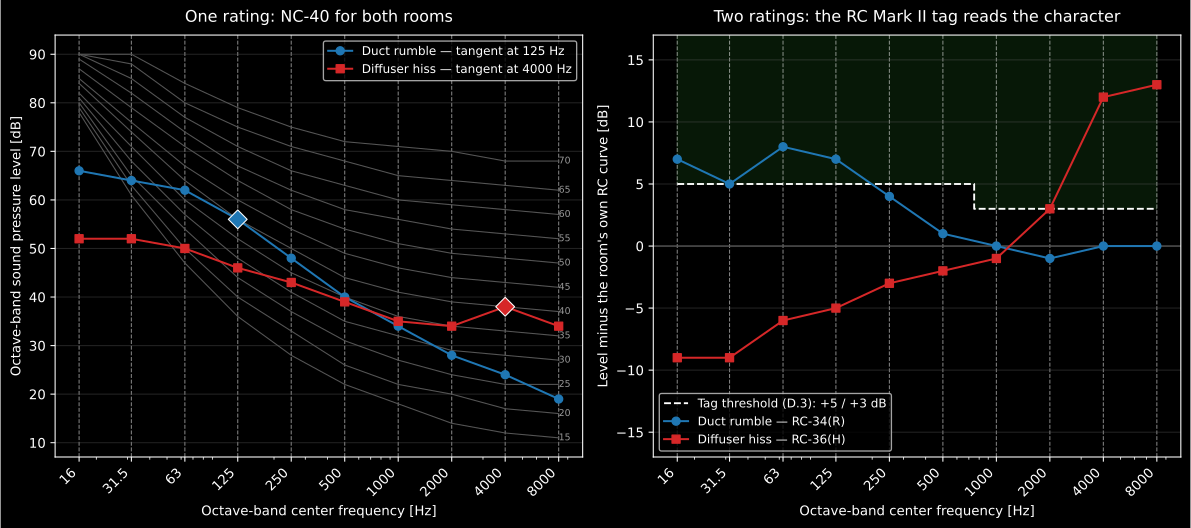
Both rooms are NC-40, and the tangency method has nothing left to say about the difference. The right panel plots each spectrum against its own RC reference curve: the duct-rumble room runs 7–8 dB over it below 250 Hz, the diffuser room 12–13 dB over it above 2 kHz, and the D.3 threshold turns that into one letter: RC-34(R) against RC-36(H).
Show the code for this figure
import matplotlib.pyplot as pltimport numpy as np# `room` is the import of the section 1 snippet above.
bands = np.array([16, 31.5, 63, 125, 250, 500, 1000, 2000, 4000, 8000])rumbly = np.array([66.0, 64.0, 62.0, 56.0, 48.0, 40.0, 34.0, 28.0, 24.0, 19.0])hissy = np.array([52.0, 52.0, 50.0, 46.0, 43.0, 39.0, 35.0, 34.0, 38.0, 34.0])
for spectrum in (rumbly, hissy):    nc, rc = room.noise_criterion(spectrum), room.room_criterion(spectrum)    print(nc.label, rc.label)     # NC-40 (125 Hz) RC-34(R) / NC-40 (4000 Hz) RC-36(H)
# The right panel: each spectrum against its own reference curve, with the# clause D.3 threshold as one step (+5 dB below 500 Hz, +3 dB above).threshold = np.where(bands <= 500.0, 5.0, 3.0)fig, ax = plt.subplots()ax.step(bands, threshold, where="mid", ls="--", color="k", label="Tag threshold")for spectrum, name in ((rumbly, "Duct rumble"), (hissy, "Diffuser hiss")):    rc = room.room_criterion(spectrum)    ax.plot(bands, spectrum - rc.reference_curve, "o-", label=f"{name} — {rc.label}")ax.set_xscale("log")ax.set_xlabel("Octave-band center frequency [Hz]")ax.set_ylabel("Level minus the room's own RC curve [dB]")ax.legend()plt.show()
The two ratings answer different questions, and a third family exists that this module deliberately does not implement:
- NC answers “does the room meet its limit, and which band breaks it?”. It is the compliance rating of North-American practice (specifications, codes, equipment schedules). The clause 5.2.2 SIL step anchors the designation to speech interference, but the moment any band exceeds the NC-(SIL) curve the tangency method takes over and is driven entirely by the single governing band. That is also its blind spot: two NC-40 rooms can sound completely different, one rumbly and one hissy, because tangency says nothing about spectral balance. Use NC when a specification cites it, and always report the governing band with a tangency rating, since it names the octave any fix must attack first.
- RC Mark II answers “how does the room sound, and what should be fixed?”. Its rating tracks speech interference through the mid-frequency average, and its reference slope of −5 dB per octave is the spectrum occupants describe as neutral, a bland ventilation background that is neither boomy nor sharp. The spectral tag then points at the offending frequency range. Reach for RC Mark II at HVAC design time, or to diagnose an installation that fails its NC limit.
- NR (Noise Rating), the curve family of Kosten & van Os (1962), is the European counterpart of NC: the same tangency logic over a slightly different curve family (more permissive at low frequency, stricter at high), common in European and international equipment and building specifications. phonometry does not implement NR; when a specification cites NR, rate against the NR curves themselves rather than substituting NC, because the two families diverge by several decibels away from the mid frequencies.
Reading the tag. The RC Mark II tag is a repair hint, not just a label.
A rumble tag (R, more than 5 dB over the reference at or below 500 Hz)
points at the air-handling plant: an oversized or starved fan, duct
rumble, or structure-borne vibration re-radiated by walls, and it is the
low-frequency energy that rattles lightweight construction and fatigues
occupants. A hiss tag (H, more than 3 dB over at or above 1000 Hz)
points at the terminal end: diffuser and grille face velocities or a
throttled damper close to the outlet, and it is the range that masks
speech. A neutral tag (N) means the level can still be wrong, but the
character is right: reduce the whole spectrum rather than reshape it, which
usually means more room absorption rather than more duct lining, so it hands
the problem to
Reverberation-time prediction
and
Sound absorption in enclosed spaces.
4. Room-noise reports (.report())
Section titled “4. Room-noise reports (.report())”Both ratings render a one-page PDF room-noise assessment fiche.
NCResult.report(path) and RCResult.report(path) share the same layout: a
standard-basis line, an optional metadata header block, the measured
octave-band levels beside the measured spectrum plotted against the NC/RC curve
family (the result’s own .plot()), the boxed rating, an optional verdict row
and a footer with the fixed disclaimer. The NC box shows the NC-nn
designation with the SIL and, for a tangency rating, its governing band
(>NC-70 / <NC-15 when the spectrum falls outside the Table 1 family); the
RC box shows RC-nn(tag) with the mid-frequency average
and the spectral quality. A lower rating is quieter, so a
requirement on the metadata (read as the maximum acceptable NC or RC rating)
passes at or below the target. Setting verbose=True adds the per-band NC
contour value read by the tangency method (NC), or the reference RC Mark II
curve and the measured deviation from it (RC). Both use the same
ReportMetadata container as the other fiches; the room-specific room_volume
and area populate the header alongside client, test_room, specimen,
instrumentation, the climate fields, measurement_standard, test_date,
laboratory, operator and report_id. Passing metadata=None produces a
bare assessment fiche. Rendering needs reportlab and, for the figure the fiche
embeds, matplotlib (pip install "phonometry[report,plot]"); only
engine="reportlab" is supported, and language="es" renders a Spanish fiche
(translated fixed strings and a comma decimal separator).
import numpy as npfrom phonometry import room, ReportMetadata
spl = np.array([79.0, 69.0, 59.0, 51.0, 50.0, 39.0, 36.0, 34.0, 33.0, 32.0])metadata = ReportMetadata(    test_room="Office A", room_volume=180.0, area=60.0,    measurement_standard="ANSI/ASA S12.2",    laboratory="Phonometry Reference Laboratory",    requirement=40.0,              # adds a verdict against a target rating)room.noise_criterion(spl).report("nc_fiche.pdf", metadata=metadata)room.room_criterion(spl).report("rc_fiche.pdf", metadata=metadata)
The example fiches are regenerated with make reports and kept rendered in the
repository; click a preview to open the PDF.
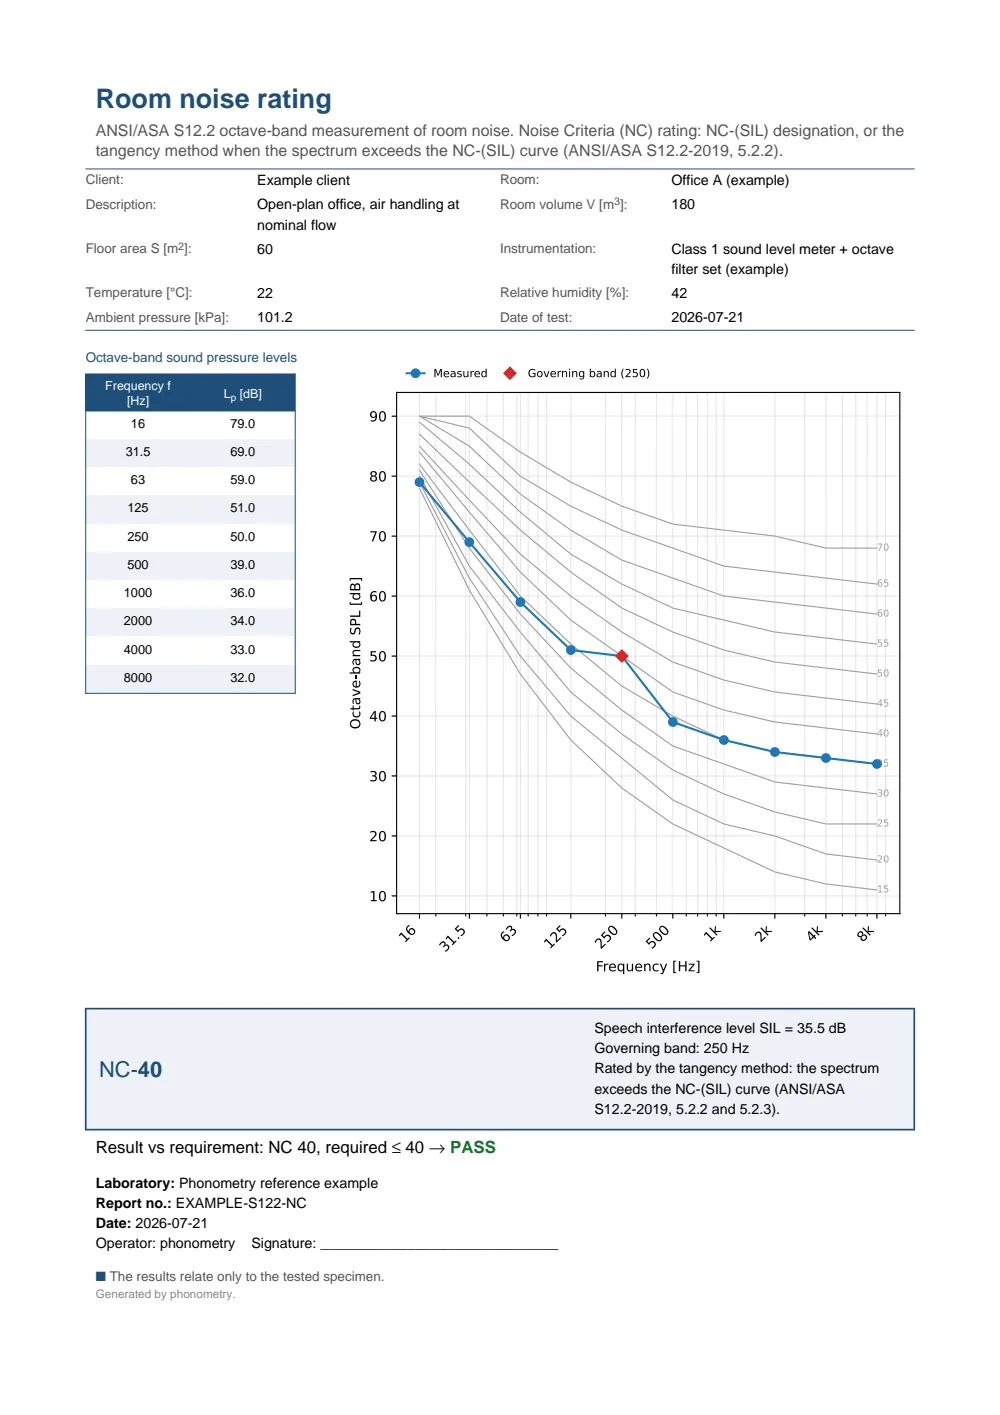
One-page room-noise assessment fiche: a metadata header (client, room, description, room volume, floor area, instrumentation and climate), the measured octave-band level table beside the measured spectrum over the NC curve family, and the boxed NC-40 rating with the 250 Hz governing band and a PASS verdict against a target of 40.
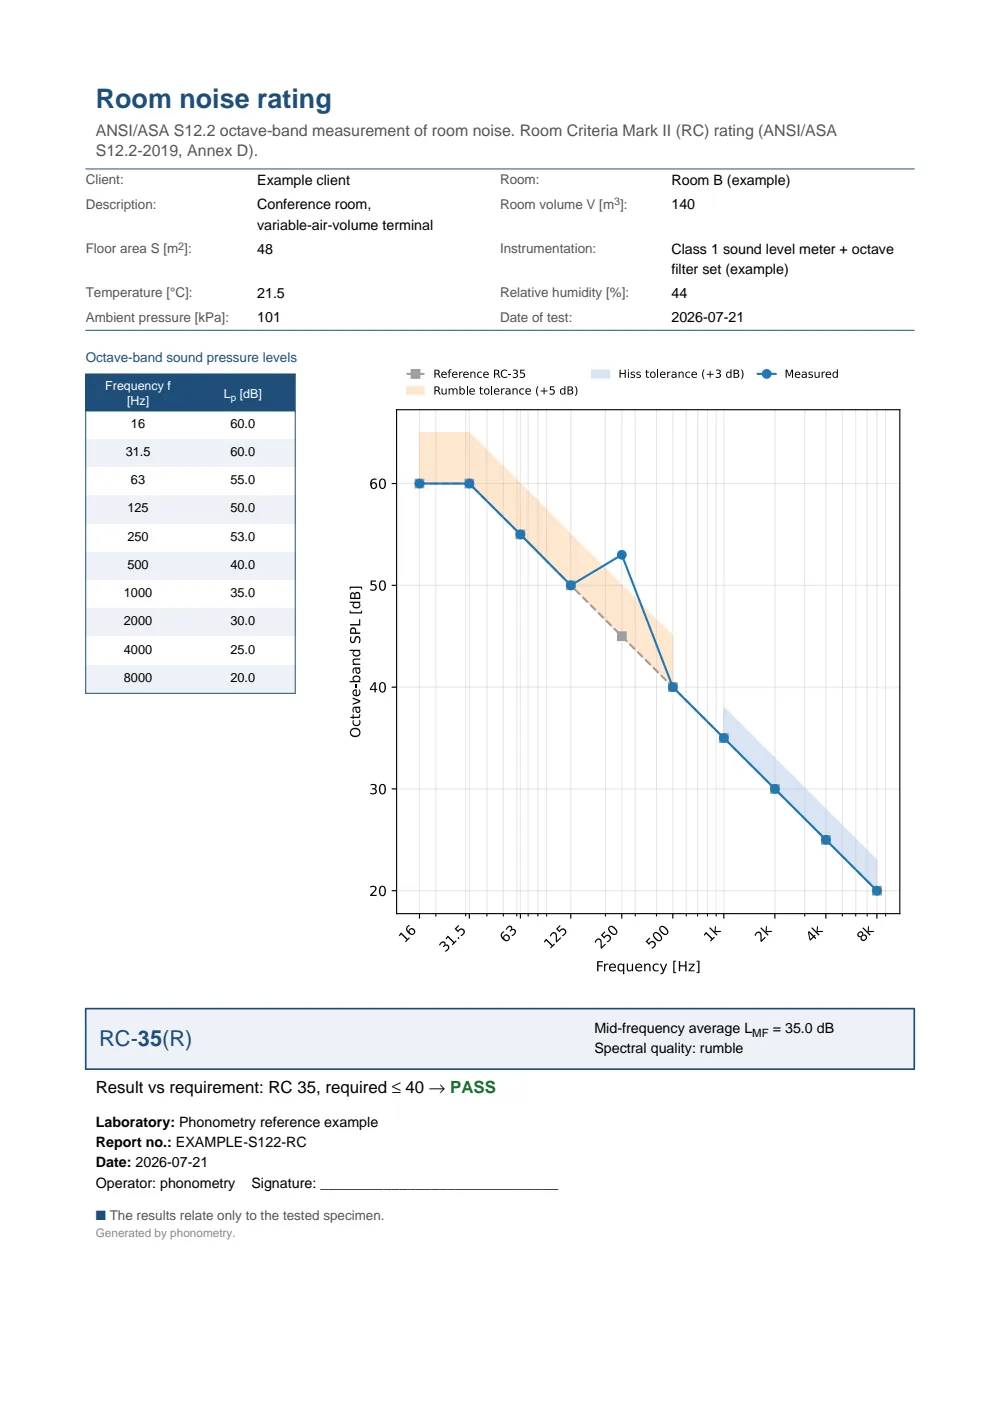
One-page room-noise assessment fiche: a metadata header, the measured octave-band level table beside the measured spectrum over the reference RC Mark II curve with the rumble and hiss tolerance bands shaded, and the boxed RC-35(R) rating with the mid-frequency average LMF and a rumble spectral quality.
What this guide covers
Section titled “What this guide covers”Covered
ANSI/ASA S12.2-2019 Table 1 and clauses 5.2.2/5.2.3 (the NC-(SIL) designation and the tangency method with its governing band) through
room.noise_criterion; and the informative Annex D RC Mark II family of Table D.1 (room.rc_curve) with the clause D.4 mid-frequency-average rating and the clause D.3 neutral/rumble/hiss tag, throughroom.room_criterion. Both work over the ten octave bands from 16 Hz to 8 kHz, and each result renders its own one-page fiche through.report(). The clause 5.2.5 measurement conditions, the clause 5.2.4 low-frequency-excess procedure and the Annex C / Annex D criterion tables are quoted here for planning and reading.Not covered
The clause 5.3.2 screening test is described in section 1 but not implemented: the reader must perform it, because a spectrum that fails it is outside the domain of both functions. The balanced noise criteria (NCB), the room noise criterion for fluctuating low-frequency noise (RNC, which needs a time series rather than a single spectrum), the vibration/rattle tag (, which needs the Table 6 test) and the numeric quality-assessment index (QAI, which the standard defers to external references) are not part of this module. Neither is the NR curve family (see section 3). The criterion tables are reproduced only as anchors: check the standard, or the national or client document that governs the job, before quoting a limit.
References
Section titled “References”- Acoustical Society of America. (2019). Criteria for evaluating room noise (ANSI/ASA S12.2-2019). The normative NC curves and tangency method (Table 1), plus, from the informative Annex D, the RC Mark II curves (Table D.1), the mid-frequency-average rating (clause D.4) and the neutral/rumble/hiss spectral tag (clause D.3), that this module implements.
- Beranek, L. L. (1957). Revised criteria for noise in buildings. Noise Control, 3(1), 19-27. https://doi.org/10.1121/1.2369239The paper that introduced the NC curves and the speech-interference reasoning behind them.
- Blazier, W. E. (1997). RC Mark II: A refined procedure for rating the noise of heating, ventilating, and air-conditioning (HVAC) systems in buildings. Noise Control Engineering Journal, 45(6), 243-250. https://doi.org/10.3397/1.2828446The refined RC procedure, with its neutral-spectrum rationale and the rumble/hiss regions, that ANSI/ASA S12.2 Annex D codifies.
- Kosten, C. W., & van Os, G. J. (1962). Community reaction criteria for external noises. The Control of Noise (National Physical Laboratory Symposium No. 12), 373-387. The paper that introduced the NR curve family the text contrasts with NC. Published by Her Majesty's Stationery Office; the linked record is the Open Library page.