Reporting and source qualification (ISO 3382-1)
Standards: ISO 3382IEC 61260Key references: Bradley 2011Witew et al. 2017
Most of ISO 3382-1 is about how to measure. This page is about the four tables it prints and the rules that go with them: what a source has to be before it may be used, how many seats a survey has to reach, how the bands are averaged into the one number a hall gets quoted by, and what the report shall say.
1. Qualifying the source
Section titled “1. Qualifying the source”A source that is not omnidirectional measures a different hall depending on which way it faces. Table 1 says how far from omnidirectional it may be, band by band, and 4.2.1 says how to find out.
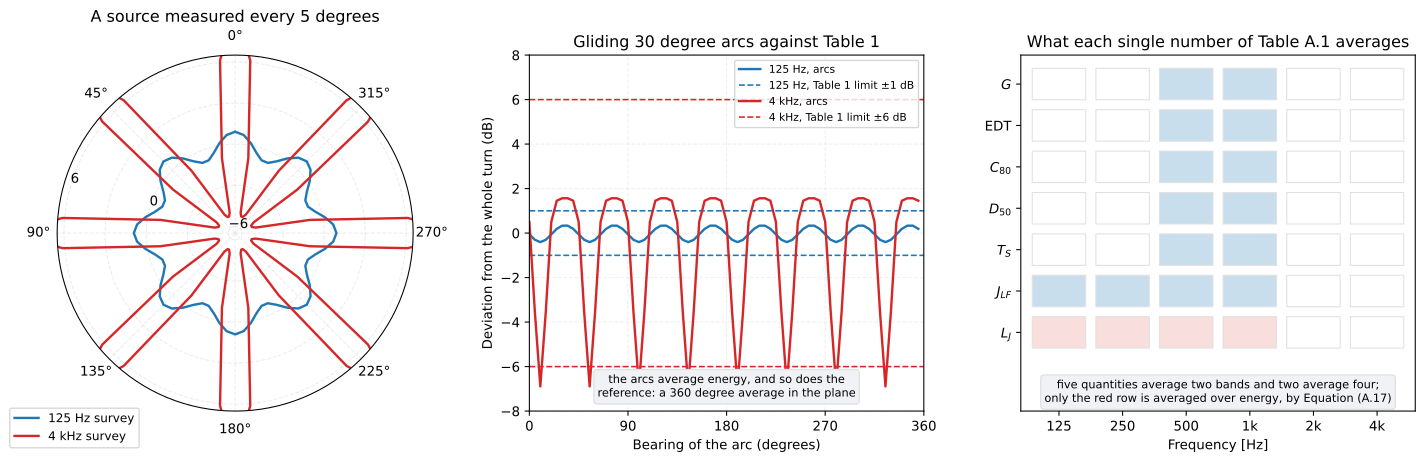
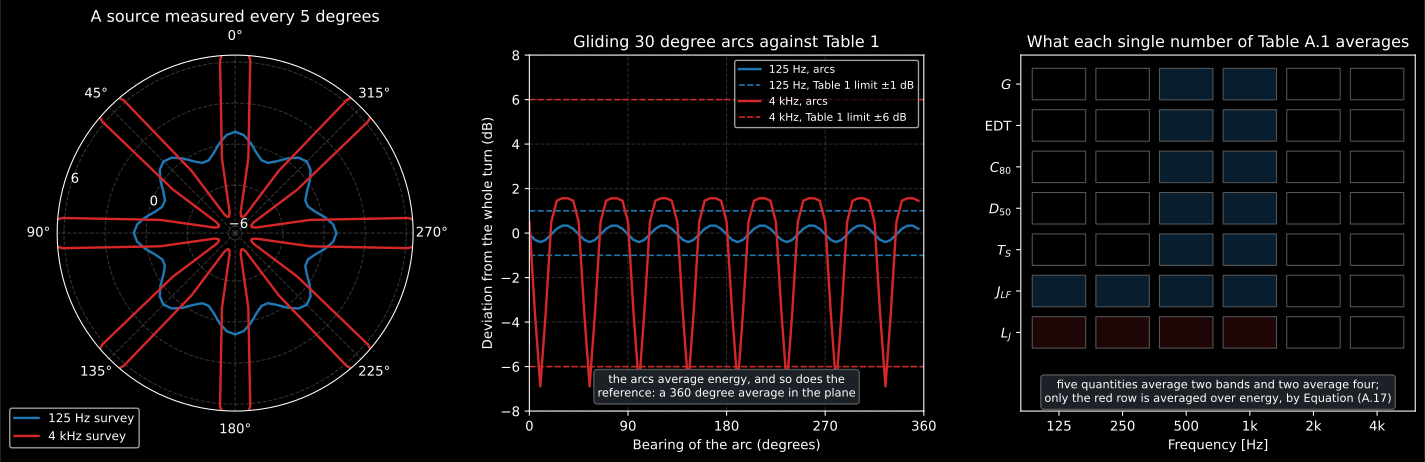
A source qualifies at 125 Hz and fails at 4 kHz, and Table A.1 does not average every quantity over the same bands.
The survey is made on a turntable, or from measurements every 5 degrees if there is none. Either way the readings are combined into gliding 30 degree arcs, and each arc is compared with a reference that is “a 360 degree energetic average in the measurement plane”. Source and microphone are at least 1,5 m apart throughout.
import numpy as npfrom phonometry import room
bearings = np.arange(72) * room.DIRECTIVITY_STEP_DEGpattern = 7.5 * np.cos(8.0 * np.deg2rad(bearings))pattern += 2.4 * np.cos(16.0 * np.deg2rad(bearings))
deviation = room.gliding_directivity_deviation(94.0 + pattern)print(round(float(np.max(np.abs(deviation))), 2))   # 6.89  dBprint(room.source_directivity_limit(4000.0))        # 6.0   dB
Table 1 prints six bands, 125 Hz to 4 kHz, and no more, so a survey in the 63 Hz or 8 kHz octave has no printed limit to be held to rather than the nearest one:
from phonometry import room
print(room.MAX_SOURCE_DIRECTIVITY_DEVIATION_DB)# {125.0: 1.0, 250.0: 1.0, 500.0: 1.0, 1000.0: 3.0, 2000.0: 5.0, 4000.0: 6.0}
Two things about that survey are not settled by what is printed. The
first is a contradiction: 4.2.1 and the caption of Table 1 both call its
values the maximum acceptable deviation, and A.4 calls them “the minimum
limits given in Table 1” when it asks for a marginal source to be measured
again at three orientations. Read literally, A.4 asks for the extra work on
the sources that need it least. The second is an omission: “gliding
averages, each covering six neighbouring points” does not say whether the
six lead, trail or straddle the arc they are reported against. Over a full
turn that is a relabelling, so it moves the bearing each deviation is
reported against by up to 15 degrees of the pattern and not the deviation
itself, but the bearing is what A.4 asks a marginal source to be turned
about. Both are in
the errata register, and
gliding_directivity_deviation says in its docstring which readings it took.
2. How many positions, and where
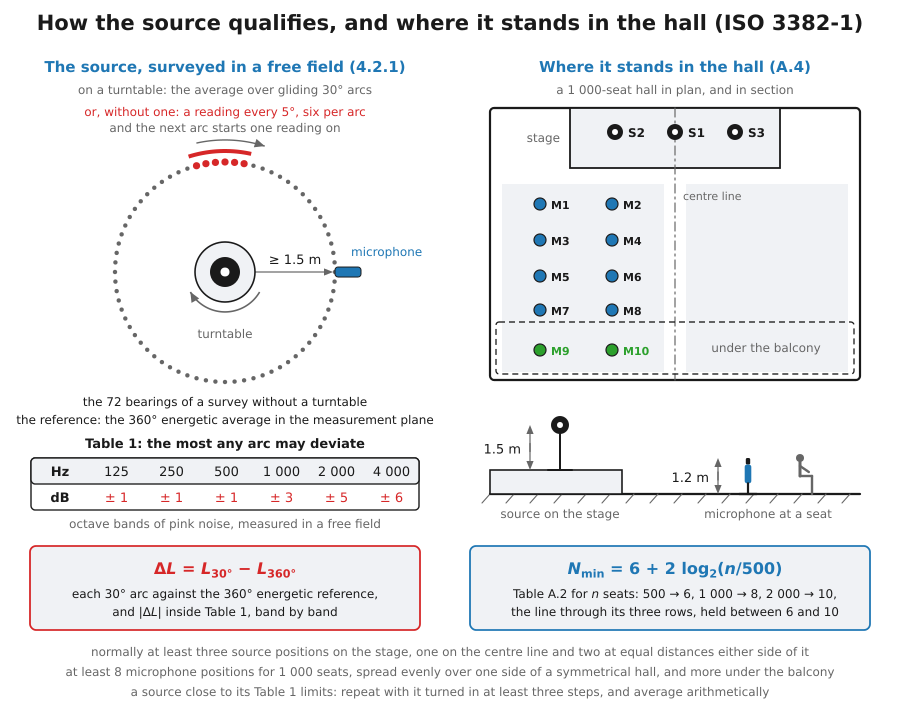
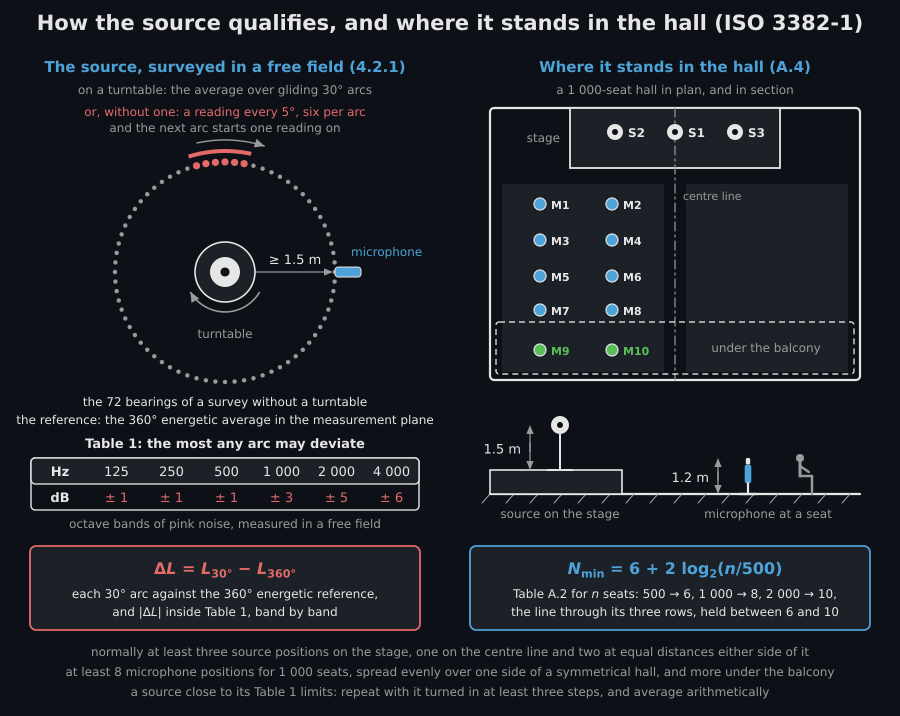
Section titled “2. How many positions, and where”Table A.2 prints three rows: 500 seats want 6 microphone positions, 1 000 want 8 and 2 000 want 10. They lie exactly on a straight line in the logarithm of the seat count, two positions per doubling, which is what lets a hall between the rows be answered at all.
from phonometry import room
print([round(float(room.minimum_receiver_positions(n)), 2)       for n in (500, 1000, 1400, 2000)])# [6.0, 8.0, 8.97, 10.0]print(round(float(room.minimum_receiver_positions(5000)), 2))   # 10.0
The line stops where the table does. A.4 asks for “a minimum of between 6 and 10 representative microphone positions”, so a 5 000-seat arena does not get thirteen positions on the strength of three rows, and a 200-seat studio does not get four. A.4 adds the geometry the table does not: at least three on-stage source positions in the normal case, a source height of 1,5 m, a microphone height of 1,2 m at audience seat locations, positions evenly distributed over all the seating, and more of them wherever a hall breaks into balconies and under-balcony areas.
How the measurement goes
Section titled “How the measurement goes”Qualify the source first. Drive it with octave bands of pink noise in a free field and keep the microphone at least 1,5 m away. On a turntable, average its output over gliding 30 degree arcs; without one, take a reading every 5 degrees and average six neighbouring readings into each arc. Every arc is then held against the 360 degree energetic average in the measurement plane: from 125 Hz to 4 kHz, none of them may leave Table 1.
Measure with a type 1 instrument to IEC 61672-1, IEC 61260 filters and an omnidirectional microphone, preferably with a diaphragm no more than 13 mm across, its sensitivity calibrated if is wanted. Normally use at least three source positions on the stage, more with a large stage or an orchestra pit, for instance one on the centre line and two at equal distances either side, with the acoustic centre 1,5 m above the floor. Take the minimum number of microphone positions from Table A.2, 6 for 500 seats up to 10 for 2 000, at 1,2 m above the floor at seats, about 2 m apart at least, spread evenly, and add more where balconies split the seating. Without synchronous averaging, hold the source at least 45 dB over the background in every band, or at least 35 dB when only is wanted, and average repeats of any response that does not repeat exactly. Measure a source close to its Table 1 limits again, turned in at least three steps, and average arithmetically. Report the source and microphone positions with their heights, preferably on a plan, the stage furnishing and the occupancy, and the rest of the fifteen items of 9.2.
3. The single number, and the two exceptions in it
Section titled “3. The single number, and the two exceptions in it”Every quantity in Annex A gets quoted as one number, and A.5 asks for the index “m” on the symbol when it is. What the “m” averages is not the same for every quantity: Table A.1 gives each row its own band set, and A.5 prints two examples for exactly that reason, over the 500 Hz and 1 kHz octaves and over four bands from 125 Hz.
import numpy as npfrom phonometry import room
octaves = np.array([125.0, 250.0, 500.0, 1000.0, 2000.0, 4000.0])strength = np.array([6.2, 5.4, 4.8, 4.4, 4.1, 3.6])lateral = np.array([0.20, 0.26, 0.31, 0.28, 0.24, 0.19])
print(round(room.single_number_average("G", strength, octaves), 4))    # 4.6print(round(room.single_number_average("J_LF", lateral, octaves), 4))  # 0.2625print(room.TABLE_A1["G"].averaging_bands_hz)      # (500.0, 1000.0)print(room.TABLE_A1["J_LF"].averaging_bands_hz)   # (125.0, 250.0, 500.0, 1000.0)
One of the seven rows carries two symbols. The table prints the early
lateral energy fraction as ” or ”, one
row for the two weightings of Equations (A.14) and (A.15), so
"J_LFC" is taken wherever "J_LF" is and reads the same
four bands, the same just-noticeable difference and the same range.
import numpy as npfrom phonometry import room
octaves = np.array([125.0, 250.0, 500.0, 1000.0, 2000.0, 4000.0])lateral = np.array([0.20, 0.26, 0.31, 0.28, 0.24, 0.19])
print(round(room.single_number_average("J_LFC", lateral, octaves), 4))  # 0.2625print(room.perceptibly_different("J_LFC", 0.20, 0.26))                  # True
Footnote a of the table makes one row an exception to the arithmetic: the late lateral sound level is energy averaged, through Equation (A.17). And two of its just-noticeable differences are not plain numbers either. The early decay time’s is printed as “Rel. 5 %”, a fraction of the value rather than a difference in seconds, so the same 60 ms means nothing in a two-second hall and is plain in a half-second one. The late lateral level’s is printed as “Not known”, and the library refuses to invent one.
from phonometry import room
print(room.perceptibly_different("EDT", 2.0, 2.06))    # Falseprint(room.perceptibly_different("EDT", 0.5, 0.56))    # Trueprint(room.TABLE_A1["L_J"].just_noticeable_difference) # None
A.5 also offers a coarser presentation, the octave pairs: 125 Hz with 250 Hz for a low-frequency result, 500 Hz with 1 kHz for a mid one, and 2 kHz with 4 kHz for a high one, all arithmetic. That is a different product from the single number and the two must not share a code path: they are the same two bands for the five monaural quantities and different band sets for the lateral ones.
import numpy as npfrom phonometry import room
octaves = np.array([125.0, 250.0, 500.0, 1000.0, 2000.0, 4000.0])lateral = np.array([0.20, 0.26, 0.31, 0.28, 0.24, 0.19])
pairs = room.octave_pair_averages(lateral, octaves)print({k: round(v, 4) for k, v in pairs.items()})# {'low': 0.23, 'mid': 0.295, 'high': 0.215}print(round(room.single_number_average("J_LF", lateral, octaves), 4))  # 0.2625
A.5 notes that lateral energy fractions in the 4 kHz octave are not usually thought to be subjectively important, so the high pair means little for them.
4. Two routes to a mid-frequency reverberation time
Section titled “4. Two routes to a mid-frequency reverberation time”Clause 9.1 prints two ways to quote one number for the reverberation time and no third: the average of over the 500 Hz and 1 kHz octave bands, or “averages over the six one-third-octave bands from 400 Hz to 1 250 Hz”.
from phonometry import room
print(room.MID_FREQUENCY_OCTAVES_HZ)# (500.0, 1000.0)print(room.MID_FREQUENCY_THIRD_OCTAVES_HZ)# (400.0, 500.0, 630.0, 800.0, 1000.0, 1250.0)
What a one-third-octave analysis must not do is average the two one-third-octave bands that happen to be called 500 Hz and 1 kHz. That is two thirds of an octave against the two octaves either printed route covers, a third of the band, and it is neither of them. The accredited fiche takes the six-band route when the analysis is in thirds and names it on the sheet.
5. What the report shall say
Section titled “5. What the report shall say”Clause 9 is normative, unlike every annex on this page, and 9.2 is its only
requirement about what is written down rather than what is measured. It
lists fifteen items, a) to o), and TEST_REPORT_ITEMS carries them in
order: the conformity statement, the room’s name, place, plan and volume,
its seating and upholstery, the shape and material of walls and ceiling, the
occupancy, the state of any variable equipment, the curtains in a theatre,
the stage furnishing, the temperature and humidity, the apparatus, the
signal, the coverage with its positions and heights, and the date and the
organization.
from phonometry import room
print(len(room.TEST_REPORT_ITEMS))     # 15print(room.TEST_REPORT_ITEMS[3])# volume of the room, with an explanation of how it is defined if the room# is not completely enclosed
Most of that is metadata rather than measurement, and it reaches the
accredited fiche through the ReportMetadata container the
room acoustic parameters page
fills in.
What this guide covers
Section titled “What this guide covers”Covered
The printed tables of ISO 3382-1:2009 and the rules around them: Table 1 with the gliding arc survey of 4.2.1, Table A.1 with its per-quantity averaging bands, its one energy-averaged row and its one relative just-noticeable difference, Table A.2 with the line its three rows lie on, the octave pairs of A.5, the two single-number routes of Clause 9.1, and the fifteen items Clause 9.2 says a test report shall include.
Not covered yet
The procedures around them: the three-orientation repeat A.4 asks of a source close to its Table 1 limits, the sectional averaging A.5 suggests for a large hall, and the plotting conventions of Clause 9.1, which are about paper rather than about numbers.
References
Section titled “References”- Bradley, J. S. (2011). Review of objective room acoustics measures and future needs. Applied Acoustics, 72(10), 713-720. https://doi.org/10.1016/j.apacoust.2011.04.004A review of what the Table A.1 quantities are for and how their just-noticeable differences came about.
- International Electrotechnical Commission. (2014). Electroacoustics — Octave-band and fractional-octave-band filters — Part 1: Specifications (IEC 61260-1:2014). The band centres every average on this page is taken over.
- International Organization for Standardization. (2009). Acoustics — Measurement of room acoustic parameters — Part 1: Performance spaces (ISO 3382-1:2009). Table 1 and 4.2.1, Table A.1, Table A.2 with A.4, A.5 and Clause 9: the tables and the reporting rules of this page.
- Witew, I. B., Behler, G. K., & Vorländer, M. (2017). About just noticeable differences for aspects of spatial impressions in concert halls. Acoustics Australia, 45(2), 195-202. https://doi.org/10.1007/s40857-017-0094-7Why Table A.1 prints no just-noticeable difference for the late lateral sound level.