Sound strength G (ISO 3382-1)
Standards: ISO 3382Key references: Barron 2009Barron & Lee 1988Lundeby et al. 1995
Reverberation time says what a hall does to energy over time. It says nothing about how loud the hall is: two rooms with the same T30 can sit 20 dB apart at the same seat. Sound strength, , is the quantity that closes that gap, and it is one of only two measures in ISO 3382-1 Table A.1 that a calibrated source is needed for, the other being the late lateral sound level, which is referred to the same free field. Everything else on the room acoustic parameters page (EDT, T20, T30, C50, C80, D50, ) is a decay time, a ratio of energies or a centre time read from one recording alone, and survives any gain you put in front of it. does not.
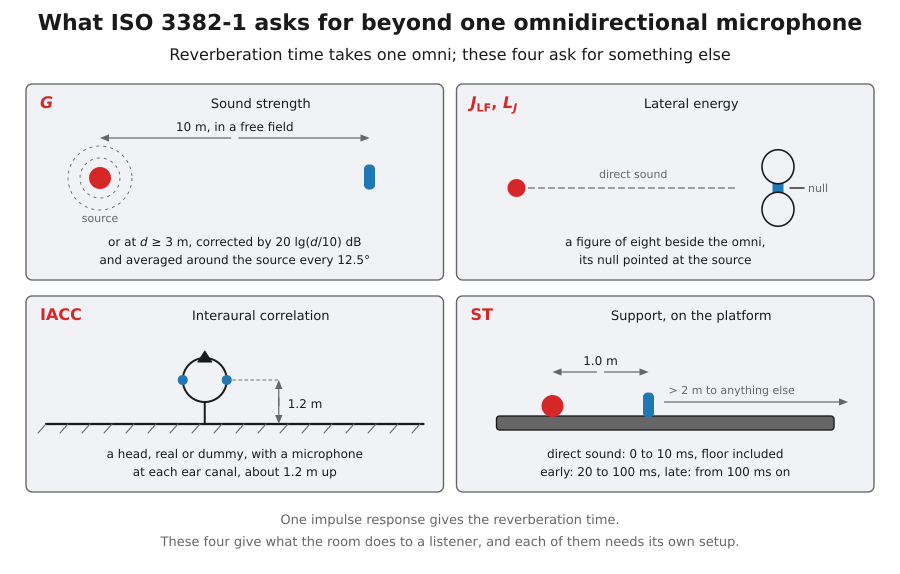
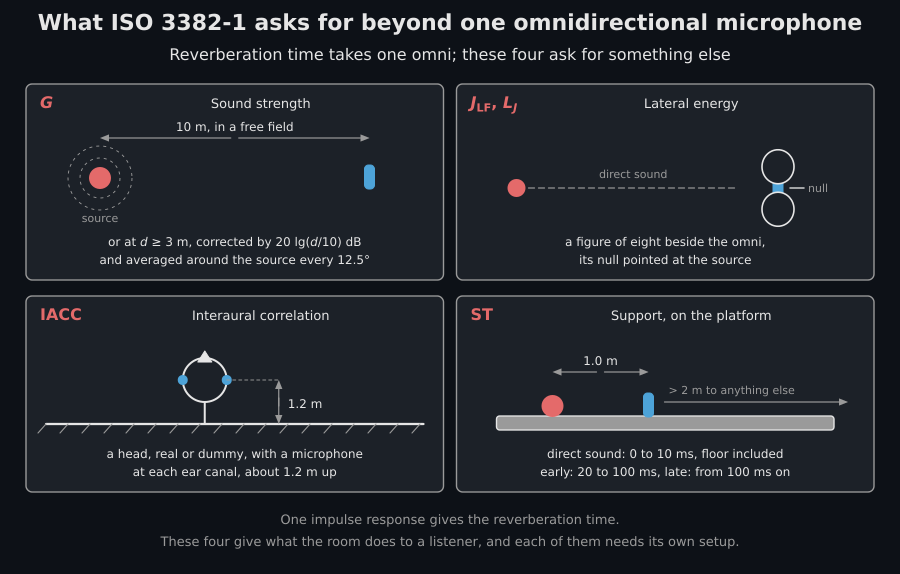
Only the first cell is this page: is the measure that needs a reference, and the reference is the same source at 10 m with no room around it.
1. What G is
Section titled “1. What G is”ISO 3382-1:2009, Equation (A.1) defines it as the energy of the measured impulse response against the energy the same source produces at 10 m in a free field:
Both integrals are sound pressure exposure levels, Equations (A.2) and (A.3), referred to s and µPa:
The reference quantities cancel in the ratio. They are there so that each half is a level in its own right, which is what makes the three routes of section 2 possible: you can obtain without ever measuring , and subtract it from a level you did measure.
import numpy as npfrom phonometry import room
fs = 48000rng = np.random.default_rng(3382)
# The source at 10 m in a free field: one arrival, taken as the unit.reference = np.zeros(int(0.2 * fs))reference[480] = 1.0
# The same source heard at 20 m in the hall: half the direct pressure, and a# reverberant tail carrying 2.8 times the free-field energy.t = np.arange(int(2.0 * fs)) / fsir = rng.standard_normal(t.size) * np.exp(-3.0 * np.log(10.0) * t / 1.8)ir *= np.sqrt(2.8 / np.sum(ir**2))ir[480] += 0.5
res = room.sound_strength(ir, reference, fs)print(res.frequencies.round(0))              # [ 126.  251.  501. 1000. 1995. 3981.]print(res.strength.round(1))               # [5.9 4.1 4.  4.8 4.7 4.9]  dB
res.plot()      # G against the Table A.1 typical range (needs matplotlib)
Time zero is the direct sound, not the start of the file. The trigger of A.3.4 is applied per band to both responses, so any propagation and system delay in the recording is removed on both sides and cancels.
The upper limit is the one to watch. A.2.1 asks the integral to reach at
least the point where the decay curve has fallen 30 dB, and puts no limit on
how much further it may go, so read literally it would let grow with the
length of the tape: everything past the decay is noise floor, and has no
compensating denominator to absorb it the way C80 and D50 do. The integral
is therefore truncated where the fitted decay meets the noise floor and the
missing tail compensated with the fitted rate, which is the treatment 5.3.3
Equation (3) prints for this same integral and which
decay_curve already gives
the same response. A synthetic response with no measurable noise floor is
integrated whole, so nothing moves for one.
Two things still need saying out loud, and sound_strength says them with
an AuditoriumWarning: a room response cut short of the 30 dB A.2.1 asks
for, and a response of either kind too short for its lowest band’s filter
to ring down. The second catches the reference more often than the room: a
free-field window of 40 ms after the arrival is 0.04 dB light at 125 Hz, one
of 20 ms is 0.9 dB light and one of 10 ms is 13 dB light, and nothing about
the recording says so.
2. Three printed routes to the reference
Section titled “2. Three printed routes to the reference”An anechoic room 10 m across is rare, so A.2.1 prints three ways to obtain without one.
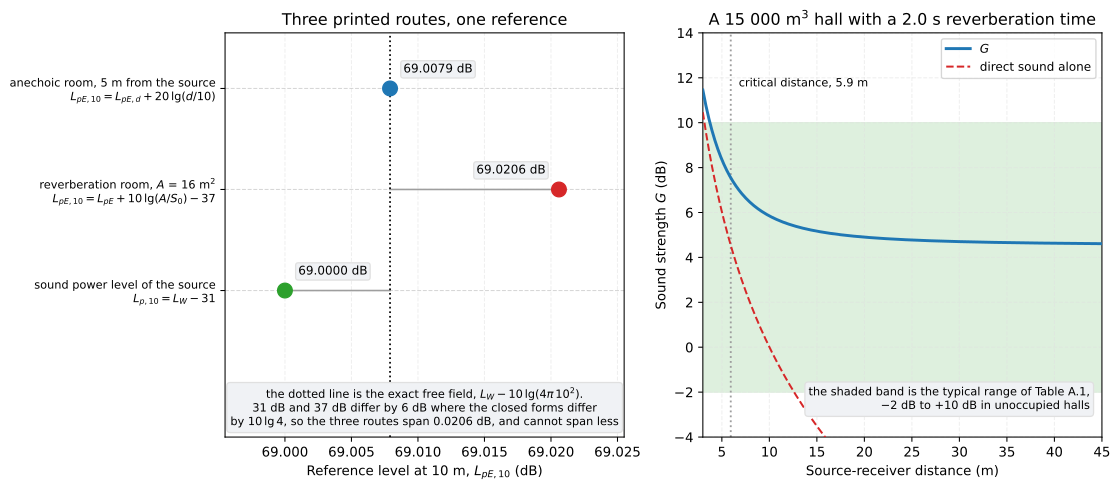
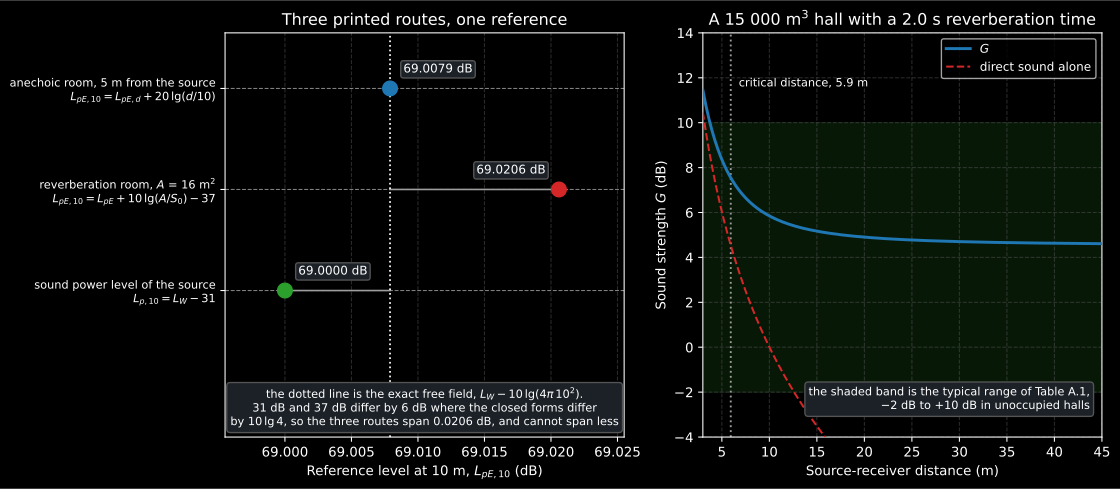
The same source, measured three ways. The spread on the left is 0.0206 dB and it is not a rounding error in the library: see section 3. The shaded band on the right is what Table A.1 gives for the single number, the mean of the 500 Hz and 1 kHz octaves, not for one band at a time.
Measure closer and correct. Equations (A.4) and (A.8) apply the inverse-square law from a distance m:
from phonometry import room
print(round(room.free_field_reference_level(75.03, 5.0), 4))   # 69.0094print(round(room.free_field_reference_level(83.4, 10.0), 4))   # 83.4  (the identity)
The note under (A.4) adds that the measurement is repeated around the
source and energy-averaged, so that the source’s own directivity does
not decide the reference. directivity_energy_average is that mean:
import numpy as npfrom phonometry import room
bearings = np.arange(29) * 2.0 * np.pi / 29.0levels = 80.0 + 20.0 * np.log10(np.abs(np.cos(bearings)) + 1e-12)# The energy mean of a cosine pattern is exactly 10 lg(1/2) below its peak,# whatever the bearing count; the arithmetic mean of the same decibels is not.print(round(room.directivity_energy_average(levels), 4))   # 76.9897print(round(float(np.mean(levels)), 1))                    # 74.2  (wrong: arithmetic)
Measure in a reverberation room. Equation (A.5) converts a diffuse-field reading into the free-field one through the room’s absorption area, with m²:
from phonometry import room
# A = 0,16 V / T (Equation (A.6)): 200 m3 at 3,2 s gives exactly 10 m2.print(round(room.reverberation_room_reference_level(80.0, 10.0), 4))   # 53.0
Watch the constant if you are reproducing a hand calculation. (A.6) prints
, which is at m/s, while
room.sabine_absorption_area defaults to 343 m/s and so to 0.1611. The
difference moves by 0.030 dB; pass
speed_of_sound=345.39 to get the printed constant back.
(A.5) also carries no Waterhouse correction, unlike the reverberation-room sound power method of ISO 3741 that it otherwise mirrors. The omitted is worth over a decibel in the 125 Hz band of a small room, above the 1 dB just-noticeable difference Table A.1 gives . That is a property of the printed method, and the library reproduces the method rather than quietly improving it.
Use the source’s sound power level. Equation (A.9) needs no free-field measurement at all:
from phonometry import room
print(round(room.sound_strength_from_power(80.0, 100.0), 4))   # 11.0
A.2.1 asks for to be measured to ISO 3741, which lives in Sound Power.
3. Why the routes cannot agree exactly
Section titled “3. Why the routes cannot agree exactly”The 31 dB of (A.9) is the spread of a point source over the sphere of radius 10 m and the 37 dB of (A.5) is the diffuse-to-free-field ratio at the same radius. Both are printed as whole decibels, and both roundings are correct:
The printed integers differ by exactly 6 dB. The closed forms differ by dB. So the reverberation-room route and the sound-power route describe the same physical situation and cannot agree to better than 0.0206 dB, whatever a library does. That is 2 % of the 1 dB just-noticeable difference of Table A.1, so it never matters in a hall; it matters when a test suite compares the two routes, which is why the conformance report pins the gap rather than tolerating it.
The library prints what the standard prints. A version that quietly used 30.9921 dB would disagree with every hand calculation done from the page.
Both closed forms also hold at a characteristic impedance of exactly 400 N·s·m⁻³, which is the value that makes the reference quantities consistent: pW, the reference sound power. Neither equation prints that caveat. Air at 20 °C and 101.325 kPa is nearer 413 N·s·m⁻³, worth 0.14 dB, an order of magnitude more than either rounding. The offsets are a convention of the decibel scales, not a property of the air in the hall, and the library does not make them follow the weather.
4. What G does in a hall
Section titled “4. What G does in a hall”The right-hand panel above is the plot A.5 itself suggests drawing: “some
measures such as sound strength, G, tend to vary with the distance, and a
graphical plot of G as a function of source-receiver distance can be
useful”. Near the source the direct field dominates and falls 6 dB per
doubling; past the critical distance the reverberant field takes over and
the curve flattens, at a level set by the room’s absorption alone. Table A.1
gives −2 dB to +10 dB as the typical range in unoccupied halls up to
25 000 m³ (for the single number, the arithmetic mean of the 500 Hz and
1 kHz octave bands), which is what the “m” of marks and what
res.plot() draws across the shaded band.
import numpy as npfrom phonometry import room
volume, surface, reverberation = 15000.0, 3800.0, 2.0area = float(room.sabine_absorption_area(volume, reverberation))constant = float(room.room_constant(surface, area / surface))level = room.steady_state_spl(100.0, [10.0, 20.0, 40.0], constant)print(np.round(room.sound_strength_from_power(level, 100.0), 1))   # [5.8 4.9 4.6]print(round(float(room.critical_distance(constant)), 1))           # 5.9  m
Show the code for this figure
import matplotlib.pyplot as pltimport numpy as npfrom phonometry import room
power_level = 100.0absorption_area = 0.16 * 200.0 / 2.0diffuse_level = power_level + 10.0 * np.log10(4.0 / absorption_area)level_at_5m = power_level - 10.0 * np.log10(4.0 * np.pi * 25.0)
routes = [    ("anechoic room, 5 m", float(room.free_field_reference_level(level_at_5m, 5.0))),    (        "reverberation room",        float(room.reverberation_room_reference_level(diffuse_level, absorption_area)),    ),    ("sound power level", power_level - room.SOUND_STRENGTH_POWER_OFFSET_DB),]exact = power_level - 10.0 * np.log10(4.0 * np.pi * 100.0)
fig, (left, right) = plt.subplots(1, 2, figsize=(11.8, 5.2))for position, (label, value) in enumerate(routes[::-1]):    left.plot([exact, value], [position, position], color="grey", lw=1.2)    left.plot([value], [position], "o", markersize=11)    left.annotate(f"{value:.4f} dB", (value, position), textcoords="offset points",                  xytext=(0, 13), ha="center")left.axvline(exact, color="black", ls=":", lw=1.3)left.set_yticks(range(len(routes)))left.set_yticklabels([label for label, _ in routes[::-1]])left.set_xlabel("Reference level at 10 m, $L_{pE,10}$ (dB)")left.set_title("Three printed routes, one reference")
volume, surface, reverberation = 15000.0, 3800.0, 2.0area = float(room.sabine_absorption_area(volume, reverberation))constant = float(room.room_constant(surface, area / surface))distance = np.linspace(3.0, 45.0, 400)strength = room.sound_strength_from_power(    room.steady_state_spl(power_level, distance, constant), power_level)direct = room.sound_strength_from_power(    power_level + 10.0 * np.log10(1.0 / (4.0 * np.pi * distance**2)), power_level)right.axhspan(-2.0, 10.0, color="#2ca02c", alpha=0.15)right.plot(distance, strength, lw=2.2, label="$G$")right.plot(distance, direct, ls="--", lw=1.5, label="direct sound alone")right.axvline(float(room.critical_distance(constant)), color="grey", ls=":", lw=1.4)right.set_xlim(3.0, 45.0)right.set_ylim(-4.0, 14.0)right.set_xlabel("Source-receiver distance (m)")right.set_ylabel("Sound strength $G$ (dB)")right.legend()plt.tight_layout()plt.show()
Classical theory flattens the curve completely. Real halls do not: Barron and Lee measured a reverberant level that keeps falling with distance, because the sound arriving at a far seat has taken longer to get there and has been absorbed on the way. The curve above is the classical one, and it reads as the optimistic bound on a real measurement.
5. The calibration that has to be shared
Section titled “5. The calibration that has to be shared” is a difference of two absolute levels, so it only survives a gain that
is applied to both recordings. sound_strength computes both exposure
levels from the responses it is given, so:
- a common calibration factor on the pair cancels exactly, and the conformance report has a row holding it to that;
- a factor on one of them does not cancel, and shows up as a straight offset in every band of ;
- when the reference arrives as a level rather than as a response, the hall recording carries the calibration alone and must be an absolute one.
A bare NumPy array is read as pascals. A
Signal brings its own calibration factor and
it is applied before the integral.
6. Where this sits
Section titled “6. Where this sits”belongs to the group of Table A.1 quantities the library measures from an impulse response. The decay times and energy ratios are in Room Acoustic Parameters; acquiring the response itself, with the source and microphone positions ISO 3382-1 asks for, is in Measuring the Room Impulse Response.
What this guide covers
Section titled “What this guide covers”Covered
The sound strength of ISO 3382-1:2009, A.2.1: the energy ratio of Equation (A.1) measured from a pair of impulse responses, the sound pressure exposure level of Equations (A.2) and (A.3), the inverse-square correction of Equations (A.4) and (A.8) with the printed 3 m minimum, the reverberation-room route of Equation (A.5), the sound-power route of Equation (A.9), and the energy mean over bearings the note under (A.4) asks for.
Not covered yet
The rest of Annex A and its neighbours: the stage support of Annex C, the measurement uncertainty of Clause 7, and the source directivity qualification of Table 1. The lateral energy measures of A.2.4 and A.2.5 and the interaural cross correlation of Annex B have a guide of their own, Spatial impression.
References
Section titled “References”- Barron, M. (2009). Auditorium acoustics and architectural design (2nd ed.). Spon Press. Where the sound strength came from as a design quantity, and how it behaves with distance in a real hall.
- Barron, M., & Lee, L.-J. (1988). Energy relations in concert auditoriums. I. The Journal of the Acoustical Society of America, 84(2), 618-628. https://doi.org/10.1121/1.396840The measured departure from classical theory that explains why G keeps falling past the critical distance in a real hall.
- International Organization for Standardization. (2009). Acoustics — Measurement of room acoustic parameters — Part 1: Performance spaces (ISO 3382-1:2009). Annex A.2.1 and Equations (A.1) to (A.9): the definition of the sound strength and every printed route to its free-field reference.
- Lundeby, A., Vigran, T. E., Bietz, H., & Vorländer, M. (1995). Uncertainties of measurements in room acoustics. Acta Acustica united with Acustica, 81(4), 344-355. The measurement uncertainties behind the integration-limit and calibration cautions of this page.