Sound Insulation Survey Method (ISO 10052)
Standards: ISO 10052Key references: Vigran 2008
Not every question deserves a full engineering measurement. When a dispute needs a number this afternoon, ISO 10052 trades accuracy for speed: octave bands, a hand-held meter and one correction index instead of per-band reverberation times. This guide covers the survey (control) method: the reverberation index and its room-class estimate, the airborne, impact, façade and service-equipment quantities, and the survey fiches. The engineering-grade methods live in Field Insulation Measurement (ISO 16283); the single-number engines behind the survey ratings in Insulation Ratings (ISO 717).
Octave bands and the reverberation index
Section titled “Octave bands and the reverberation index”One number replaces the whole receiving-room correction. Where the engineering methods carry a measured reverberation time per band into every quantity, ISO 10052 collapses that correction into the reverberation index (), which may be measured but is normally read off a table from the room’s construction and volume. Every survey quantity is then an addition or subtraction of :
with and the receiving-room volume. The two normalized quantities carry the same term with opposite signs, because a level difference improves when the receiving room is more absorbent and an impact level falls. Where the common partition area has not been measured, the survey method substitutes for when that is larger, being the volume of the receiving room, which should be the smaller of the pair (Clause 3.6). It is a default partition area inferred from typical dwelling proportions, and because it can only raise it can only raise relative to a measured area; state in the report when it was used, together with the case Clause 3.6 also flags, a common area below 10 m². The clause references follow ISO 10052:2021; the formulas and the reverberation-index table are identical in the harmonized EN ISO 10052:2004+A1:2010.
The reverberation index is either measured (feed the reverberation time to
reverberation_index(T)) or, in a control survey, estimated from the room
type and volume with estimate_reverberation_index(V, room): furnished
"kitchen" / "bathroom" / "furnished", or the unfurnished construction
classes "a"–"h" and the mixed "a+e"…"d+h". Clause 6.5 splits that in
two: Table 3 classifies the room and gives it its letter, Table 4
turns the letter and the volume into the index. A fourth quantity unique to
this method is service-equipment noise , the energy average of
three A- or C-weighted measurements taken to a fixed positional recipe set out
under Running the survey.
The letters are not arbitrary: Table 3 is a 2 × 2 × 2 grid over the weight of the walls and ceiling, the hardness of the floor covering and the weight of the floor construction.
| Walls and ceiling | Soft covering, light floor | Soft covering, heavy floor | Hard covering, light floor | Hard covering, heavy floor |
|---|---|---|---|---|
| Light | a | b | c | d |
| Heavy | e | f | g | h |
A light wall is plasterboard or timber studwork, and a heavy wall carrying
a plasterboard lining counts as light; a heavy wall is unlined masonry or
block. A light floor is planks or boards on timber beams, a heavy
floor a concrete slab. The covering is carpet (soft) against tiles or
timber flooring (hard). Where the room mixes two constructions over roughly
equal areas, average the two letters: that is what the mixed classes
"a+e"…"d+h" are; where one construction clearly dominates by area, use its
letter alone. Note that the covering and the floor construction are two
separate axes, so “a hard floor” on its own does not pick a class.
Table 4 comes from a statistical survey of European dwellings built between 1960 and 1980 (NOTE 1): the standard deviation of the tabulated indices is about 1 dB, and the table is valid for and rooms up to 150 m³. Changed construction methods or habitation habits can shift it systematically, so measure when the result has to hold up.
import numpy as npfrom phonometry import building
# Octave-band levels (125-2000 Hz) and the measured receiving-room T.l1 = np.array([88.0, 90.0, 92.0, 92.0, 90.0])l2 = np.array([55.0, 51.0, 47.0, 41.0, 35.0])k = building.reverberation_index([0.70, 0.60, 0.50, 0.45, 0.40])   # k = 10 lg(T/0.5)res = building.survey_airborne_insulation(l1, l2, k, volume=50.0, area=12.0)print(np.round(res.d_nt, 1))          # [34.5 39.8 45.  50.5 54. ]  DnT = D + kprint(res.rating.rating, res.rating.c)        # 49 -1  ->  DnT,w (C)print(res.r_prime_rating.rating)               # 48  ->  R'w
# No reverberation time measured? Classify with Table 3, then read Table 4:# heavy masonry walls, concrete slab, tiled floor, 35-60 m3 -> class "h".k_est = building.estimate_reverberation_index(50.0, "h")print(k_est)                                   # [5.  5.5 6.  5.  5.5]
# Service-equipment noise: one corner measurement then two central ones# (Clause 6.3.4), each over a separate full operating cycle.se = building.survey_service_equipment_level(    [35.0, 30.0, 32.0],          # position 1 (corner), then two at position 2    reverberation_index=3.0,     # scalar k = 3 dB, i.e. T ~ 1 s    volume=50.0,)print(round(float(se.l_xy), 1), round(float(se.l_xy_nt), 1))   # 32.8 29.8
res.plot()   # DnT vs shifted ISO 717-1 reference (needs matplotlib)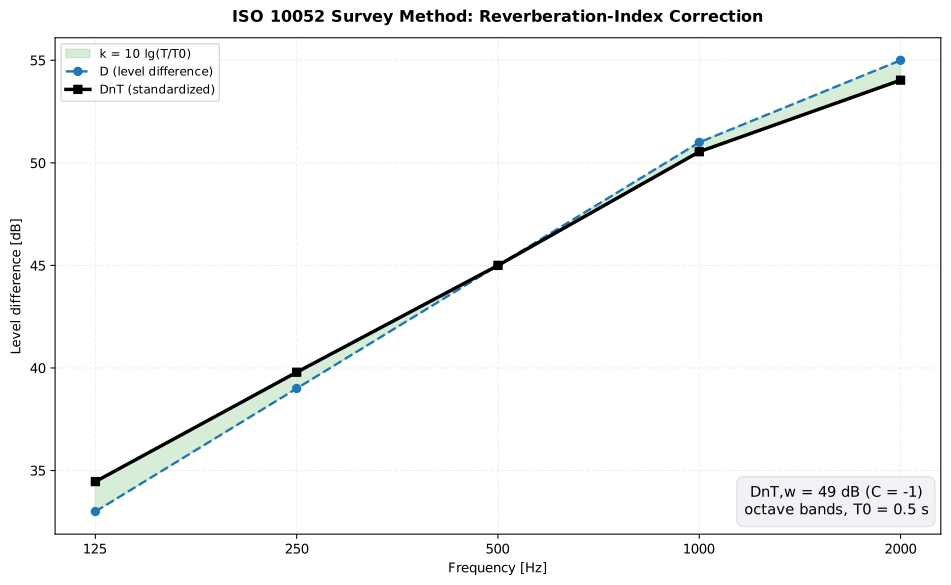
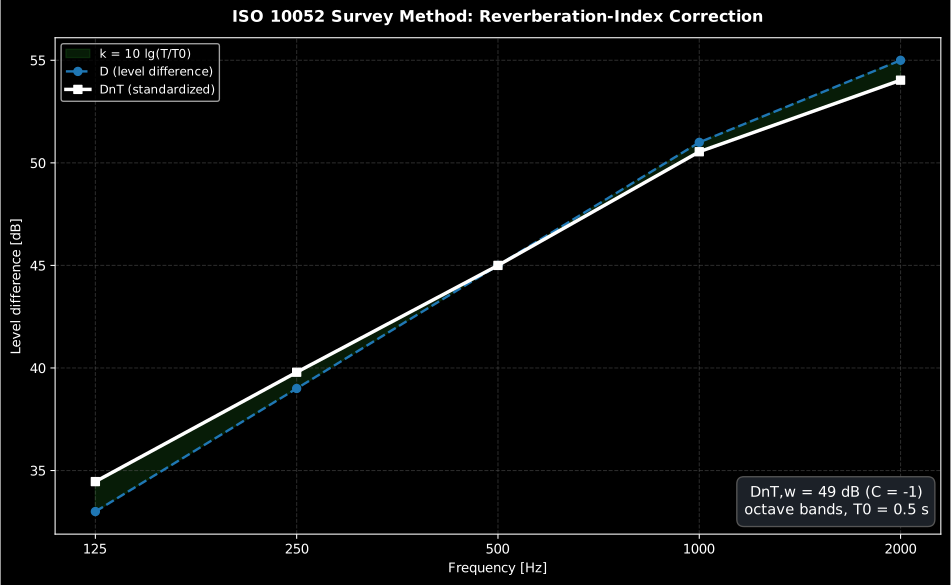
The reverberation index shifts the raw level difference into the standardized : up where the room is live (), down where it is dead. The automatic rating is formed only for exactly 5 octave (or 16 one-third-octave) values.
Show the code for this figure
import matplotlib.pyplot as pltimport numpy as npfrom phonometry import building
# Octave-band levels (125-2000 Hz) and the measured receiving-room T.bands = [125, 250, 500, 1000, 2000]l1 = np.array([88.0, 90.0, 92.0, 92.0, 90.0])l2 = np.array([55.0, 51.0, 47.0, 41.0, 35.0])k = building.reverberation_index([0.70, 0.60, 0.50, 0.45, 0.40])   # k = 10 lg(T/0.5)res = building.survey_airborne_insulation(l1, l2, k, volume=50.0)
x = np.arange(len(bands))fig, ax = plt.subplots()ax.fill_between(x, res.d, res.d_nt, alpha=0.2, label="k = 10 log10(T/T0)")ax.plot(x, res.d, "--o", label="D (level difference)")ax.plot(x, res.d_nt, "-s", label="DnT (standardized)")ax.set_xticks(x, [str(b) for b in bands])ax.set(xlabel="Frequency [Hz]", ylabel="Level difference [dB]",       title=f"ISO 10052 survey method: DnT,w = {res.rating.rating} dB")ax.legend()plt.show()
survey_airborne_insulation() and friends: parameters
Section titled “survey_airborne_insulation() and friends: parameters”| Parameter | Type | Units | Range / default | Notes |
|---|---|---|---|---|
l1 / l2 | 1D or 2D array | dB | one/band, or (positions, bands) | Source / receiving (or outdoor l1_2m) levels |
li | 1D or 2D array | dB | one/band, or (positions, bands) | Impact levels (energy-averaged over positions) |
reverberation_index | scalar or 1D array | dB | one per band | from reverberation_index or estimate_reverberation_index; survey_service_equipment_level() also accepts a scalar |
volume | float | m³ | > 0 | Receiving-room (for / / / normalized) |
area | float | m² | > 0 | Common-partition (airborne ; rule applied) |
measurements | array | dB | exactly 3 | Service-equipment positions (survey_service_equipment_level) |
room | str | — | "kitchen"/"bathroom"/"furnished"/"a"–"h"/"a+e"… | estimate_reverberation_index room class (Table 3; the index itself is Table 4) |
survey_airborne_insulation() returns a SurveyAirborneResult (d, d_nt,
d_n, r_prime, rating, r_prime_rating); survey_impact_insulation() a
SurveyImpactResult (l_i, l_nt, l_n, rating);
survey_facade_insulation() a SurveyFacadeResult (d_2m, d_2m_nt,
d_2m_n, rating); survey_service_equipment_level() a
SurveyServiceEquipmentResult (l_xy, l_xy_nt, l_xy_n).
Running the survey (Clauses 5 and 6)
Section titled “Running the survey (Clauses 5 and 6)”Everything above consumes band levels. What separates ISO 10052 from ISO 16283 is not the arithmetic, which is simpler, but how those levels are obtained: a body posture, a sweep and a stopwatch instead of five fixed microphone positions per room. The procedure is short enough to quote in full.
The instrument (Clause 5). A sound level meter of class 1 or class 2 to IEC 61672-1, with filters to IEC 61260, adjusted with a calibrator before each measurement so the readings are absolute levels. The microphone must be a diffuse-field type; a free-field microphone needs its diffuse-field correction applied. The tapping machine and the rubber ball must meet ISO 10140-5:2021 Annexes E and F and ISO 16283-2:2020 Annex A. Doors and windows are closed and shutters normally open throughout (Clause 6.1).
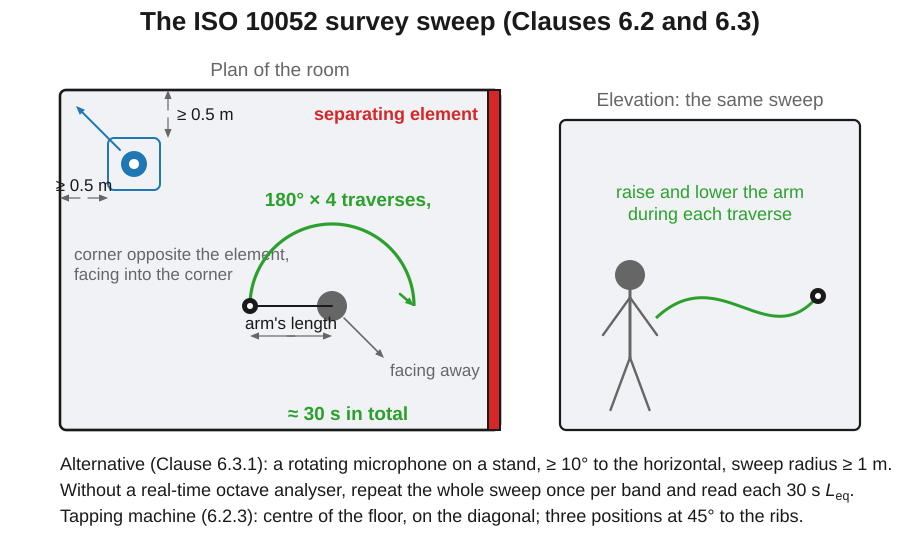
The source, between rooms (Clause 6.2.2). Steady noise with a continuous spectrum; octave-band-filtered noise is allowed, and a broadband spectrum may be shaped to buy signal-to-noise at high frequencies in the receiving room. Place the loudspeaker in a corner of the room opposite the separating element, at least 0.5 m from the walls, and if it is a single loudspeaker system, facing into the corner. Several sources may run at once provided they are of the same type, driven at the same level by similar but uncorrelated signals; several loudspeakers inside one enclosure must be driven in phase. Test a vertical pair from the lower room and an unequal horizontal pair from the larger room, unless the other direction was agreed beforehand.
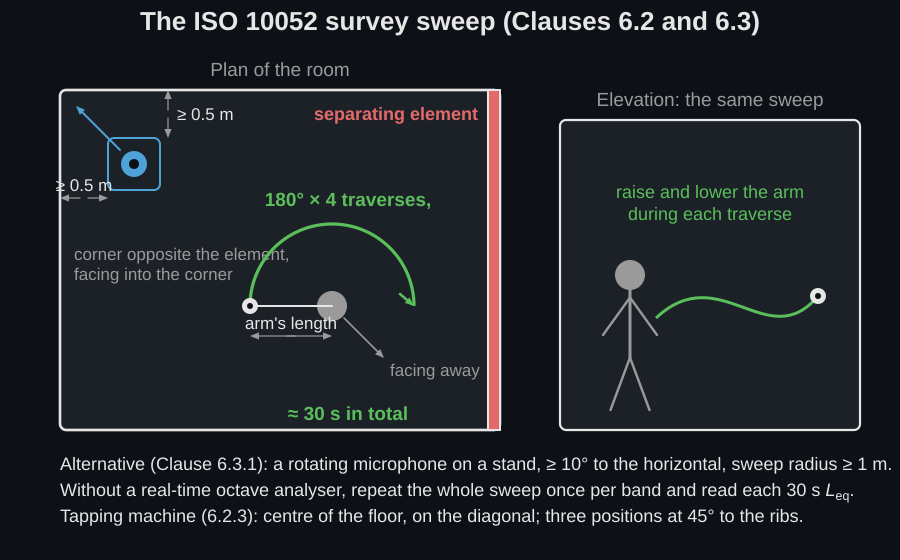
The sweep (Clause 6.3.1). Airborne insulation needs the average level in both rooms, impact insulation only in the receiving room. In each, stand near the centre of the floor facing away from the loudspeaker (source room) or from the separating element (receiving room), hold the meter out at arm’s length, and move the microphone four times horizontally through 180°, raising and lowering the arm gently during each traverse. The four rotations take about 30 s in total, which is also the integration time. A rotating microphone on a stand is the accepted alternative: at least 10° to the horizontal, sweep radius at least 1 m. Without a real-time octave analyser, repeat the whole sweep once per band and read each 30 s .
The tapping machine (Clause 6.2.3). Near the centre of the floor in the source room, with the hammer line on the room diagonal. One position is enough for an isotropic floor and slab. On a ribbed or beamed floor add two more, so that three positions are randomly distributed over the floor area, with the hammer line at 45° to the ribs and every position at least 0.5 m from the edges of the floor.
The rubber ball (Clause 6.3.2). The heavy/soft branch measures the Fast-weighted maximum level in octave bands, about 10 s per measurement, from at least two fixed positions (one near the centre and one at a different height), separated by more than 0.7 m, at least 0.5 m from any boundary and at least 1.0 m from the impact position, averaged over positions band by band. Its single number is the ISO 717-2:2020 Annex D A-weighted sum, not a shifted reference curve; see Heavy and Soft Impact Sources. Wear hearing protection when measuring in the source room.
The façade (Clauses 6.2.4 and 6.3.3). With a loudspeaker, place it outside at an angle of incidence as close to 45° as possible, preferably on the ground, with the slant distance from the source to the centre of the test specimen at least 7 m ( m from the façade) and the position chosen so that the level varies as little as possible over the specimen: under 5 dB per band across the whole façade (Clause 5). The outdoor microphone sits m from the plane of the façade, or further out if that is what it takes to keep 1 m of clearance from the nearest part of the façade, a balustrade for instance. Integrate 30 s inside and out. With road traffic instead, measure the two sides simultaneously over 60 s with at least 15 vehicles passing, repeating the indoor sweep through that period; three or five fixed positions are sometimes necessary.
Service equipment (Clause 6.3.4). Two fixed positions, three measurements. Position 1 is close to the apparently hardest surfaces of the room, preferably 0.5 m from the walls and from the floor or ceiling, in practice a corner. Position 2 is in the reverberant field, the central area of the room. Take one measurement at position 1 and two at position 2, each covering one full operating cycle under normal conditions, and each on a separate cycle. No position may be closer than 1.5 m to a source such as a ventilation outlet. Dropping the corner position and taking three central ones is the easiest way to bias this quantity low.
The band set (Clause 6.4, Table 2). Airborne insulation and tapping-machine impact insulation are measured in the five octave bands from 125 Hz to 2000 Hz; the heavy/soft impact source uses 63 Hz to 500 Hz, which is why 63 Hz appears there and nowhere else. Service-equipment noise is a single A- or C-weighted level over 63 Hz to 8000 Hz with the stated time weighting.
Background noise: a floor to meet, not a correction to apply
Section titled “Background noise: a floor to meet, not a correction to apply”Unlike the engineering methods, the survey method never corrects for
background noise (Clause 6.2.1). It fixes a signal-to-noise floor instead:
adjust the source so that the receiving-room level exceeds the background by
at least 6 dB in every band, checked by switching the source on and off before
the run. Where the margin still falls below 6 dB, record the uncorrected level
and state in the report that the level difference is underestimated (or, for
service equipment, that the level is overestimated) by an unknown amount.
That is why no correction call appears anywhere on this page:
building.background_correction implements the ISO 10140-4 laboratory rule
and must not be applied to survey data. Earlier revisions of this guide said
the opposite, listing the correction as the caller’s job; a survey corrected
that way is non-conforming and over-reports the insulation.
The traffic method for façades is the awkward case: the receiving-room background cannot easily be separated from the traffic signal, so the rule becomes a duty of care: keep noise from sources inside the building as low as practicable and say so in the report if you suspect it contaminated the result, because it can only make the façade look better than it is.
How much accuracy the survey buys back
Section titled “How much accuracy the survey buys back”The trade this page opens on has a published size. Clause 6.6 NOTE states that survey results and the corresponding engineering method are estimated to agree within ± 2 dB, and Clause 6.6 itself requires the reproducibility of the procedure to be checked from time to time in accordance with ISO 12999-1, particularly after any change of procedure or instrumentation: the same standard the field guide’s uncertainty section runs on. An estimated reverberation index adds to that: the tabulated indices of Table 4 carry a standard deviation of about 1 dB (Table 4 NOTE 1), and that spread enters every quantity on this page directly, band for band. Measure when the result has to survive a dispute; estimate it when the question is whether a partition is roughly where it should be.
ISO 10052 survey reports (.report())
Section titled “ISO 10052 survey reports (.report())”The airborne, impact and façade survey results each carry a .report(path) that
writes the one-page ISO 10052 survey (control) method field report: the
standard-basis line naming ISO 10052 (octave bands), an optional metadata
header, the octave-band table beside the measured-versus-shifted-reference
curve, the boxed field rating (/, or
), the
survey-method statement, an optional requirement verdict (level differences pass
at or above it, the impact level at or below it) and a footer. The airborne
result reports quantity="dnt" (default) or "r_prime"; verbose=True,
metadata and language="es" behave as in the fiches above.
import numpy as np
from phonometry import building, ReportMetadata
res.report("DnTw_survey.pdf",           metadata=ReportMetadata(requirement=40.0))   # DnT,w (C; Ctr)
# Impact and façade surveys reuse the same k; li is the tapping-machine level# in the room below, l1_2m the level 2 m in front of the façade.li = np.array([66.0, 64.0, 62.0, 60.0, 55.0])impact = building.survey_impact_insulation(li, k, volume=50.0)impact.plot()   # L'nT vs the shifted ISO 717-2 reference (needs matplotlib)impact.report("LnTw_survey.pdf")                         # L'nT,w (CI)
l1_2m = np.array([76.0, 78.0, 79.0, 79.0, 77.0])facade = building.survey_facade_insulation(l1_2m, l2, k, volume=40.0)facade.report("D2mnTw_survey.pdf")                       # D2m,nT,w (C; Ctr)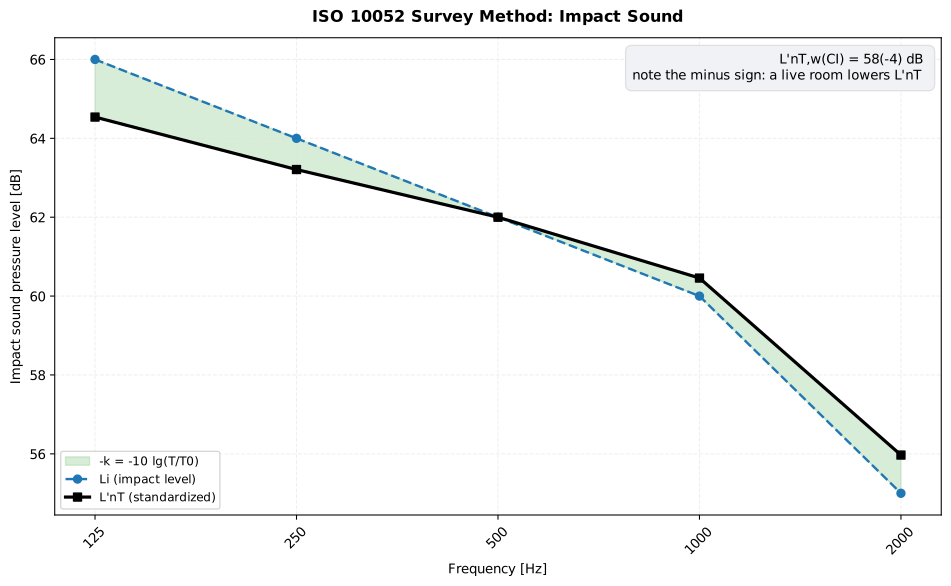
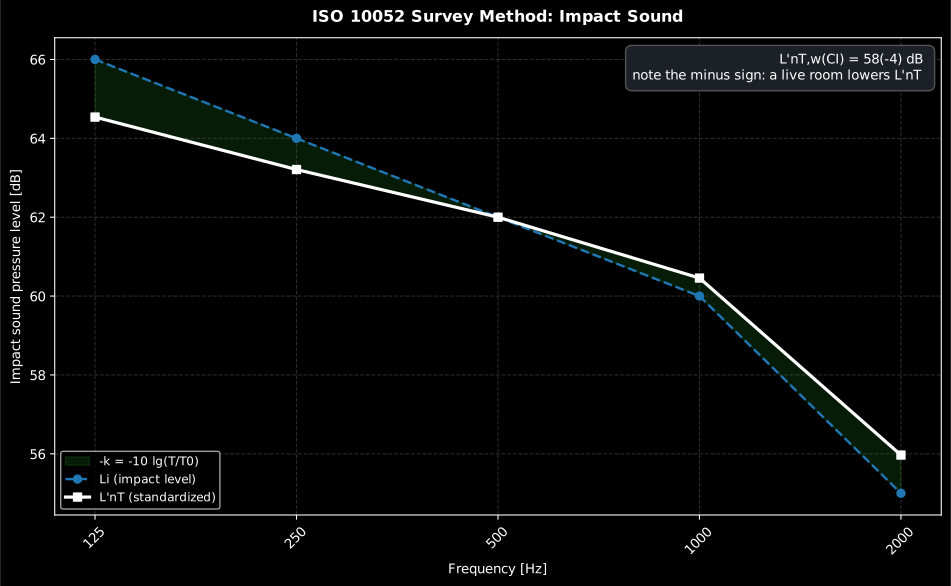
The impact survey applies the reverberation index with the opposite sign, : a live receiving room () lowers the standardized impact level. As in the airborne case, the automatic rating appears for exactly 5 octave (or 16 one-third-octave) values.
Show the code for this figure
import matplotlib.pyplot as pltimport numpy as npfrom phonometry import building
# Octave-band tapping-machine levels below the floor, and the measured T.bands = [125, 250, 500, 1000, 2000]li = np.array([66.0, 64.0, 62.0, 60.0, 55.0])k = building.reverberation_index([0.70, 0.60, 0.50, 0.45, 0.40])impact = building.survey_impact_insulation(li, k, volume=50.0)
# One line — L'nT vs the shifted ISO 717-2 reference:impact.plot()plt.show()
# By hand, showing the sign flip of the correction:x = np.arange(len(bands))fig, ax = plt.subplots()ax.fill_between(x, impact.l_i, impact.l_nt, alpha=0.2, label="-k = -10 log10(T/T0)")ax.plot(x, impact.l_i, "--o", label="Li (impact level)")ax.plot(x, impact.l_nt, "-s", label="L'nT (standardized)")ax.set_xticks(x, [str(b) for b in bands])ax.set(xlabel="Frequency [Hz]", ylabel="Impact sound pressure level [dB]",       title=f"ISO 10052 survey method: L'nT,w = {impact.rating.rating} dB")ax.legend()plt.show()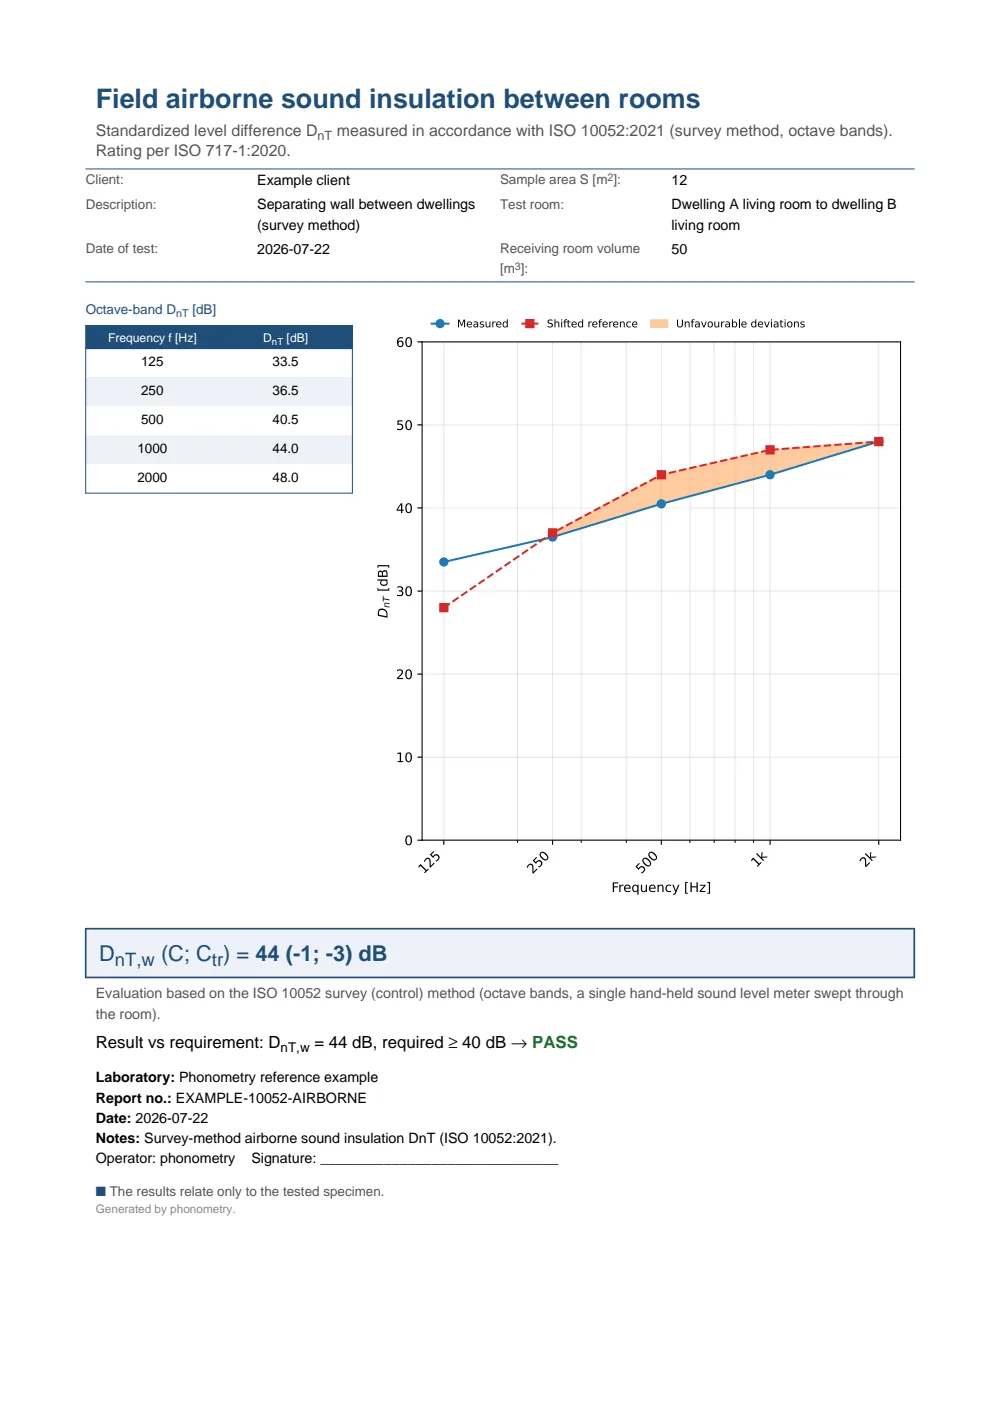
One-page survey-method airborne sound insulation field report between dwellings: the metadata header, the octave-band DnT table beside the measured-versus-shifted-reference curve, the boxed DnT,w (C; Ctr) rating, the survey-method statement and a PASS verdict.
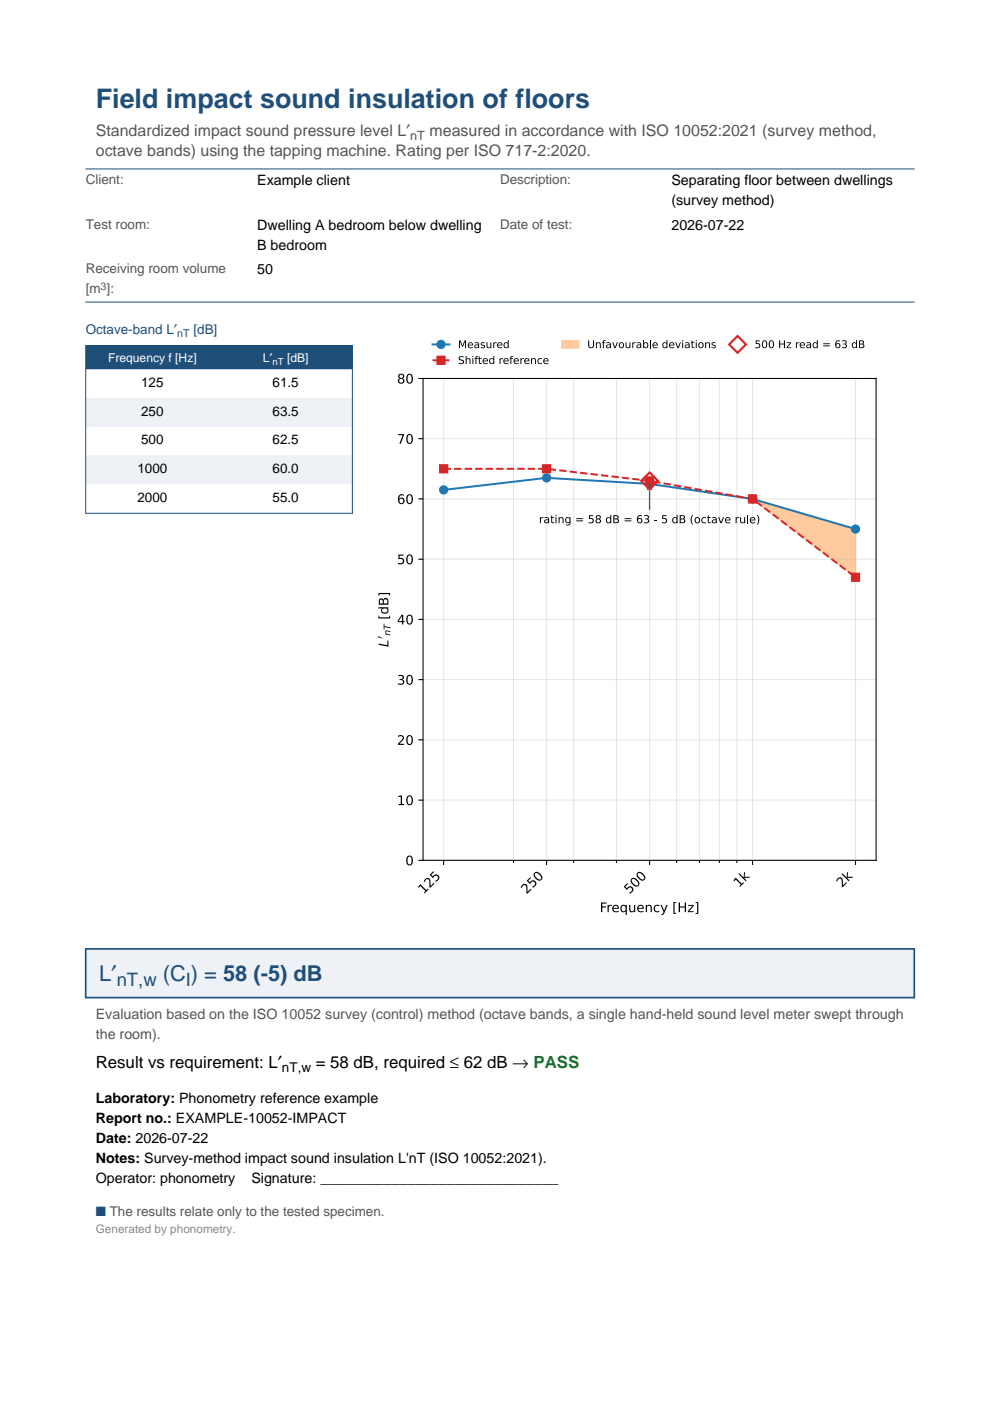
One-page survey-method impact sound insulation field report for a floor under tapping-machine excitation: the metadata header, the octave-band L'nT table beside the measured-versus-shifted-reference curve, the boxed L'nT,w (CI) rating, the survey-method statement and a PASS verdict (a lower impact level is better).
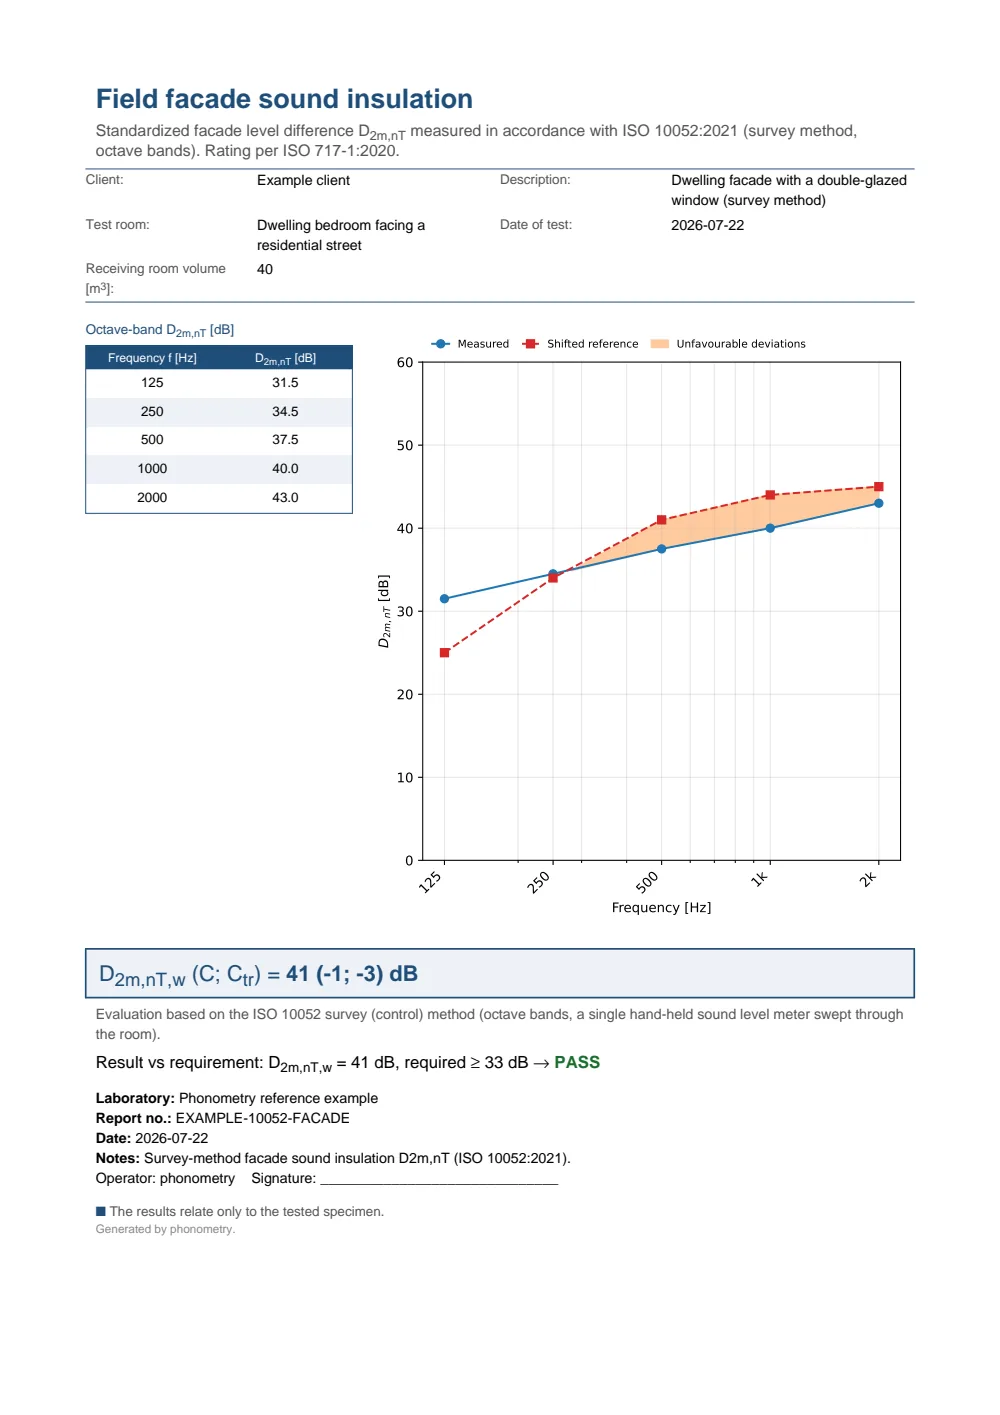
One-page survey-method façade sound insulation field report: the metadata header, the octave-band D2m,nT table beside the measured-versus-shifted-reference curve, the boxed D2m,nT,w (C; Ctr) rating, the survey-method statement and a PASS verdict.
What this guide covers
Section titled “What this guide covers”Covered
The ISO 10052:2021 survey method: the reverberation index measured with
building.reverberation_indexor estimated from the Table 3 room classes withbuilding.estimate_reverberation_index; the survey airborne, impact and façade quantities (, , with the rule, , , ) viabuilding.survey_airborne_insulation,building.survey_impact_insulationandbuilding.survey_facade_insulation; service-equipment noise from exactly three positions viabuilding.survey_service_equipment_level; the automatic ISO 717 ratings on 5-octave or 16-third spectra; and the survey fiches through.report().Not covered
The survey procedure of Running the survey is documented here but not checked: the functions consume band levels wherever they came from, so nothing verifies the sweep, the source corner, the tapping-machine positions or the one-corner-plus-two-central service-equipment recipe. Nothing verifies that the 6 dB signal-to-background floor of Clause 6.2.1 was met either, and no correction is applied when it was not: that is the method’s own rule, not an omission. The ± 2 dB agreement with the engineering method is the standard’s own estimate (Clause 6.6 NOTE), not something this library models or propagates: no survey result carries an uncertainty. When the stakes rise, step up to Field Insulation Measurement (ISO 16283), whose ISO 12999-1 machinery does produce one. Annex A’s report form and Annex B’s operating cycles for service equipment are also outside the library.
References
Section titled “References”- International Organization for Standardization. (2021). Acoustics — Field measurements of airborne and impact sound insulation and of service equipment sound — Survey method (ISO 10052:2021). The field survey method: the reverberation-index correction, the standardized/normalized airborne, impact and façade quantities, and service-equipment noise. The formulas and reverberation-index table are identical in the harmonized EN ISO 10052:2004+A1:2010.
- Vigran, T. E. (2008). Building acoustics. CRC Press. https://doi.org/10.1201/9781482266016The building-acoustics context of the field quantities the survey method approximates. ISBN 978-0-415-42853-8.