Floor-Covering Impact Improvement (ISO 16251-1)
Standards: ISO 16251ISO 717ISO 12354Key references: Vigran 2008Foret et al. 2011
A soft floor covering does not block airborne sound; it cushions footsteps. What it improves is the impact level of the floor underneath, and measuring that improvement in a full ISO 10140 transmission suite is out of proportion to a square metre of carpet. ISO 16251-1 therefore shrinks the laboratory to a small heavyweight mock-up: a softly supported concrete plate, a standard tapping machine and an accelerometer underneath. This guide covers the mock-up measurement of the improvement and its weighted against the ISO 717-2 reference floor, the accredited fiche, and the ISO 12354-2 engineering estimate that predicts a floating floor’s improvement from the dynamic stiffness of its resilient layer. The full-size laboratory chain lives in Laboratory Insulation Measurement; the measurement behind the estimate is the subject of Dynamic stiffness of resilient materials.
The small-mock-up method
Section titled “The small-mock-up method”ISO 16251-1:2014 is a laboratory method for the improvement of impact sound insulation of a soft, locally-reacting floor covering (carpet, PVC, linoleum). The two ISO 10140 rooms are replaced by a small softly-supported concrete plate; a standard tapping machine excites it and the structure-borne acceleration level on the underside is measured with and without the covering. For locally-reacting coverings that acceleration-level difference equals the ISO 10140 impact sound reduction.
“Locally reacting” is the condition the whole method rests on
Section titled ““Locally reacting” is the condition the whole method rests on”Clause 3.3 defines it: a covering is locally reacting when the impact is transmitted into the bearing floor predominantly through the area the hammers directly excite. The energy does not spread sideways through the covering itself, so (as the standard’s own note says) the improvement does not depend on the size of the specimen. That single property is what lets a 120 cm × 80 cm plate stand in for a full transmission suite: if a 1 m² sample and a 20 m² floor give the same , the small rig is not an approximation of the large one, it is the same measurement.
The qualifying family is named in the scope: soft, flexible coverings (carpets, PVC and linoleum), which map onto ISO 10140-1:2010 Annex H, category I. The disqualifying family is anything with a stiff wearing layer that distributes the hammer load over an area the specimen’s own size then bounds: laminates, click systems, and any floating floor, whose screed is precisely a load-spreading plate. The standard states the consequences plainly. For non-soft, non-flexible floorings “increased deviations from the results of the ISO 10140 series method may occur due to the dependency on the specimen size”; and in the case of difference with ISO 10140, the result of the ISO 10140 measurement shall be used. The mock-up never overrules the full-size suite.
One rating rule follows from the same clause. Where more than one sample of the same product is tested, the per-band of the samples are arithmetically averaged first, and ISO 717-2 is applied to the average (Clause 6.5). Rating each sample and averaging the ratings is a different number and is not what the standard asks for.
The rig, and why every dimension of it is in the standard
Section titled “The rig, and why every dimension of it is in the standard”Annex A is normative and consists of two setup drawings. The slab is (120 ± 5) cm × (80 ± 5) cm × (20 ± 1) cm, homogeneous and of uniform thickness, flat to ± 1 mm along a horizontal line from edge to edge and hard enough to endure the hammers; a screed may be added to provide the flatness. It rests on four elastic supports at the corners, none exceeding 10 cm × 10 cm, and the vertical resonance of the slab on those bearings shall lie below 20 Hz. At least four accelerometer positions are screwed or glued to the lower surface, uniformly but randomly distributed, avoiding symmetric lines and at least 10 cm from the edges. The tapping machine takes at least two positions, at least 30 cm apart, skew to the edges, with no hammer closer than 10 cm to an edge and all four feet standing on the specimen.
Each of those numbers is doing something. The 20 cm thickness reproduces the
ISO 10140 standard heavyweight floor, which is what makes the improvement
transferable to a real building. The sub-20 Hz support resonance puts the whole
measurement range above the rigid-body modes, so the plate behaves as a free
body and its acceleration reflects only the force the hammers inject. The
flatness matters because is the ratio of two force inputs and an
uneven surface changes how the hammers strike. The edge clearances and the
randomised, asymmetric positions keep the four-position average from landing on a
nodal line of the plate’s own modes. And the four accelerometer levels and two
machine positions are not decoration: Formula (4) averages over the
pairs, which is exactly what impact_improvement consumes.
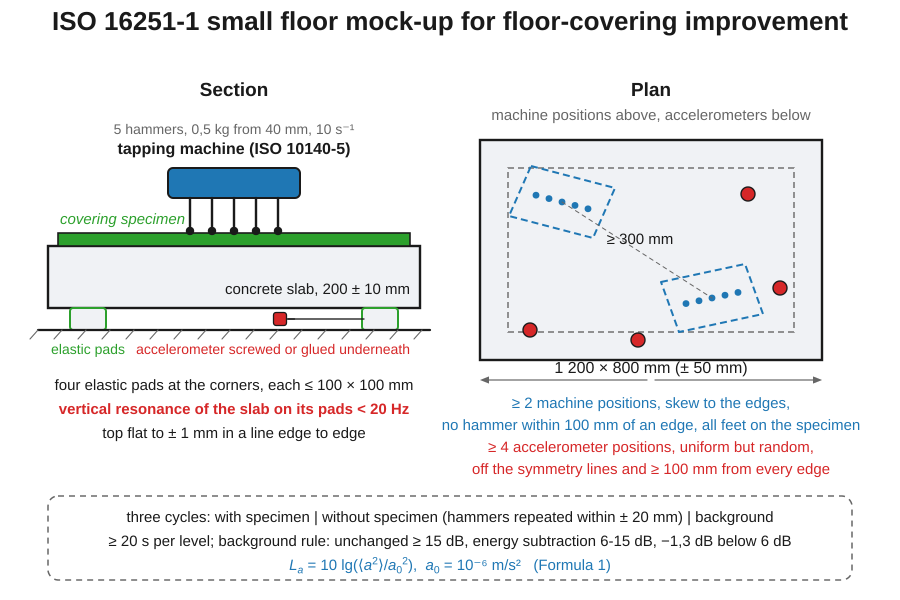
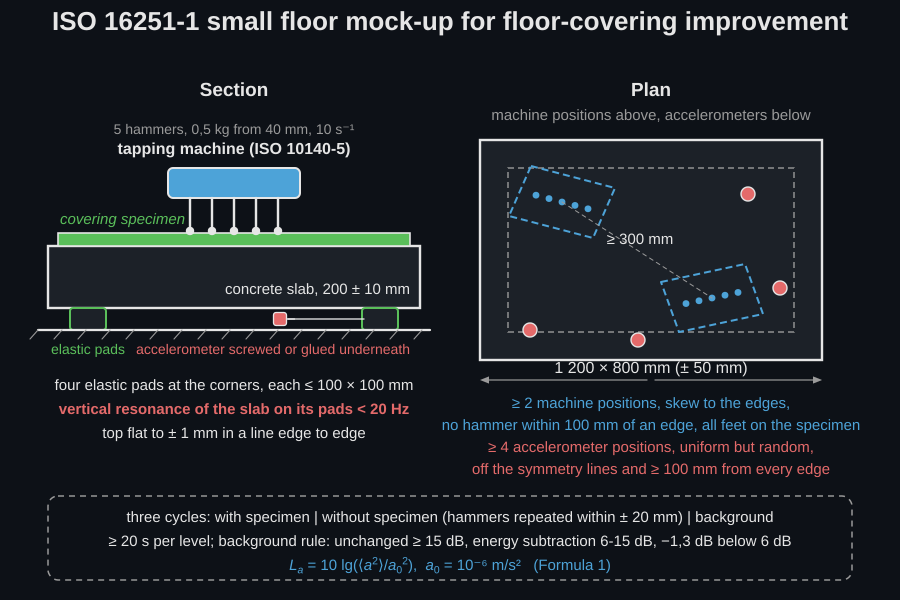
The instrument chain is specified too (Clause 5.2): the measurement system shall be declared to meet IEC 61672-1 class 1 with the microphone replaced by the accelerometer, the one-third-octave filters IEC 61260 class 1, the tapping machine ISO 10140-5, and the vibration calibration ISO 16063. The standard warns that the bare plate’s acceleration signal is a train of extremely short pulses which some otherwise-compliant chains handle badly, and asks for a first-use check against an ISO 10140 measurement. Three cycles are recorded: with the specimen, without it (hammer positions repeating within ± 2 cm) and background, each averaged for not less than 20 s, with temperature and humidity noted before and after and the chain calibrated before and rechecked after.
None of this is checked by the library, which starts from the measured acceleration levels: conformity of the facility is the operator’s to demonstrate.
Acceleration level (Formula (1)). dB, reference . Background correction (Formula (2)) follows the ISO 10140 three-branch rule (unchanged ≥ 15 dB; energy subtraction for 6 ≤ margin < 15 dB; the 1.3 dB limit below 6 dB, flagged as ). The improvement is the position-averaged difference (Formulae (3)/(4)); octaves follow (Formula (5)).
Weighted improvement. is the ISO 717-2 weighted reduction: the
improvement is applied to the heavyweight reference floor
(ISO 717-2 Table 4), , and
, computed by weighted_impact_improvement(), which
reuses the verified ISO 717-2 rating engine. A clause 6.3 measurement spans 18
bands (100–5000 Hz, optionally extended to 50 Hz); the rating is formed on the
100–3150 Hz sub-range of whatever spectrum contains it. The statement of
results (clause 8 e)) also carries the spectrum adaptation term
(ISO 717-2:2020 Formula (A.4)), exposed as
ci_delta on the result and standalone as
impact_improvement_adaptation_term().
And is half the answer, so read it. The weighted rating slides a reference curve until the excess fits, which rewards improvement wherever in the spectrum it happens; real footfall noise is dominated by the low and mid bands, where a thin resilient covering does least. is the adaptation term that compares the unweighted energetic sum with the weighted rating, and contrasts the reference floor as it is against the reference floor with the covering on it, with fixed at dB (A.2.2; dB when one decimal is required). Formula (A.5) then says what the pair means: . This page’s carpet is rated 29 () dB, so on the flat-response scale it buys 16 dB, not 29. A strongly negative is the signature of a covering that works only high up, typical of thin resilient layers, and exactly where the tapping machine flatters them; a covering with near zero improves the whole range. A fiche that prints only has told you the better half of the story.
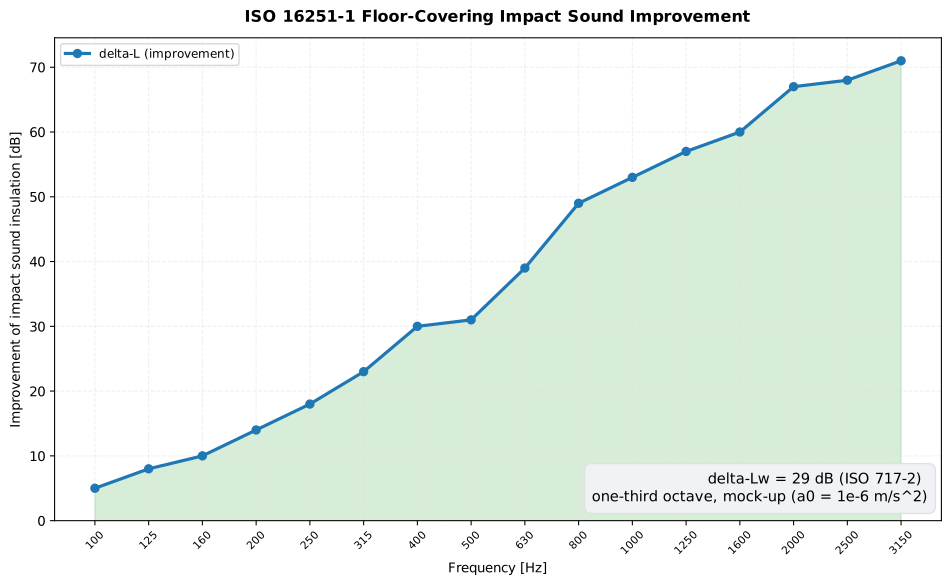
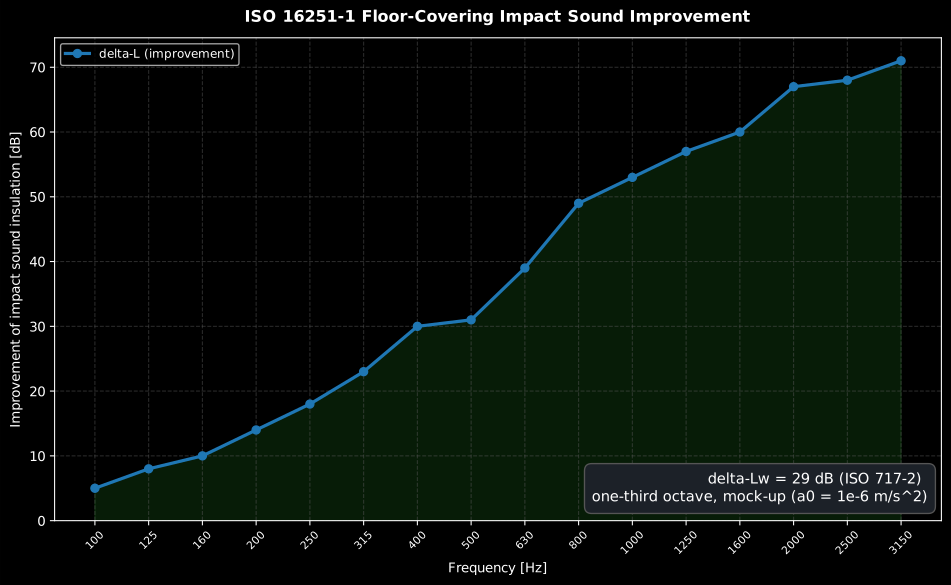
A real textile carpet on the mock-up, and the shape is the whole argument: 5 dB at 100 Hz against 71 dB at 3150 Hz, a span of 66 dB across the rated range. The covering does almost nothing to the low-frequency thump and almost everything to the high-frequency click. = 29 dB records that only obliquely, which is why the figure is read together with dB and the 16 dB that the two of them give on the flat-response scale.
Show the code for this figure
import matplotlib.pyplot as pltimport numpy as npfrom phonometry import building
freqs = [100, 125, 160, 200, 250, 315, 400, 500,         630, 800, 1000, 1250, 1600, 2000, 2500, 3150]bare = np.full(16, 78.0)                       # bare-plate acceleration level# A real textile carpet measured on the CSTB mock-up (Foret et al. 2011, Fig. 4).covering = bare - np.array([5, 8, 10, 14, 18, 23, 30, 31,                            39, 49, 53, 57, 60, 67, 68, 71])res = building.impact_improvement(bare, covering, freqs)print(res.delta_lw)   # weighted improvement delta-Lw = 29 dB (ISO 717-2)res.plot()plt.show()
from phonometry import building
# delta-Lw straight from an improvement spectrum (16 one-third-octave bands):delta_l = [5, 8, 10, 14, 18, 23, 30, 31, 39, 49, 53, 57, 60, 67, 68, 71]print(building.weighted_impact_improvement(delta_l)) # 29 dB (carpet)
# Two samples of the same product: average the per-band improvements FIRST,# then rate the average (Clause 6.5). Rating each sample and averaging the# ratings is a different number.import numpy as npsample_a = np.array(delta_l, dtype=float)sample_b = sample_a + np.array([1, 0, -1, 1, 0, -1, 1, 0, -1, 1, 0, -1, 1, 0, -1, 1])print(building.weighted_impact_improvement(0.5 * (sample_a + sample_b))) # 29 dB
# From the measured bare/covered acceleration levels, with a background trace:freqs = [100, 125, 160, 200, 250, 315, 400, 500, 630, 800, 1000, 1250, 1600, 2000, 2500, 3150]bare_levels = [72, 73, 74, 74, 75, 75, 76, 76, 77, 77, 78, 78, 79, 79, 80, 80]covered_levels = [b - d for b, d in zip(bare_levels, delta_l)]bg = [40.0] * 16res = building.impact_improvement(bare_levels, covered_levels, freqs, background=bg)res.improvement # delta-L per bandres.delta_lw # weighted single number (rated on the 100-3150 Hz sub-range)res.ci_delta # spectrum adaptation term CI,delta (Formula (A.4))res.limited # bands at the 1.3 dB limit of measurement (> delta-L)res.octave_bands() # (octave freqs, delta-L_oct) via Formula (5)res.plot() # the delta-L(f) improvement spectrum above (needs matplotlib)ISO 16251-1 impact-improvement report (.report())
Section titled “ISO 16251-1 impact-improvement report (.report())”Clauses 8 and 9 decide what a result has to carry to be reportable, and most of
it is yours to supply rather than the library’s to compute. Beside the
improvement itself the table must show the bare-plate acceleration level
with its reference , the per-band of every sample
tested, their average where there is more than one, the weighted improvement(s)
and the adaptation term(s), all rounded to one decimal place, with any
band whose background correction hit the 1,3 dB limit written as ”> ”. The report then adds: the manufacturer and product identification, a
detailed description of the covering with the number and size of the specimens,
the method of mounting, in particular the adhesive with its mass per area and
curing time, the temperature and humidity during the test, the positions of
the tapping machine and the accelerometers, and a statement of whether the
specimen suffered visible damage such as compaction. Those map onto the
manufacturer, specimen, mounting, mass_per_area, temperature_c,
static_pressure_kpa, test_date and notes fields of ReportMetadata
below; the damage statement and the mounting detail have no field of their own
and belong in notes.
FloorCoveringImprovementResult.report(path) writes a one-page accredited
impact-improvement fiche: the standard-basis line, a metadata header, the
per-band table (frequency and , bands at the 1.3 dB limit prefixed
>) beside the improvement curve, the boxed single-number
(the ISO 16251-1 Clause 8 e)
statement of results), and a footer. Pass a ReportMetadata for the header;
the applicable fields are specimen (the floor covering under test), client,
manufacturer, mounting, mass_per_area, test_room, test_date,
temperature_c, static_pressure_kpa, measurement_standard, laboratory,
operator, report_id, notes and requirement (a higher weighted
improvement is better, so the verdict passes at or above it). The bare
reference floor is the standardised heavyweight floor of ISO 717-2:2020 Table
4, fixed by the standard. verbose=True adds the reference-floor-with-covering
column , the derivation basis of
.
from phonometry import building, ReportMetadata
freqs = [100, 125, 160, 200, 250, 315, 400, 500,         630, 800, 1000, 1250, 1600, 2000, 2500, 3150]delta_l = [5, 8, 10, 14, 18, 23, 30, 31, 39, 49, 53, 57, 60, 67, 68, 71]bare = [78.0] * 16res = building.impact_improvement(bare, [b - d for b, d in zip(bare, delta_l)], freqs)res.report("dLw.pdf",           metadata=ReportMetadata(               specimen="Textile floor covering (carpet), laid loose",               measurement_standard="ISO 16251-1",               requirement=20.0))  # delta-Lw (CI,delta) = 29 (-13) dB
The example fiche is regenerated with make reports and kept in the
repository. Click the preview to open the PDF:
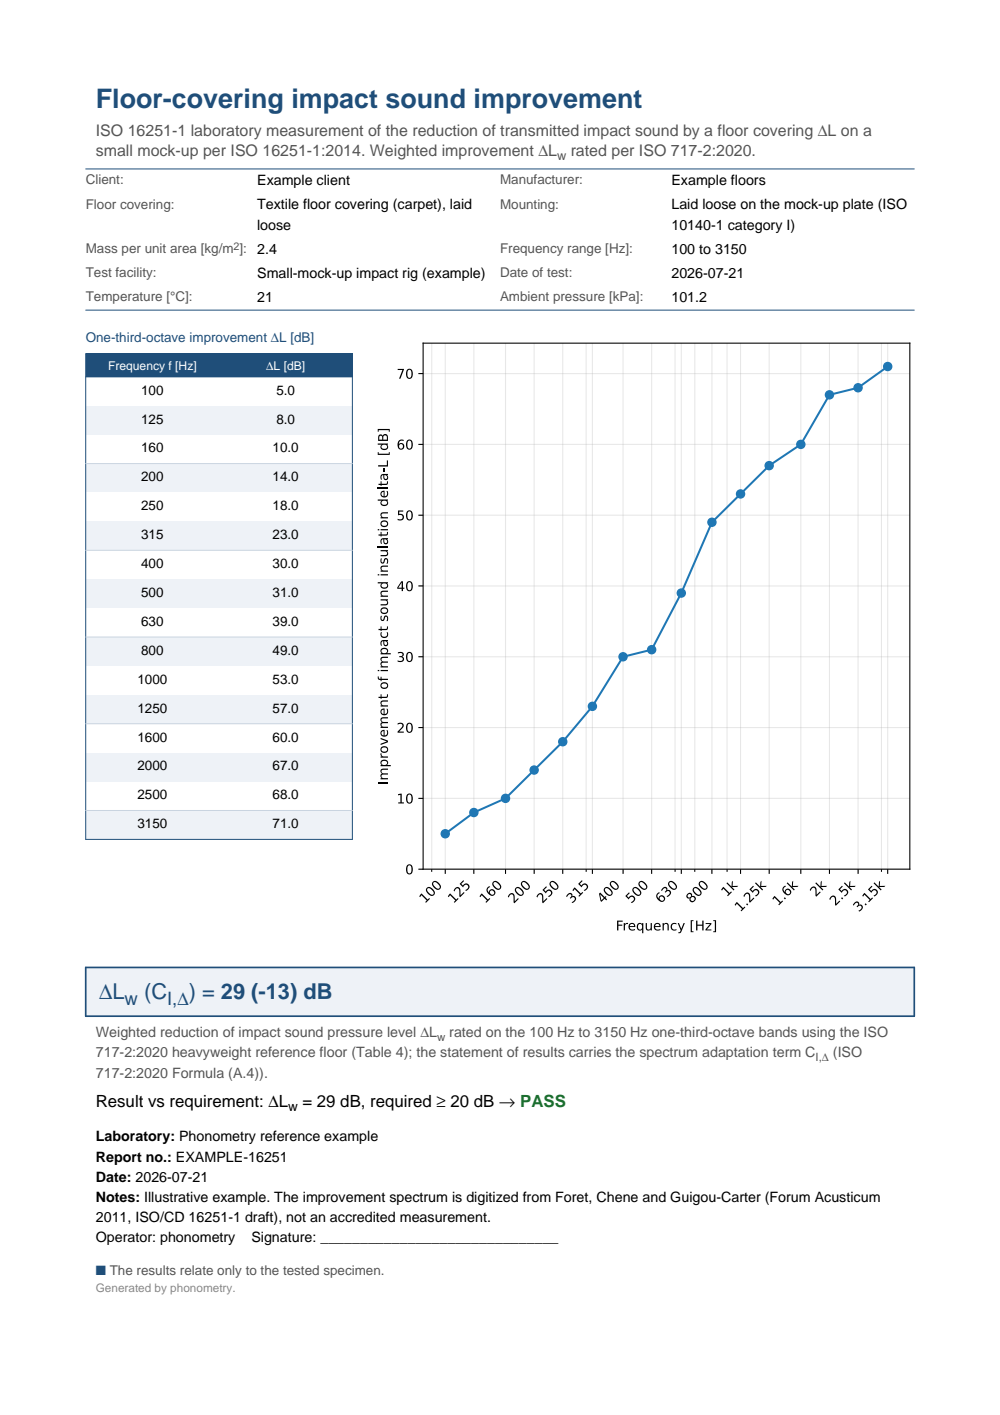
One-page floor-covering impact-improvement test report for a soft carpet whose improvement spectrum is digitized from the Foret et al. (2011) ISO/CD 16251-1 comparison study (an illustrative example, not an accredited measurement): the metadata header (client, floor-covering description, mounting, mass per area, climate), the one-third-octave delta-L table beside the delta-L(f) improvement curve rising with frequency, the boxed delta-Lw (CI,delta) = 29 (-13) dB weighted improvement (ISO 717-2), and a PASS verdict against the 20 dB requirement (a higher weighted improvement is better).
From dynamic stiffness to the improvement: the ISO 12354-2 estimate
Section titled “From dynamic stiffness to the improvement: the ISO 12354-2 estimate”The mock-up measures a covering that exists; a floating floor (a screed poured on a resilient layer) is designed the other way round, from two numbers known at the drawing stage: the mass per unit area of the slab and the dynamic stiffness per unit area of the resilient layer, measured per EN 29052-1 as in the dynamic-stiffness guide. Together they set the mass-spring resonance of the system (ISO 12354-2:2017, Annex C, Formula (C.2)):
where 160 is the rounded ; materials.natural_frequency computes
the exact form. Above the resonance the slab
decouples from the structural floor and Annex C estimates the improvement as
a straight slope per Formula (C.1), with the steeper Formula (C.3) for
constructions whose higher internal losses follow the infinite-plate theory:
Both are written for only, and taken as zero at and below the resonance. That is a convention: in the band containing the mass-spring system amplifies and measured floors fall between about dB and dB there, so a design whose lands inside the rated 100-3150 Hz range rates optimistically in exactly the band that decides the number. Here is 52.8 Hz, comfortably below the range, which is why the spectrum below starts clean at 100 Hz.
import numpy as npfrom phonometry import building, materials
# The ISO 12354-2:2017 Annex G worked floor: a 73.5 kg/m2 screed on a resilient# layer with s' = 8 MN/m3.f0 = 160.0 * np.sqrt(8.0 / 73.5)                                 # Formula (C.2)print(round(f0, 1))                                              # 52.8  Hzprint(round(float(materials.natural_frequency(8.0e6, 73.5)), 1))  # 52.5  exact 1/(2 pi) form
# delta-L = 30 lg(f/f0) above the resonance (Formula (C.1)); build the# one-third-octave spectrum and rate it with the ISO 717-2 engine.freqs = np.array([100, 125, 160, 200, 250, 315, 400, 500, 630, 800,                  1000, 1250, 1600, 2000, 2500, 3150], dtype=float)delta_l = 30.0 * np.log10(freqs / f0)print(building.weighted_impact_improvement(delta_l))             # 32  dB
# The one-line estimate of Formula (C.4) lands right beside it:print(round(13.0 * np.log10(73.5) - 14.2 * np.log10(8.0) + 20.8, 1))   # 32.2 dB
The closed-form weighted estimate of Formula (C.4), dB, condenses the same physics into one line: heavier slabs and softer layers rate better. Both estimates are design aids kept deliberately on the safe side (the 30 lg slope undercuts the 40 lg infinite-plate theory where experimental data say real screeds fall short); once a specimen exists, the measured mock-up of this page, or the full ISO 10140-3 floor, is the reference, and the EN 12354-2 prediction consumes whichever you have.
What this guide covers
Section titled “What this guide covers”Covered
ISO 16251-1:2014’s acceleration level (Formula (1)), the three-branch background correction (Formula (2)), the position-averaged improvement (Formulae (3)/(4)) and its octave synthesis (Formula (5)), via
building.acceleration_level,building.background_corrected_levelandbuilding.impact_improvement; the Clause 8 e) statement of results, against the ISO 717-2 Table 4 reference floor with the adaptation term (Formula (A.4)), viabuilding.weighted_impact_improvementandbuilding.impact_improvement_adaptation_term; and the one-page accredited fiche through.report().Not covered
The mock-up facility itself (the plate dimensions, the resilient supports, the tapping-machine positions of Clause 5) is not checked: the functions consume measured acceleration levels wherever they came from. The ISO 12354-2:2017 Annex C floating-floor formulas are quoted on this page as design aids and evaluated inline with numpy; the dedicated helpers that wrap them, together with the tapping-machine force model behind a soft covering’s improvement and the ISO 12354-1 Annex D rating of a wall lining, are the subject of Predicting Resilient-Layer Performance. The superseded full-size ISO 140-8 method exists here only as the comparison axis of the Foret et al. (2011) worked example.
References
Section titled “References”- Foret, R., Chéné, J.-B., & Guigou-Carter, C. (2011). A comparison of the reduction of transmitted impact noise by floor coverings measured using ISO 140-8 and ISO/CD 16251-1. Forum Acusticum 2011, Aalborg (CSTB). The measured textile-carpet improvement spectrum used as the ISO 16251-1 worked example on this page (ΔL_w = 29 dB); the per-band ΔL was digitized from its Figure 4.
- International Organization for Standardization. (2014). Acoustics — Laboratory measurement of the reduction of transmitted impact noise by floor coverings on a small floor mock-up — Part 1: Heavyweight compact floor (ISO 16251-1:2014). The small-mock-up laboratory method for the impact-sound improvement ΔL of soft, locally-reacting floor coverings, with ΔL_w via the ISO 717-2 reference floor and the CI,delta adaptation term.
- International Organization for Standardization. (2017). Building acoustics — Estimation of acoustic performance of buildings from the performance of elements — Part 2: Impact sound insulation between rooms (ISO 12354-2:2017). The informative Annex C floating-floor estimate reproduced on this page (Formulae C.1 to C.4, the 160 sqrt(s'/m') resonance) and the worked floor of its Annex G.
- International Organization for Standardization. (2020). Acoustics — Rating of sound insulation in buildings and of building elements — Part 2: Impact sound insulation (ISO 717-2:2020). The impact single-number rating engine reused here and the reference floor L_n,r,0 (Table 4) behind ΔL_w, with the Formula (A.4) spectrum adaptation term CI,delta.
- Vigran, T. E. (2008). Building acoustics. CRC Press. https://doi.org/10.1201/9781482266016The transmission theory of floors and floating floors that the improvement quantifies. ISBN 978-0-415-42853-8.