Vibration
Standards: ISO 7626ISO/TS 7849Key references: Griffin 1996Mansfield 2004Cremer et al. 2005Hopkins 2007
This page collects the theory behind human vibration: the ISO 8041-1 frequency weightings, the whole-body and hand-arm metrics of ISO 2631-1 and ISO 5349, the action and limit values of Directive 2002/44/EC, and the ISO 2631-5 multiple-shock spinal model. It then turns from people to structures: the driving-point mobilities that govern how much power a point force injects into a plate, beam or rod, and the radiation efficiency that turns that vibration back into airborne sound (the pair EN 12354-5 and ISO 7849 rest on). It is part of the theory reference.
Human vibration (ISO 8041-1, ISO 2631-1/2, ISO 5349-1/2, Directive 2002/44/EC)
Section titled “Human vibration (ISO 8041-1, ISO 2631-1/2, ISO 5349-1/2, Directive 2002/44/EC)”Human response to vibration depends on frequency, axis and body part, so acceleration is filtered by the frequency weightings of ISO 8041-1:2017 before any metric. Each weighting is the analog cascade (Formula 5): two-pole Butterworth band-limiting high-pass and low-pass stages (Formulae 1/2), an acceleration–velocity transition (Formula 3, carrying the only non-unity gain, for Wb) and an upward step (Formula 4), with the Table 3 corner frequencies and Q factors; a corner at infinity collapses its stage to unity (Table 3 NOTEs). One cascade with nine parameter sets therefore produces the whole family, and choosing the member is the first decision a vibration measurement forces:
| Weighting | What it weights | Axis or contact point | Standard | Nominal range | Feeds |
|---|---|---|---|---|---|
Wk | Vertical whole-body | z, seat surface or floor | ISO 2631-1 | 0.5–80 Hz | , VDV, |
Wd | Horizontal whole-body | x and y, seat surface or floor | ISO 2631-1 | 0.5–80 Hz | , VDV, |
Wc | Seat-back | x, backrest | ISO 2631-1 | 0.5–80 Hz | (comfort) |
We | Rotational | rx, ry, rz (per rad) | ISO 2631-1 | 0.5–80 Hz | (comfort) |
Wj | Recumbent, under the head | z | ISO 2631-1 | 0.5–80 Hz | (comfort) |
Wm | Building occupants | all axes | ISO 2631-2 | 1–80 Hz | |
Wb | Rail ride comfort | z | ISO 2631-4 | 0.5–80 Hz | |
Wf | Motion sickness | z | ISO 2631-1, clause 9 | 0.1–0.5 Hz | MSDV |
Wh | Hand-transmitted | all three hand axes | ISO 5349-1 | 8–1000 Hz | , |
The nominal ranges are the ISO 8041-1 Table 1 columns, not the band-limiting
corners of Table 3: Wh is band-limited at 6.31 Hz and 1258.9 Hz but tabulated
from 8 Hz to 1 kHz, and the whole-body set is band-limited at 0.4 Hz and 100 Hz
and tabulated from 0.5 Hz to 80 Hz. Which weighting goes on which axis with
which multiplying factor is a posture question, answered by the posture map of
ISO 2631-1 Tables 1 and 2 reproduced in the
Human Vibration guide.
All nine are implemented from the exact cascade: the filter is applied as the
exact complex response via FFT, magnitude and phase, not a bilinear-warped
digital approximation, and the ISO 8041-1 Annex B design-goal tables (B.1–B.9)
are reproduced to 0.1 %.
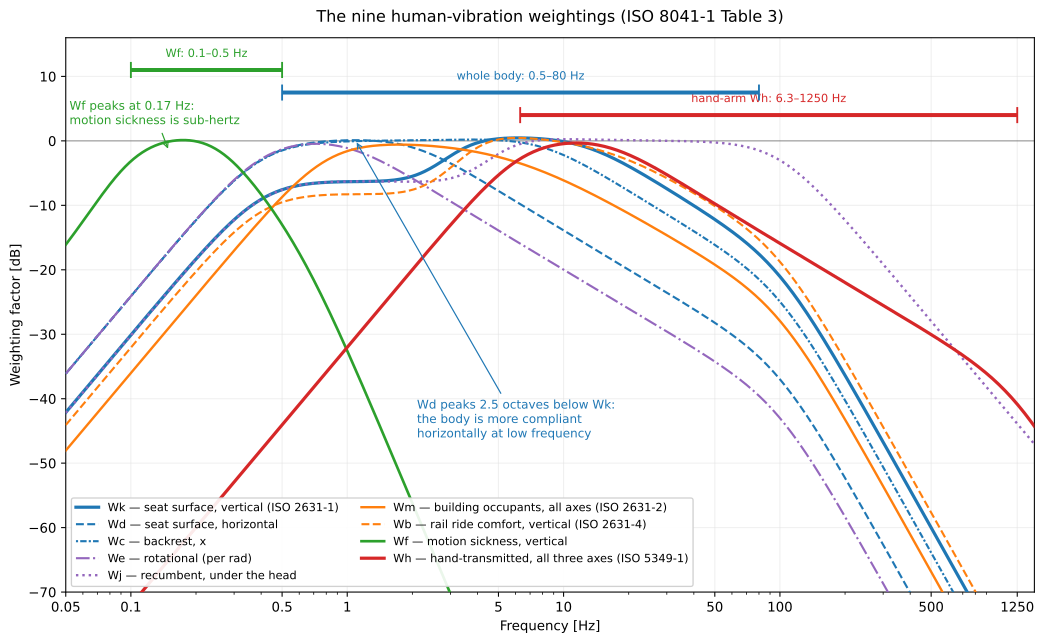
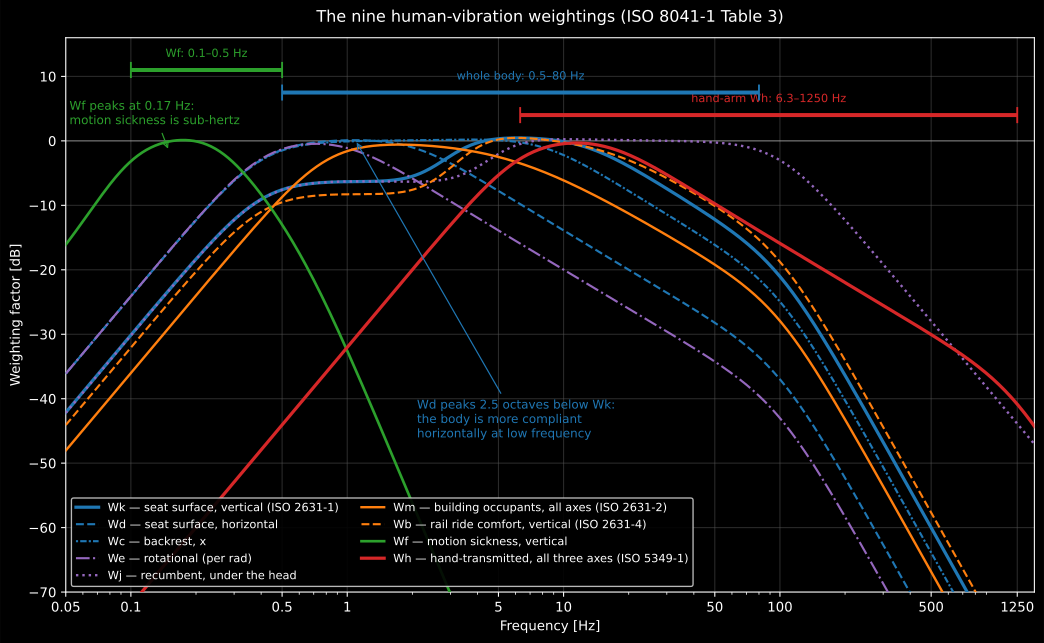
The family the one cascade produces, a Table 3 parameter set per curve. Wk,
the vertical whole-body weighting quoted most often, is the flat-topped curve
peaking near 6 Hz and 21 dB down at 100 Hz; Wd peaks two and a half octaves
below it, because the body is far more compliant horizontally at low frequency;
Wf sits an order of magnitude lower in frequency again; and Wh extends three
decades above, which is why the three sets are tabulated over the three
different bands drawn above the curves.
Getting the acceleration right
Section titled “Getting the acceleration right”None of this survives a transducer in the wrong place. Whole-body vibration is measured at the interface where it enters the body (ISO 2631-1, 5.3.1): for a seated person the seat surface beneath the ischial tuberosities, the seat back at its principal area of support, and the feet; and on a resilient surface the transducer is interposed between person and surface in a mount that does not greatly alter the pressure distribution (5.3.2), the usual design being the semi-rigid disc of ISO 10326-1. The three translational transducers at one location sit orthogonally and as close together as practicable, with up to 15° of misalignment tolerated where exact alignment is impracticable (5.2.2–5.2.3); the location, the orientation of the axes relative to gravity and the measurement duration are all reported (5.2.2, 5.3.1, 5.5).
Hand-arm vibration is measured at the middle of the gripping zone where that is reachable, and otherwise either side of the hand or on the underside of the handle adjacent to it, with two positions averaged where the vibration differs across the hand; flexibly mounted side handles are the standard case (ISO 5349-2, 6.1.3 as revised by Amd 1:2015). A percussive tool can reach 20 000 to 50 000 m/s², almost all of it outside the 6.3 Hz to 1250 Hz evaluation band, and that overload drives a piezoelectric transducer into DC-shift: a false low-frequency component, exactly where the weighting has most gain (6.2.4). A mechanical filter prevents it (Annex C); the standard’s check is to convert the unweighted band r.m.s. acceleration to a displacement and compare it with the motion of the transducer you can actually see; and a record showing DC-shift is discarded, because the distortion contaminates the whole spectrum and deleting the low-frequency bands does not rescue it. Magnitudes are averaged over complete operations or work cycles, with at least three samples per operation, a total measuring time of at least one minute, and samples shorter than about 8 s avoided (5.4.1). The Human Vibration guide carries the mass, attachment and grip-force constraints and the rest of the fault list.
Weighted metrics and daily exposure
Section titled “Weighted metrics and daily exposure”The weighted metrics follow ISO 2631-1:1997: running rms with linear or
exponential integration (Eqs. 2/3), MTVV as its maximum (Eq. 4), the
fourth-power VDV in
(Eq. 5), and the vibration total value
(Eq. 10), whose multiplying factors
belong to the posture and axis rather than to the metric: for a seated person
assessed for health, 1.4 on Wd-weighted x and y and 1.0 on Wk-weighted z
(clause 7.2.3).
The crest factor decides which of them to report. It is the peak of the weighted acceleration divided by its rms over the same interval (clause 6.2.1), so it measures how much of the exposure is concentrated in short events: a steady random vibration sits near 3 to 4, and a value approaching 9 means the average is being set by transients the rms understates. ISO 2631-1 clause 6.2.2 treats the basic rms method as normally sufficient while the crest factor stays at or below 9 and sends anything above it to the additional methods of clause 6.3, because occasional high peaks contribute little to an rms and a great deal to a fourth-power dose. Two ratios decide the same question without relying on the crest factor alone (clause 6.3.3): report the additional value as well once exceeds 1.5 or exceeds 1.75. Both are measured over the actual evaluation interval, so splitting a record into short blocks lowers the crest factor artificially; and where an additional method is used, the basic value is still reported beside it (clause 5.6).
Hand-arm exposure follows ISO 5349-1:2001: (Eq. 1, all ), daily exposure with h (Eq. 2), partial exposures combined in quadrature (ISO 5349-2:2001, Eqs. 1–3), and the Annex C vascular-risk model for the years to 10 % white-finger prevalence (unrelated to the acceleration dose below). The Directive 2002/44/EC action and limit values are built in: hand-arm 2.5/5.0 m/s², whole-body 0.5/1.15 m/s² or VDV 9.1/21.0 (Article 3), the VDV route applying where a member state has adopted it.
The two limits are assessed on two differently built quantities. Hand-arm
exposure is assessed on the vector total , every . Whole-body
exposure is assessed on the single dominant axis: the largest of
, and (Directive Annex Part B, with the clause
7.2.3 factors; ISO 2631-1 clause 7.2.2 assesses each axis independently), and
never on the vector total, which is the comfort quantity of clause 8.
vibration.wbv_exposure_basis builds the whole-body basis and
vibration.vibration_total_value the vector total; feeding the second to
is the commonest error in an occupational assessment and always inflates
the answer. For the three axes 0.35, 0.28 and 0.62 m/s², the Directive basis is
0.62 m/s² and the health-weighted vector total 0.88 m/s², an overstatement of
42 %.
The ISO 5349-2 worked examples are reproduced (E.2.1: 7.4 m/s² for 2.5 h → m/s²; E.3 forestry, three tools → 3.6 m/s²), as are the ISO 5349-1 Table C.1 exposure-duration rows.
Multiple shocks (ISO 2631-5)
Section titled “Multiple shocks (ISO 2631-5)”Repeated shocks damage the lumbar spine through peak compression rather than average energy, so ISO 2631-5:2018 replaces the Wk weighting with the seat-to-spine transfer function of clause 5.2 (Formula 1: one complex zero and six complex pole pairs, unity at DC, resonance near 5 Hz, at 5 Hz) and accumulates the positive spinal-response peaks with a sixth-power (Palmgren-Miner) dose (clause 5.3, Formulae 3/4):
Annex C converts the daily dose to a compressive stress ( MPa per m/s² for the 82 kg male / 64 kg female), tracks the age-declining ultimate strength and forms the cumulative stress variable (Formulae C.3/C.4), mapped to an injury probability by the Table C.1 Weibull law . The spinal filter is evaluated analytically in the frequency domain and validated against the Annex D 256 Hz digital-filter tabulation within the clause 5.2 tolerance; the Annex C worked example (five 40 m/s² shocks per day over 20 years) is reproduced: m/s², , . The Annex A finite-element spinal model (distributed by ISO as separate software) is out of scope.
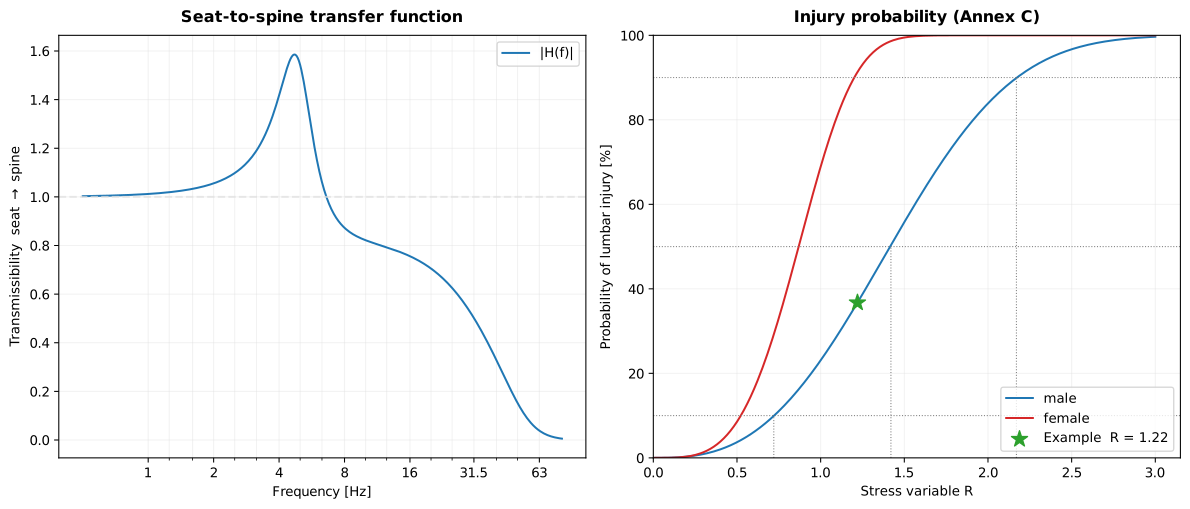
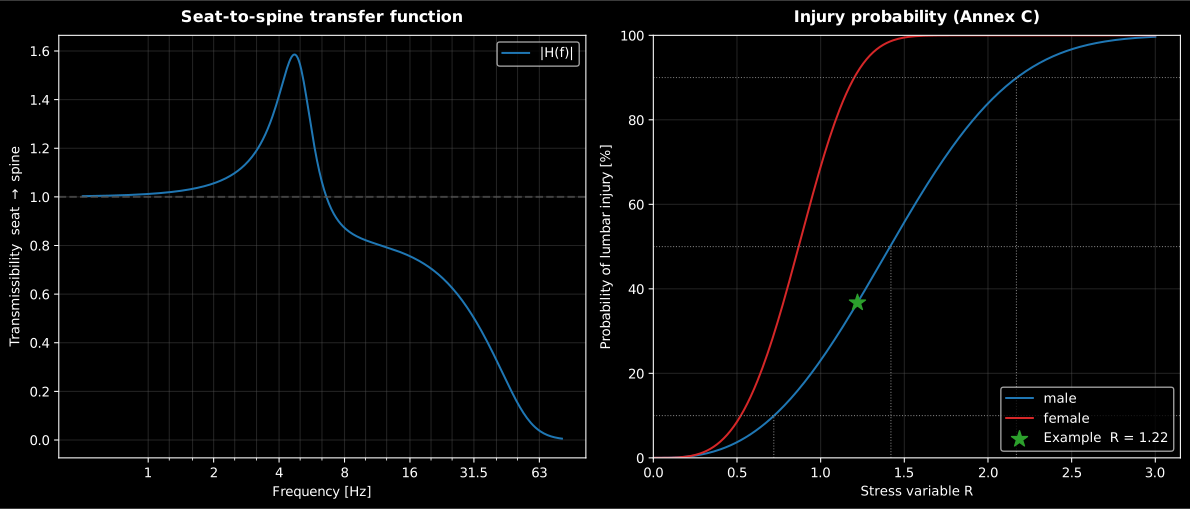
The two objects of the model. Left, the clause 5.2 seat-to-spine transmissibility: unity at DC, peaking at near 5 Hz and rolling off above it, which is why had to be replaced for shocks. Right, the Table C.1 Weibull law with the Annex C worked example marked at , : the risk rises steeply over a narrow band of , so a dose that doubles does not double the probability.
See the Human Vibration guide and the Multiple-Shock Vibration guide for usage.
Point mobilities and radiation efficiency (Cremer 5, Hopkins 2.9)
Section titled “Point mobilities and radiation efficiency (Cremer 5, Hopkins 2.9)”The notation restarts here: is a cross-sectional area, a mass per unit length and a mass per unit area, none of them the stress and dose symbols of the human-vibration sections above.
The vibrational power a point force injects into a structure is (Cremer Eq. 5.23), so the driving-point mobility (the reciprocal of the impedance) governs how much energy the structure absorbs. For infinite structures these are closed forms (Cremer Table 5.1): an infinite thin plate is a pure resistance (real, frequency independent, with the bending stiffness per unit width and the mass per unit area), an infinite beam has (a 45-degree phase, falling as through the bending wave speed ), and a longitudinal rod has . These supply the receiver mobility EN 12354-5 needs when no measurement exists, and are the theoretical companions of the measured ISO 7626 mobilities.
Where the substitution holds. No real structure is infinite, and a finite one does not have a smooth driving-point mobility: below and around its first few modes the measured swings by tens of decibels between resonance and antiresonance. The closed form is the average about which it oscillates, so it becomes meaningful only once several modes fall inside the analysis band, which is why it is used with octave or one-third-octave inputs and never read at a single frequency, and why it is defensible in the mid and high bands where structure-borne power predictions are usually made and unreliable in the lowest bands of a small or lightly damped element. The closed forms also assume excitation far from any boundary: driving near an edge or a corner raises the local stiffness and lowers the mobility, and driving a ribbed or otherwise inhomogeneous plate invalidates the single the plate formula rests on. Take the receiver mobility from a measurement when the element is small, lightly damped, or excited near a boundary.
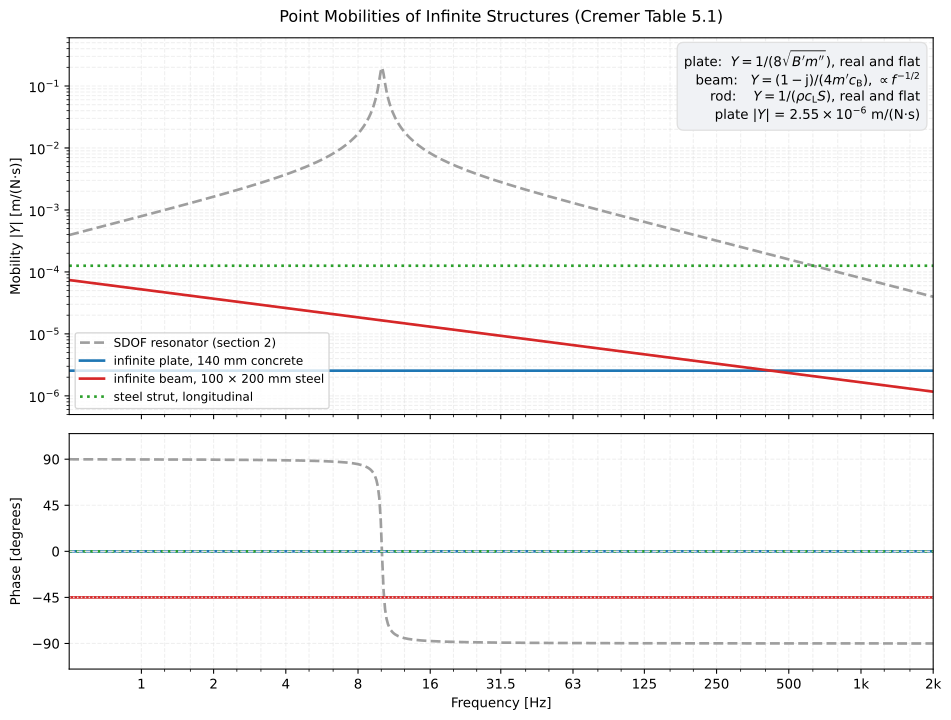
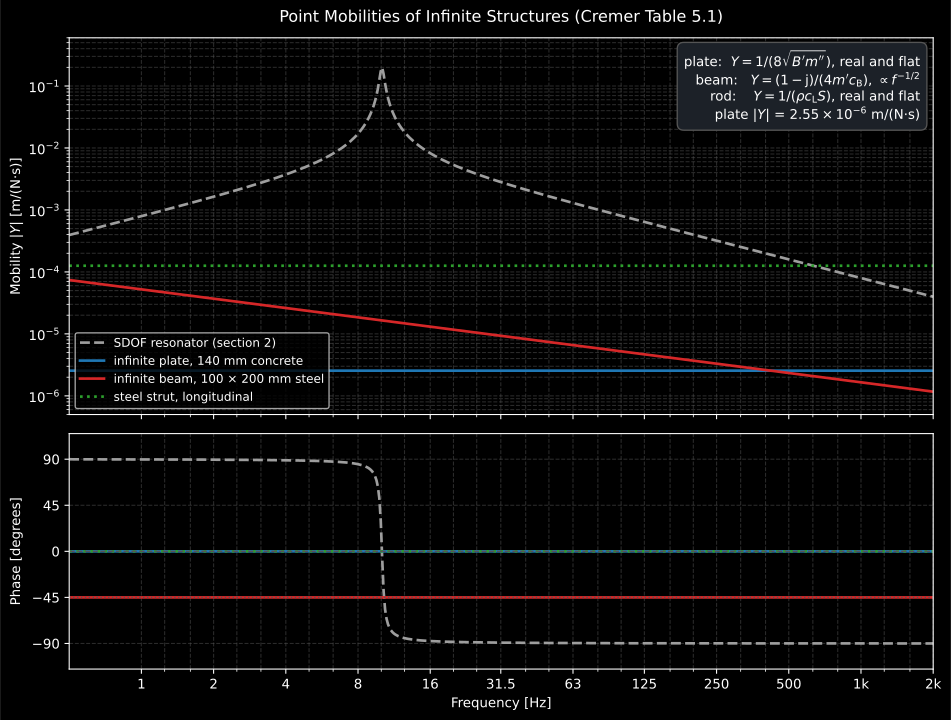
The three closed forms drawn against the finite resonator. The 140 mm concrete plate is real and frequency-independent at m/(N·s); the 100 × 200 mm steel beam falls as , a factor 63 over the twelve octaves shown, at a constant −45°; the longitudinal strut is real and flat. None of them resonates, which is exactly the difference from a finite structure and the reason the closed forms are band-average substitutes rather than point-by-point predictions.
How efficiently a bending plate then radiates the airborne power is its radiation efficiency : the ratio of the power the plate actually radiates to the power a piston of the same area, vibrating with the same spatially averaged mean-square velocity, would radiate into the same half-space. So is the fully coupled case, and a small value means the plate is short-circuiting itself. Below the critical frequency (the frequency at which the bending wavelength in the plate matches the wavelength in air), the bending wavelength is the shorter of the two, so adjacent half-cells of the plate pump air back and forth into each other and radiation survives only where that cancellation is interrupted, at the edges and the corners. Sub-critical therefore depends on the plate’s perimeter and area as well as on its material, and it is small: a 12.5 mm plasterboard sheet 4 × 3 m ( kHz) runs from at 31.5 Hz to 0.080 at 2 kHz, while a 100 mm concrete slab of the same size ( Hz) is already at 0.12 at 31.5 Hz. Above the quoted limit (Leppington/Maidanik, Hopkins Eqs 2.227-2.230) applies, but it is singular exactly at , so the coincidence band is evaluated with the separate at-coincidence expression (Eq. 2.230) and the peak just above is finite (1.89 for that concrete slab), set by the plate’s size and damping. Because is exactly the radiation factor of ISO 7849, predicting it closes the sound-power- from-vibration chain without a power measurement, and it drives the resonant transmission path of the panel sound insulation theory, where itself is defined.
See the Predicting Panel Sound Insulation guide for usage.
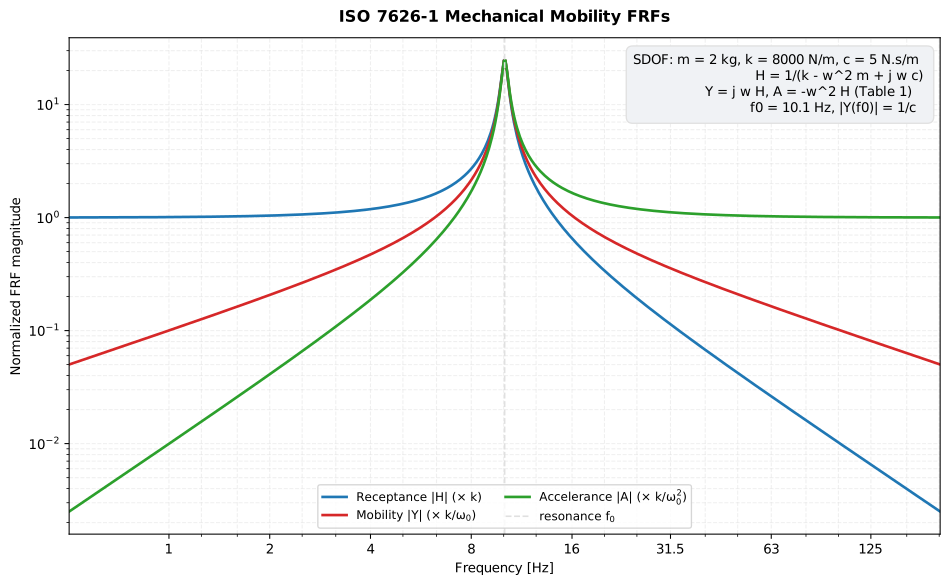
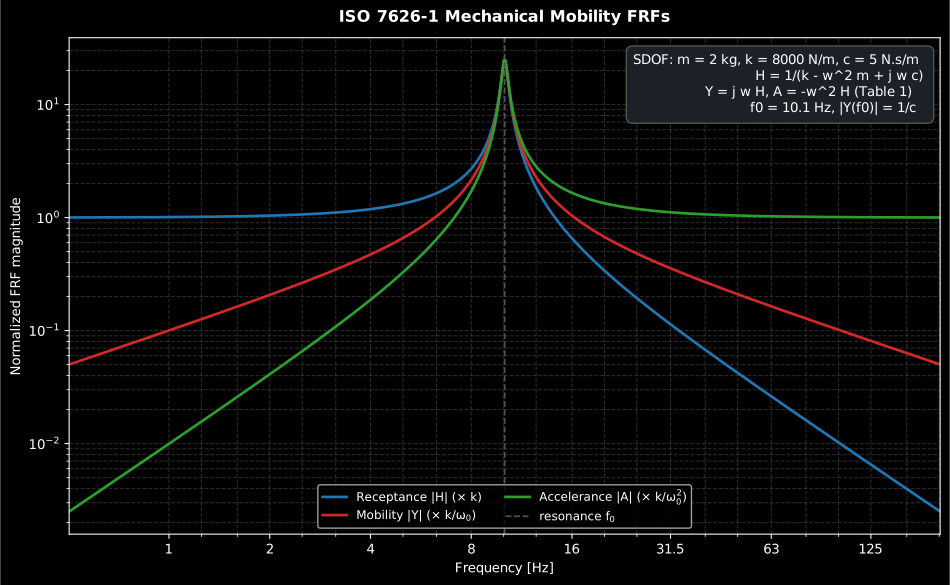
Not one of the closed forms above: this is a finite one-degree-of-freedom resonator, receptance, mobility and accelerance being the same resonance seen through the three kinematic quantities. It is here as the contrast: the infinite-structure results are frequency-independent or smoothly falling, while anything finite resonates.
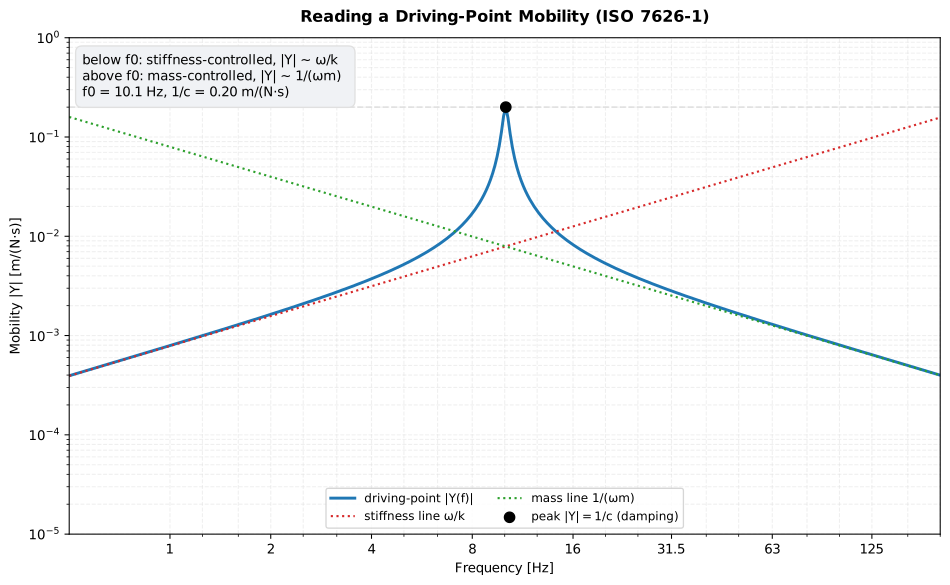
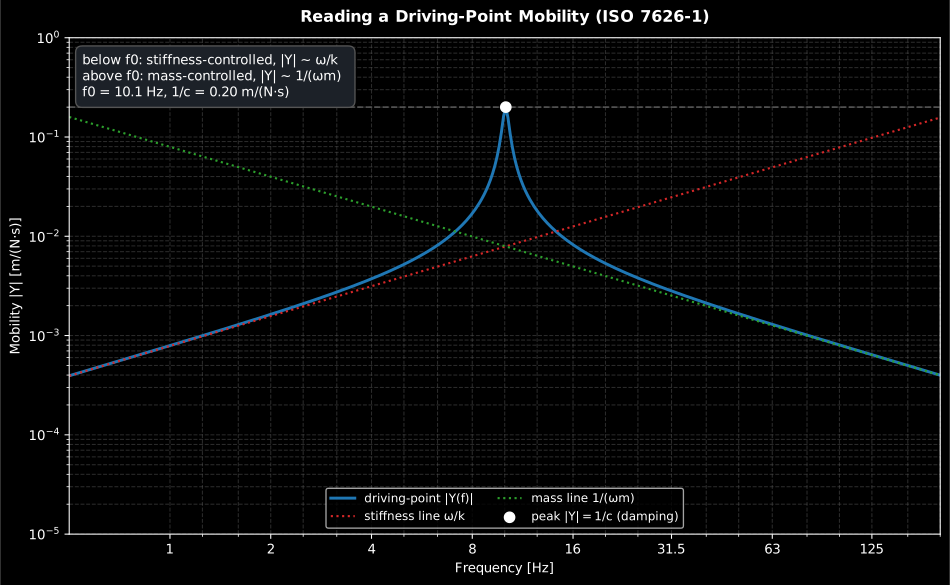
The same point read as a diagnosis: below resonance the magnitude climbs the stiffness line , above it it falls along the mass line , and the peak height is set by the damping alone. A real structure has many such resonances, and the infinite-structure closed forms above are the average the measured mobility oscillates about, not the value it takes at a given frequency, which is why they are used with octave or third-octave inputs and are least trustworthy in the lowest bands of a small or lightly damped element.
References
Section titled “References”- Cremer, L., Heckl, M., & Petersson, B. A. T. (2005). Structure-borne sound: Structural vibrations and sound radiation at audio frequencies (3rd ed.). Springer. ISBN 978-3-540-22696-3. The driving-point power W = (1/2) |F|^2 Re{Y} (Eq. 5.23) and the closed-form infinite-structure mobilities and impedances (Table 5.1) of the point-mobility section.
- Griffin, M. J. (1996). Handbook of human vibration. Academic Press. ISBN 978-0-12-303041-2. The biodynamic and health-effect evidence behind the ISO 8041-1 weightings, the rms/MTVV/VDV dose measures and the spinal-injury rationale of the multiple-shock model.
- Hopkins, C. (2007). Sound insulation. Butterworth-Heinemann. ISBN 978-0-7506-6526-1. The bending-plate radiation-efficiency theory (Eqs 2.227-2.230, the Leppington/Maidanik high-frequency limit) behind the radiation-efficiency section.
- International Organization for Standardization. (2009). Acoustics — Determination of airborne sound power levels emitted by machinery using vibration measurement — Part 1: Survey method using a fixed radiation factor (ISO/TS 7849-1:2009). The radiation factor that equals the radiation efficiency, closing the sound-power-from-vibration chain of the radiation-efficiency section (survey method, fixed radiation factor).
- International Organization for Standardization. (2009). Acoustics — Determination of airborne sound power levels emitted by machinery using vibration measurement — Part 2: Engineering method including determination of the adequate radiation factor (ISO/TS 7849-2:2009). The engineering method of the same sound-power-from-vibration chain, determining the adequate radiation factor from measurement.
- International Organization for Standardization. (2011). Mechanical vibration and shock — Experimental determination of mechanical mobility — Part 1: Basic terms and definitions, and transducer specifications (ISO 7626-1:2011). The measured driving-point mobilities that the closed-form infinite-structure results of the point-mobility section are the theoretical companions of.
- Mansfield, N. J. (2004). Human response to vibration. CRC Press. ISBN 978-0-415-28239-0. A compact modern walkthrough of the ISO 2631-1 whole-body and ISO 5349 hand-arm evaluation chains summarised on this page.