Laboratory Insulation Measurement
Standards: ISO 10140ISO 15186ISO 16251ISO 717ISO 10848Key references: Hopkins 2007Vigran 2008Foret et al. 2011
To rate a building element on its own (a wall type, a floating floor, a window) you take it to a qualified laboratory, where suppressed flanking makes the direct transmission the whole story. This page covers the laboratory chain: the ISO 10140 sound reduction index and normalized impact level, the sound-intensity alternative of ISO 15186, the small-mock-up floor-covering improvement of ISO 16251-1 and the flanking-transmission measurement of ISO 10848. Field measurement and ratings live in Field Insulation Measurement and Ratings, and the prediction that consumes these laboratory ratings in Predicting Sound Insulation (EN 12354).
Laboratory measurement (ISO 10140)
Section titled “Laboratory measurement (ISO 10140)”An ISO 16283 field measurement yields the primed quantities (, ): the number a real building achieves, flanking transmission and all. To rate an element on its own (a wall type, a floating floor, a window), you take it to a qualified laboratory (ISO 10140), where suppressed flanking makes the direct transmission the whole story. The formulas lose their primes: the sound reduction index (not ) and the normalized impact level (not ), with the receiving room’s absorption area now a known property of the facility:
| Field (ISO 16283) | Laboratory (ISO 10140) | |
|---|---|---|
| Airborne element index | apparent (with flanking) | direct (flanking suppressed) |
| Airborne room pair | , (no prime: room quantities) | — |
| Impact | , apparent | direct |
| Single number | , , , | , |
| Absorption area | measured in the room | property of the facility |
The apostrophe is the flanking marker of building acoustics, and it travels with the quantity into its single number: rates a laboratory spectrum, a field one. The standardized and normalized level differences and carry no prime because they describe the room pair rather than an element, so there is no flanking-free counterpart to mark. In a well-built construction lands a few dB below the laboratory of the same partition; a much larger gap says flanking dominates, and the EN 12354 model tells you which path carries it.
The single-number ratings reuse the very same ISO 717-1/2 engines
(weighted_rating, weighted_impact_rating): an spectrum rates to
exactly as an spectrum rated to . Before forming the index the
receiving-room levels must be corrected for background noise (Clause 4.3):
the energy subtraction applies for a
6–15 dB signal-to-background margin, a fixed 1.3 dB correction (the limit of
measurement) at or below 6 dB, and no correction at or above 15 dB.
import numpy as npfrom phonometry import building
# Source/receiving levels and receiving-room T over the 16 one-third-octave# bands; S is the free test-opening area, V the receiving-room volume.l1 = np.full(16, 80.0)l2 = np.full(16, 40.0)t2 = np.full(16, 0.5)lab = building.lab_airborne_insulation(l1, l2, t2, area=10.0, volume=50.0)print(round(float(lab.r[0]), 1))              # 38.0  R = L1 - L2 + 10 lg(S/A)print(round(float(lab.absorption[0]), 1))     # 16.0  A = 0.16 V / T (m^2)print(lab.rating.rating, lab.rating.c, lab.rating.ctr)   # 38 0 0  ->  Rw(C;Ctr)
# Impact: the tapping-machine level Li normalized to A0 = 10 m^2 gives Lnli = np.array([62.1, 63.2, 63.5, 66.2, 68.5, 70.0, 71.7, 73.1,               73.8, 73.5, 73.8, 73.3, 73.1, 73.0, 72.4, 71.2])imp = building.lab_impact_insulation(li, t2, volume=50.0)print(round(float(imp.l_n[0]), 1))            # 64.1  Ln = Li + 10 lg(A/A0)print(imp.rating.rating, imp.rating.ci)       # 81 -11  ->  Ln,w(CI)
# Background correction: margins 6 / 1 / 20 dB -> capped / capped / unchangedcorrected = building.background_correction([30.0, 33.0, 50.0], [24.0, 32.0, 30.0])print(np.round(corrected, 1))                 # [28.7 31.7 50.0]  (1.3 dB cap twice)
lab.rating.plot()   # measured R vs shifted ISO 717-1 reference (needs matplotlib)
A margin at or below 6 dB emits a LabInsulationWarning and flags the band as
the limit of measurement; catch it with warnings.simplefilter("error", LabInsulationWarning). The automatic rating is formed only when exactly 16
one-third-octave or 5 octave values are supplied (rating is None otherwise).
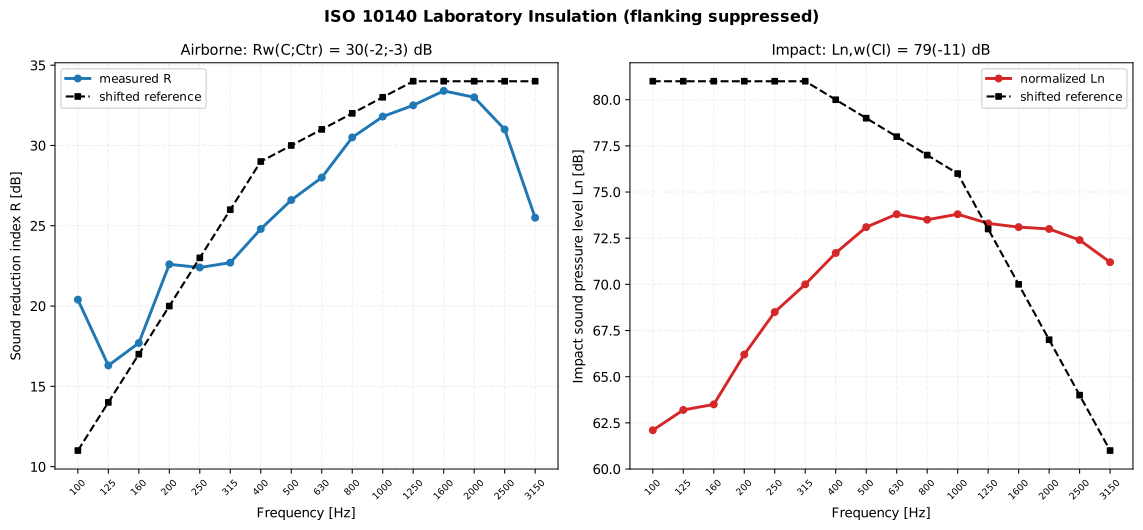
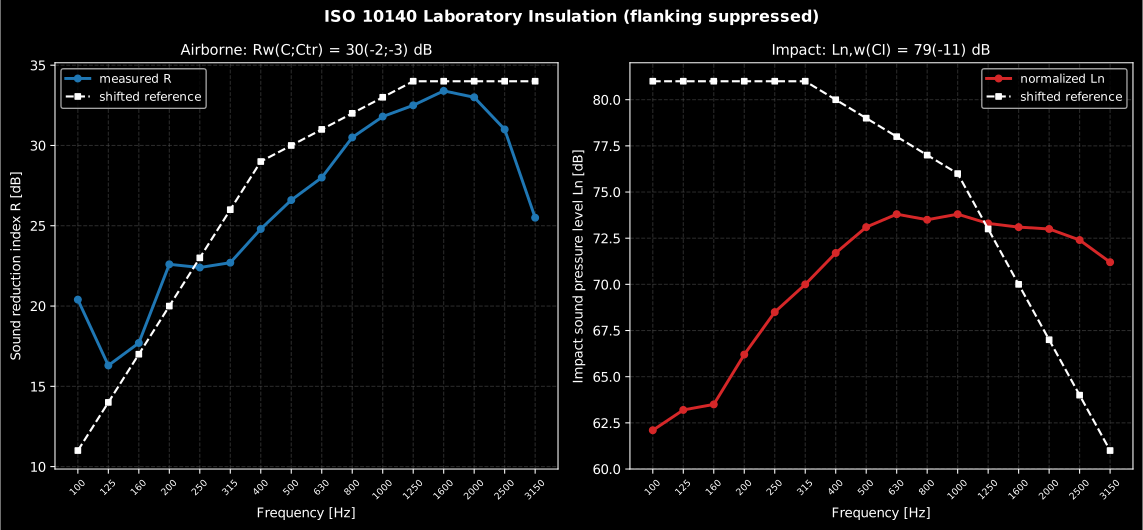
The two laboratory quantities of ISO 10140 with their ISO 717 ratings: the
airborne is rated where the reference sits above the measurement,
the impact where the measurement sits above the reference (a
higher impact level is worse). lab.plot() and imp.plot() draw either
panel on its own.
Show the code for this figure
import matplotlib.pyplot as pltimport numpy as npfrom phonometry import building
# The ISO 717-1 Annex C wall in an ISO 10140 suite (S = 10 m2, V = 50 m3,# T = 0.8 s) and the ISO 717-2 Annex C floor under the tapping machine.r = np.array([20.4, 16.3, 17.7, 22.6, 22.4, 22.7, 24.8, 26.6,              28.0, 30.5, 31.8, 32.5, 33.4, 33.0, 31.0, 25.5])l1 = np.full(16, 90.0)t2 = np.full(16, 0.8)lab = building.lab_airborne_insulation(l1, l1 - r, t2, area=10.0, volume=50.0)li = np.array([62.1, 63.2, 63.5, 66.2, 68.5, 70.0, 71.7, 73.1,               73.8, 73.5, 73.8, 73.3, 73.1, 73.0, 72.4, 71.2])imp = building.lab_impact_insulation(li, t2, volume=50.0)
# One line each — R (or Ln) vs its shifted ISO 717 reference:lab.plot()imp.plot()plt.show()
# By hand, both panels from the results' fields:fig, (ax1, ax2) = plt.subplots(1, 2, figsize=(11, 4.5))ax1.semilogx(lab.rating.band_centers, lab.r, "o-", label="measured R")ax1.semilogx(lab.rating.band_centers, lab.rating.shifted_reference, "s--",             label="shifted reference")ax1.set_title(f"Rw = {lab.rating.rating} dB")ax2.semilogx(imp.rating.band_centers, imp.l_n, "o-", label="normalized Ln")ax2.semilogx(imp.rating.band_centers, imp.rating.shifted_reference, "s--",             label="shifted reference")ax2.set_title(f"Ln,w = {imp.rating.rating} dB")for ax in (ax1, ax2):    ax.set_xlabel("Frequency [Hz]")    ax.legend()ax1.set_ylabel("Sound reduction index R [dB]")ax2.set_ylabel("Impact sound pressure level Ln [dB]")plt.show()
lab_airborne_insulation() / lab_impact_insulation() parameters
Section titled “lab_airborne_insulation() / lab_impact_insulation() parameters”| Parameter | Type | Units | Range / default | Notes |
|---|---|---|---|---|
l1 / l2 | 1D or 2D array | dB | one/band, or (positions, bands) | Source / receiving levels (airborne) |
li | 1D or 2D array | dB | one/band, or (positions, bands) | Impact SPL from the tapping machine (impact) |
t2 | 1D array | s | > 0, one per band | Receiving-room reverberation time |
area | float | m² | > 0 | Free test-opening area S (airborne only) |
volume | float | m³ | > 0 | Receiving-room volume V |
lab_airborne_insulation() returns a LabAirborneInsulationResult (r,
absorption, rating); lab_impact_insulation() a
LabImpactInsulationResult (l_n, absorption, rating);
background_correction(signal_and_background, background) returns the corrected
levels directly.
ISO 10140 laboratory test report (.report())
Section titled “ISO 10140 laboratory test report (.report())”Both laboratory results write the one-page ISO 10140 test report directly, laid
out like the accredited laboratory reports rated per ISO 717.
LabAirborneInsulationResult.report() renders the sound reduction index
fiche (ISO 10140-2:2010) and LabImpactInsulationResult.report() the
normalized impact sound pressure level fiche (ISO 10140-3:2010). Each
fiche names the laboratory standard in its basis line, evaluates the
ISO 717-1 / ISO 717-2 single-number rating (16 one-third-octave bands from
100 Hz to 3150 Hz, or the 5 octave bands), states the quantity to one decimal
place both in tabular form and as a curve against the shifted reference curve,
boxes the laboratory rating (Rw (C; Ctr) or Ln,w (CI)) and prints the
statement that the evaluation is based on laboratory measurement results
obtained by a precision method. Because a qualified suite suppresses flanking
transmission, the reported quantity is the direct / , not the field
/ .
verbose=True annexes the per-band equivalent sound absorption area
(ISO 10140-4:2010) beside the reported quantity, the
normalization datum the laboratory report carries. Metadata (client, specimen,
mounting, room volumes, climatic conditions), the requirement verdict (airborne
passes at or above it, impact at or below it), language="es" and the
phonometry[report] extra behave exactly as in the ISO 717 and ISO 16283
fiches.
import numpy as npfrom phonometry import building, ReportMetadata
# Laboratory airborne: source/receiving levels and T per one-third-octave bandl1 = np.full(16, 90.0)r = np.array([20.4, 16.3, 17.7, 22.6, 22.4, 22.7, 24.8, 26.6,              28.0, 30.5, 31.8, 32.5, 33.4, 33.0, 31.0, 25.5])lab = building.lab_airborne_insulation(    l1, l1 - r, np.full(16, 0.8), area=10.0, volume=50.0)lab.plot()   # measured R vs shifted ISO 717-1 reference (needs matplotlib)metadata = ReportMetadata(    specimen="100 mm autoclaved aerated concrete block wall",    client="Example client",    area=10.0, mass_per_area=75.0,    source_volume=53.0, receiving_volume=50.0,    test_room="Transmission suite (example)",    mounting="Type A mounting, mortar-bedded perimeter (ISO 10140-1)",    measurement_standard="ISO 10140-2",    laboratory="Phonometry Reference Laboratory",    report_id="PHN-2026-0143",    requirement=30.0,               # Rw >= 30 dB -> PASS/FAIL row)lab.report("Rw_lab.pdf", metadata=metadata)            # Rw (C; Ctr)lab.report("Rw_lab_chain.pdf", metadata=metadata,           verbose=True)                               # f | A | R
# Laboratory impact: tapping-machine levels in the receiving roomli = np.array([62.1, 63.2, 63.5, 66.2, 68.5, 70.0, 71.7, 73.1,               73.8, 73.5, 73.8, 73.3, 73.1, 73.0, 72.4, 71.2])imp = building.lab_impact_insulation(li, np.full(16, 0.8), volume=50.0)imp.report("Lnw_lab.pdf",           metadata=ReportMetadata(requirement=80.0))  # Ln,w (CI)
Both example fiches are regenerated with make reports and kept in the
repository. Click either preview to open the PDF:
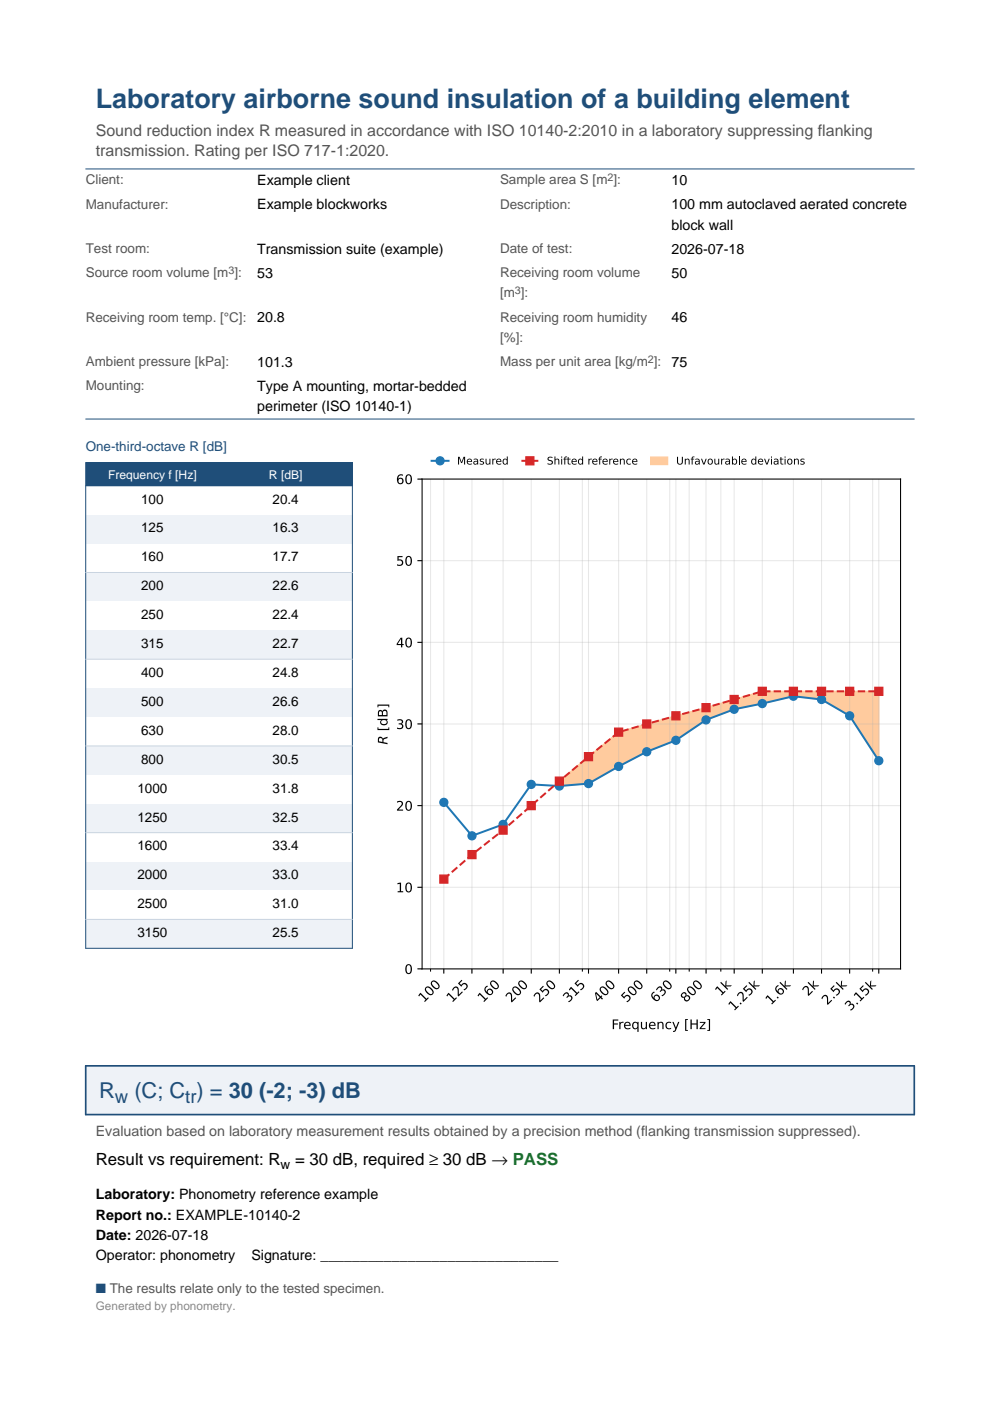
One-page laboratory airborne sound insulation test report of a building element: the metadata header (client, specimen description, mounting, sample area, room volumes, climate), the one-third-octave R table beside the measured-versus-shifted-reference curve, the boxed Rw (C; Ctr) laboratory rating, the precision-method statement and a PASS verdict against the 30 dB requirement.
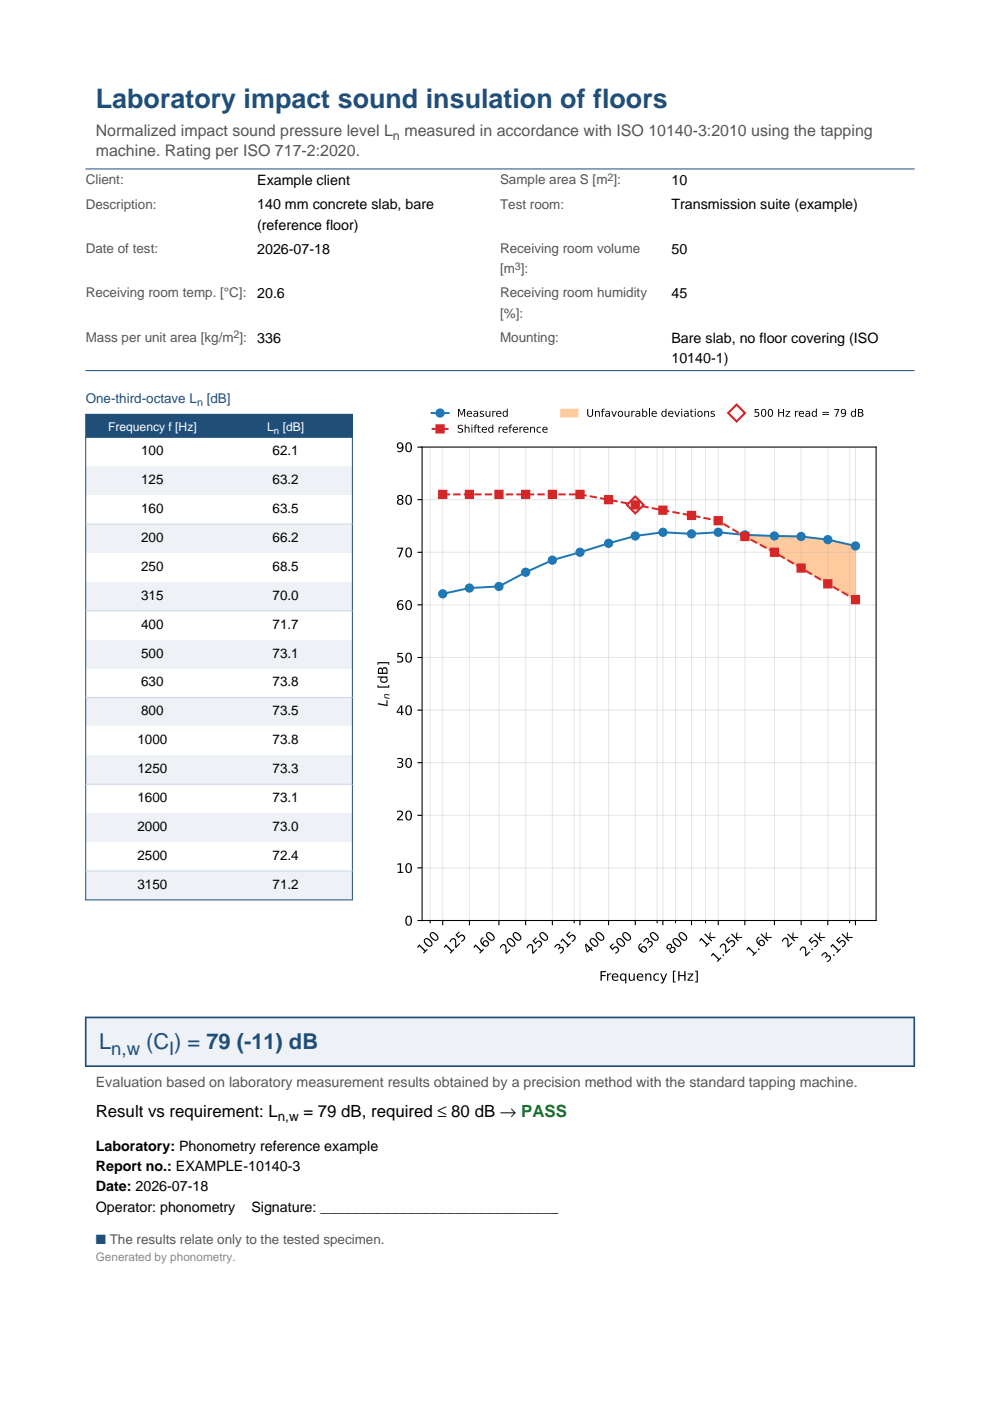
One-page laboratory impact sound insulation test report for a floor under tapping-machine excitation: the metadata header, the one-third-octave Ln table beside the measured-versus-shifted-reference curve with the 500 Hz read-off, the boxed Ln,w (CI) laboratory rating, the precision-method statement and a PASS verdict against the 80 dB requirement (a lower impact level is better).
Sound insulation by intensity (ISO 15186)
Section titled “Sound insulation by intensity (ISO 15186)”The ISO 10140 laboratory method above reads the transmitted power indirectly, from the receiving-room level and its absorption area; this breaks down when flanking paths leak power the room integrates in anyway. The sound-intensity method (ISO 15186) sidesteps that: an intensity probe scans a measurement surface that encloses the specimen and measures the radiated power directly, so only the element under test contributes. It is the tool of choice when flanking is high (ISO 15186-1:2000, Clause 1). From the source-room level and the average normal intensity level over the surface (area ), for a specimen of area ,
where the dB is the diffuse-field offset between the sound pressure level and the incident intensity level. The same formula gives the apparent index in the field (ISO 15186-2). Because the intensity method slightly underestimates the power radiated into a real receiving room, a modified index reproduces the ISO 10140-2 pressure result; the adaptation term (Annex B) is for a well-defined room, or the room-independent . For small elements the element normalized level difference replaces with (, element units).
import numpy as npfrom phonometry import building
# Source-room level Lp1 and the average normal intensity level LIn over the# measurement surface (Sm), for a specimen of area S; 16 one-third-octave bands.lp1 = np.full(16, 85.0)l_in = np.full(16, 40.0)freqs = [100, 125, 160, 200, 250, 315, 400, 500, 630, 800,         1000, 1250, 1600, 2000, 2500, 3150]   # nominal 1/3-octave centreskc = building.adaptation_term_kc(freqs)                  # Annex B (B.2)res = building.intensity_sound_reduction(lp1, l_in, measurement_area=12.0, area=10.0, kc=kc)print(round(float(res.r_i[0]), 2))          # 38.21  RI = Lp1 - 6 - [LIn + 10 lg(Sm/S)]print(round(float(res.r_i_modified[0]), 2)) # 40.29  RI,M = RI + Kcprint(res.rating.rating)                     # 38  ->  RI,w (ISO 717-1 engine)
# Qualify the measurement surface: FpI = Lp - LIn must stay < 10 dB (< 6 dB when# the receiving side is absorbing); the probe's residual index must exceed FpI+10.fpi = building.surface_pressure_intensity_indicator(np.full(16, 46.0), l_in)print(round(float(fpi[0]), 1))               # 6.0
res.plot()   # measured RI vs shifted ISO 717-1 reference (needs matplotlib)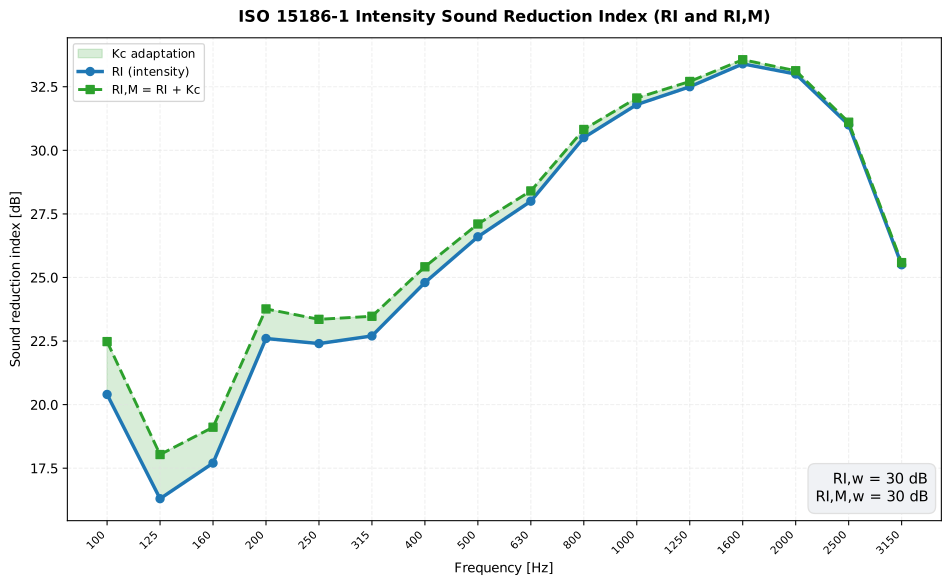
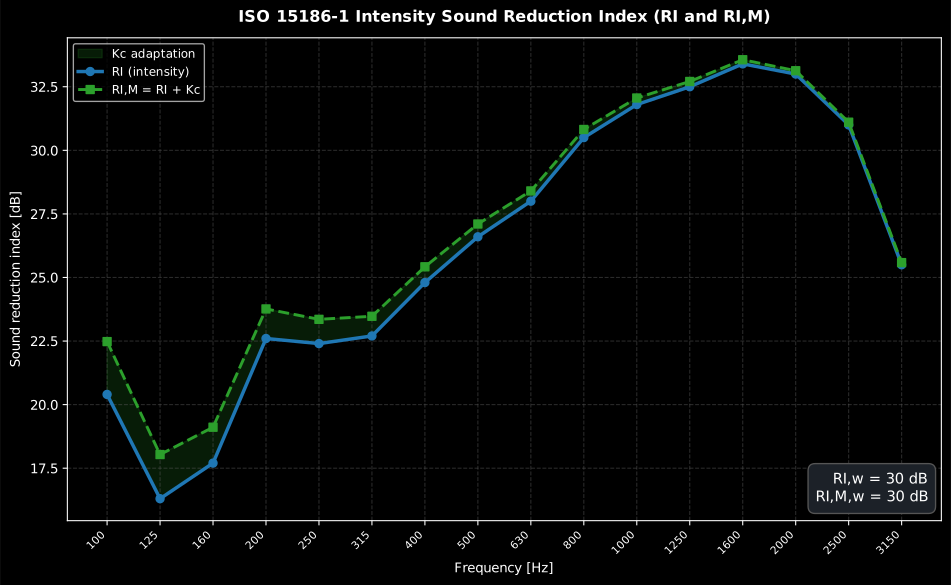
The modified index lifts (most at the low bands,
where is largest), so an intensity measurement reproduces the ISO 10140-2
pressure result. The automatic rating is formed only for exactly 16
one-third-octave or 5 octave values (rating/rating_modified are None
otherwise). Subareas scanned separately are combined first with
combine_subareas (Formulas (11)-(12)); a subarea whose net energy flows back
towards the specimen enters with a negative area, applying the minus-sign rule
of Clause 6.4.6 while keeps the unsigned area sum.
Show the code for this figure
import matplotlib.pyplot as pltimport numpy as npfrom phonometry import building
# A light wall: source-room SPL Lp1 = 85 dB and the measured normal intensity# level LIn over the Sm = 12 m2 surface, 16 one-third-octave bands.freqs = [100, 125, 160, 200, 250, 315, 400, 500, 630, 800,         1000, 1250, 1600, 2000, 2500, 3150]l_in = np.array([57.8, 61.9, 60.5, 55.6, 55.8, 55.5, 53.4, 51.6,                 50.2, 47.7, 46.4, 45.7, 44.8, 45.2, 47.2, 52.7])kc = building.adaptation_term_kc(freqs)           # Annex B adaptation termres = building.intensity_sound_reduction(np.full(16, 85.0), l_in,                                         measurement_area=12.0, area=10.0,                                         kc=kc)
x = np.arange(len(freqs))fig, ax = plt.subplots()ax.fill_between(x, res.r_i, res.r_i_modified, alpha=0.2, label="Kc adaptation")ax.plot(x, res.r_i, "-o", label="RI (intensity)")ax.plot(x, res.r_i_modified, "--s", label="RI,M = RI + Kc")ax.set_xticks(x, [str(f) for f in freqs], rotation=45)ax.set(xlabel="Frequency [Hz]", ylabel="Sound reduction index [dB]",       title=f"RI,w = {res.rating.rating} dB, RI,M,w = {res.rating_modified.rating} dB")ax.legend()plt.show()
intensity_sound_reduction() / adaptation_term_kc() parameters
Section titled “intensity_sound_reduction() / adaptation_term_kc() parameters”| Parameter | Type | Units | Range / default | Notes |
|---|---|---|---|---|
lp1 | 1D or 2D array | dB | one/band, or (positions, bands) | Source-room sound pressure level |
l_in | 1D or 2D array | dB | one/band, or (positions, bands) | Normal intensity level over the surface |
measurement_area | float | m² | > 0 | Measurement-surface area Sm |
area | float | m² | > 0 | Specimen area S |
kc | 1D array | dB | one per band / None | Adaptation term for the modified index |
freq | 1D array | Hz | > 0 | Midband frequencies (adaptation_term_kc) |
boundary_area / volume | float | m² / m³ | > 0, both or neither | Room Sb2 / V2 for Formula (B.1) |
intensity_sound_reduction() returns an IntensityReductionResult (r_i,
r_i_modified, rating, rating_modified);
intensity_element_normalized_difference() an
IntensityElementNormalizedResult (d_i_n_e, rating);
surface_pressure_intensity_indicator() and combine_subareas() return arrays.
ISO 15186-1 intensity test report (.report())
Section titled “ISO 15186-1 intensity test report (.report())”IntensityReductionResult.report() writes the one-page ISO 15186-1:2000 test
report of the intensity sound reduction index , reusing the same
accredited two-panel layout as the ISO 10140 and ISO 16283 fiches. Because
is an ordinary sound reduction index, its single-number rating
is the ISO 717-1 airborne rating evaluated on the intensity spectrum: the fiche
names ISO 15186-1 in its basis line, tabulates to one decimal place
beside the measured-versus-shifted-reference curve, boxes RI,w (C; Ctr) and
prints the statement that the transmitted sound power was measured directly
over the measurement surface. verbose=True annexes the -modified index
(Formula (9)) beside when an adaptation term was supplied.
The applicable ReportMetadata fields describe the intensity measurement:
specimen (the tested element), area (specimen area ), client,
manufacturer, test_room, laboratory, operator, report_id and
test_date, plus the room/climate fields shared with the other insulation
fiches. There is no dedicated field for the measurement-surface geometry or the
scanning-versus-discrete-point acquisition method; record those in notes and
name the standard in measurement_standard ("ISO 15186-1"). The requirement
verdict, language="es" and the phonometry[report] extra behave exactly as
in the sibling fiches.
import numpy as npfrom phonometry import building, ReportMetadata
freqs = np.array([100, 125, 160, 200, 250, 315, 400, 500, 630, 800,                  1000, 1250, 1600, 2000, 2500, 3150], dtype=float)lp1, sm, s = 85.0, 12.0, 10.0l_in = np.array([57.8, 61.9, 60.5, 55.6, 55.8, 55.5, 53.4, 51.6,                 50.2, 47.7, 46.4, 45.7, 44.8, 45.2, 47.2, 52.7])kc = building.adaptation_term_kc(freqs)                 # Annex B, Formula (B.2)res = building.intensity_sound_reduction(    np.full(16, lp1), l_in, measurement_area=sm, area=s, kc=kc)metadata = ReportMetadata(    specimen="100 mm autoclaved aerated concrete block wall",    area=10.0, measurement_standard="ISO 15186-1",    test_room="Transmission suite (example)",    laboratory="Phonometry Reference Laboratory",    report_id="PHN-2026-0150",    requirement=30.0,                                   # RI,w >= 30 dB -> PASS)res.report("RIw.pdf", metadata=metadata)                # RI,w (C; Ctr)res.report("RIw_kc.pdf", metadata=metadata, verbose=True)  # f | RI | RI,M
The example fiche is regenerated with make reports and kept in the
repository. Click the preview to open the PDF:
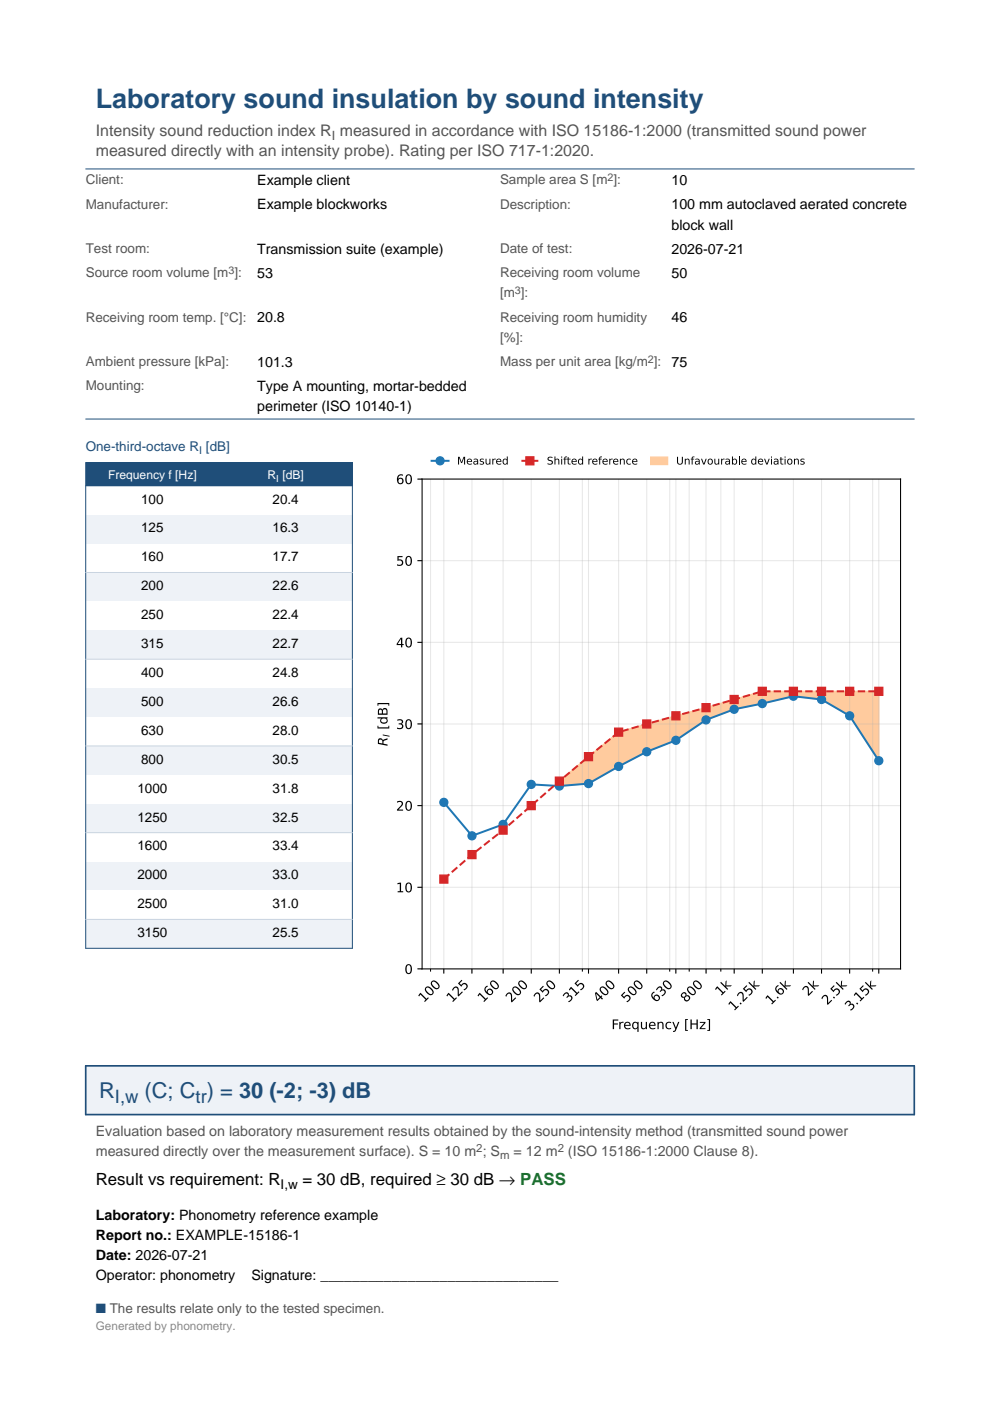
One-page laboratory intensity sound insulation test report of a building element: the metadata header (client, specimen description, mounting, sample area, room volumes, climate), the one-third-octave RI table beside the measured-versus-shifted-reference curve, the boxed RI,w (C; Ctr) rating evaluated per ISO 717-1, the intensity-method statement and a PASS verdict against the 30 dB requirement.
For a small building element (a ventilator, a socket, a small window) the
intensity method reports the element-normalized level difference
(Formula (8)) instead, normalized to the reference absorption area
. IntensityElementNormalizedResult.report() writes the
same one-page fiche through the shared renderer, boxing DI,n,e,w (C; Ctr)
rated per ISO 717-1; verbose=True shows the ISO 717 evaluation per band and a
requirement adds a PASS/FAIL verdict (the element insulation passes at or
above the target).
import numpy as npfrom phonometry import building, ReportMetadata
lp1, sm, n = 85.0, 12.0, 1                              # source SPL, surface, unitsl_in = np.array([57.9, 62.0, 60.6, 55.7, 55.9, 55.6, 53.5, 51.7,                 50.3, 47.8, 46.5, 45.8, 44.9, 45.3, 47.3, 52.8])res = building.intensity_element_normalized_difference(    np.full(16, lp1), l_in, measurement_area=sm, n=n)res.plot()   # DI,n,e vs shifted ISO 717-1 reference (needs matplotlib)metadata = ReportMetadata(    specimen="Trickle ventilator in a 100 mm masonry wall",    measurement_standard="ISO 15186-1",    laboratory="Phonometry Reference Laboratory",    report_id="PHN-2026-0151",    requirement=30.0,                                   # DI,n,e,w >= 30 dB -> PASS)res.report("DIne.pdf", metadata=metadata)               # DI,n,e,w (C; Ctr)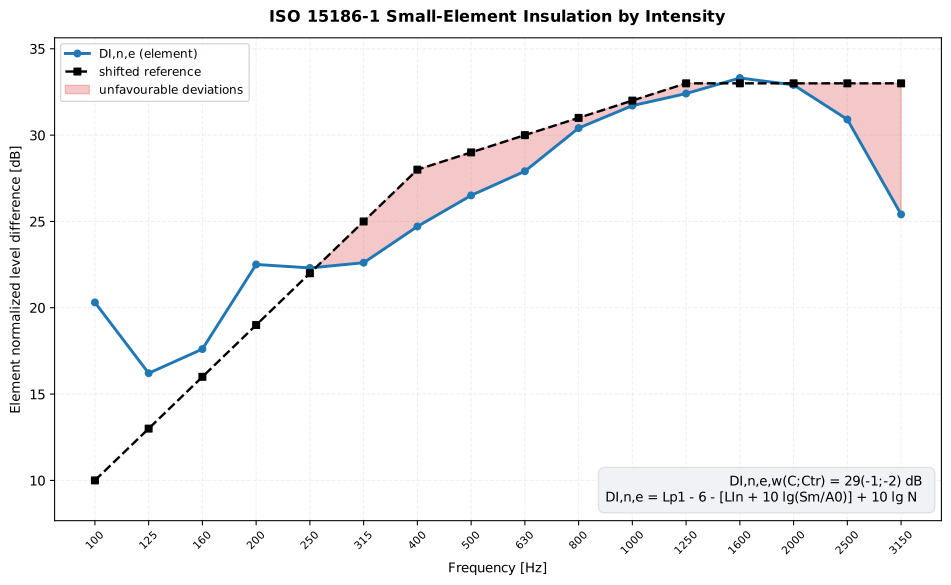
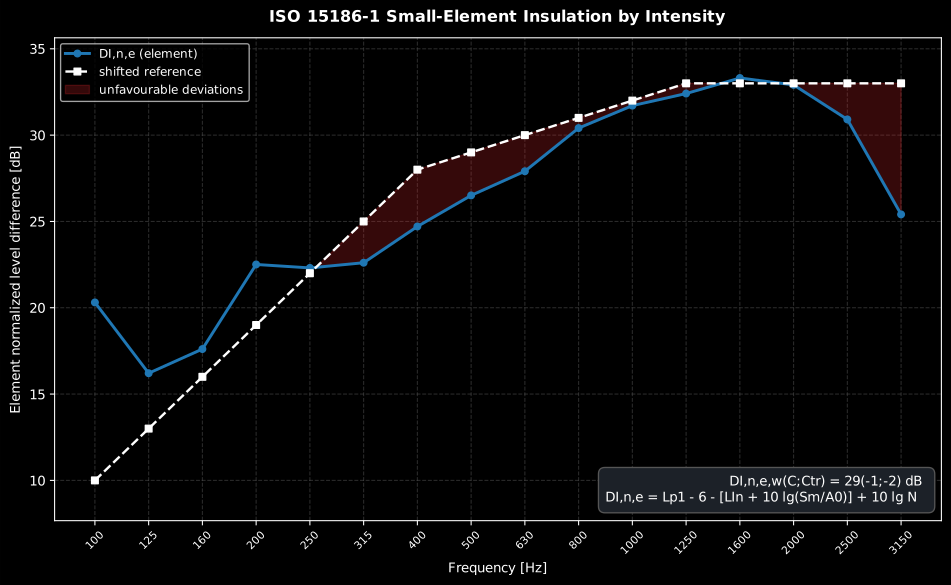
The small element is rated exactly like a wall: feeds the ISO 717-1 engine and the unfavourable deviations (reference above the measurement) set . The normalization replaces the specimen-area term, so the number describes the element irrespective of the wall it sits in.
Show the code for this figure
import matplotlib.pyplot as pltimport numpy as npfrom phonometry import building
# A trickle ventilator in a masonry wall: source-room SPL 85 dB and the# normal intensity level over the Sm = 12 m2 measurement surface.l_in = np.array([57.9, 62.0, 60.6, 55.7, 55.9, 55.6, 53.5, 51.7,                 50.3, 47.8, 46.5, 45.8, 44.9, 45.3, 47.3, 52.8])res = building.intensity_element_normalized_difference(    np.full(16, 85.0), l_in, measurement_area=12.0, n=1)
# One line — DI,n,e vs the shifted ISO 717-1 reference:res.plot()plt.show()
# By hand, from the rating the result carries:w = res.ratingfig, ax = plt.subplots()ax.semilogx(w.band_centers, res.d_i_n_e, "o-", label="DI,n,e (element)")ax.semilogx(w.band_centers, w.shifted_reference, "s--",            label="shifted reference")ax.fill_between(w.band_centers, w.measured, w.shifted_reference,                where=w.measured < w.shifted_reference, interpolate=True,                alpha=0.3, label="unfavourable deviations")ax.set_xlabel("Frequency [Hz]")ax.set_ylabel("Element normalized level difference [dB]")ax.set_title(f"DI,n,e,w = {w.rating} dB  (C={w.c:+d}; Ctr={w.ctr:+d})")ax.legend()plt.show()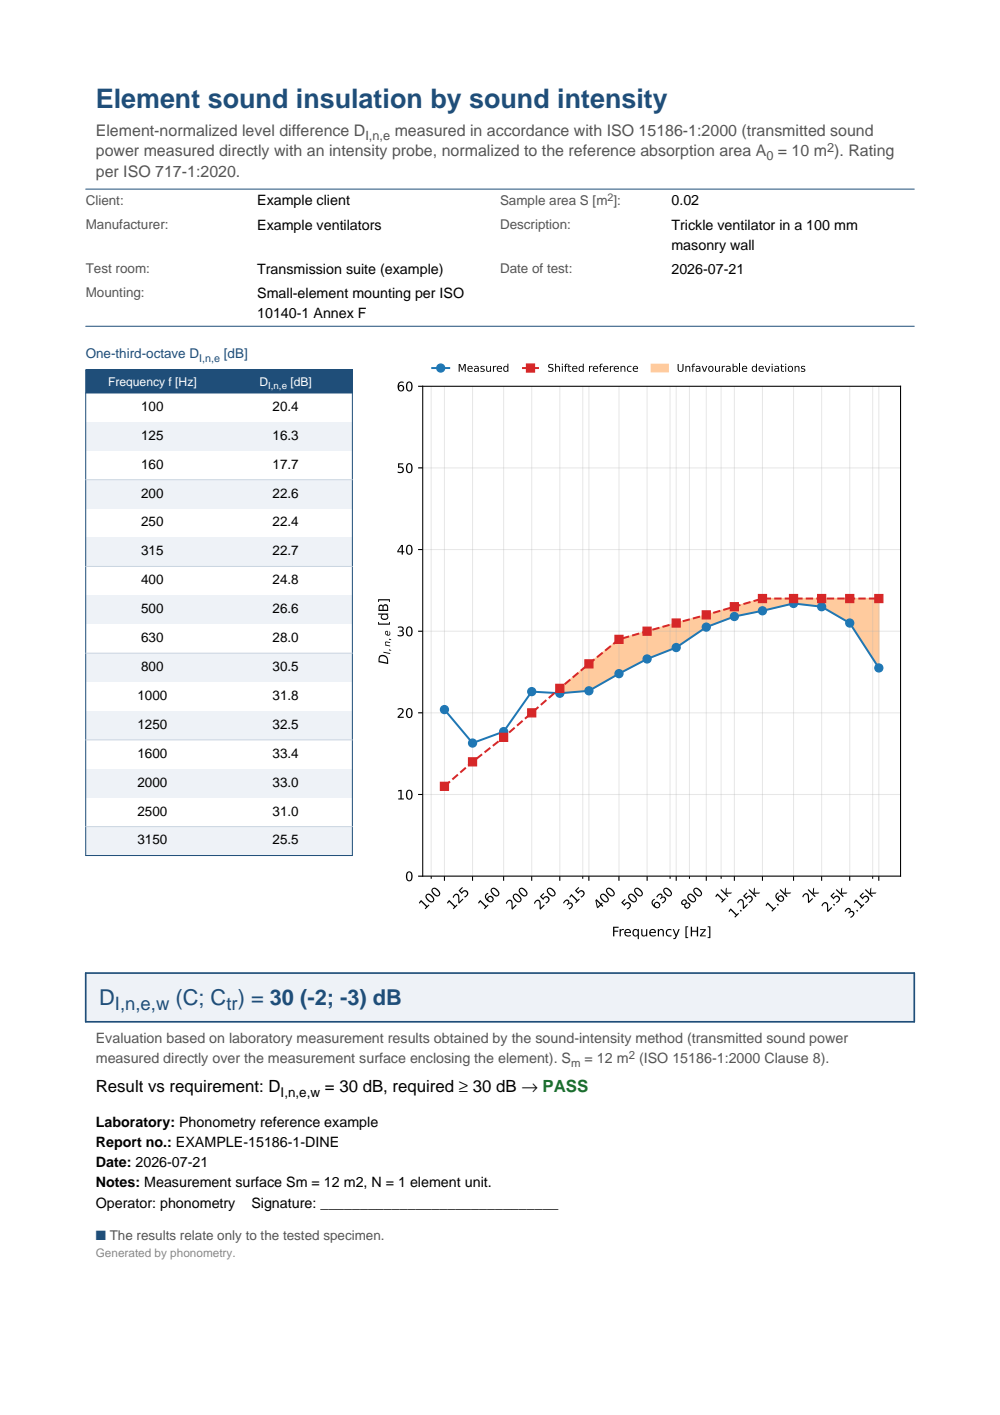
One-page laboratory element-normalized sound intensity insulation test report of a small building element: the metadata header (client, specimen description, mounting, element area), the one-third-octave DI,n,e table beside the measured-versus-shifted-reference curve, the boxed DI,n,e,w (C; Ctr) rating evaluated per ISO 717-1, the intensity-method statement and a PASS verdict against the 30 dB requirement.
Floor-covering impact improvement (ISO 16251-1)
Section titled “Floor-covering impact improvement (ISO 16251-1)”ISO 16251-1:2014 is a laboratory method for the improvement of impact sound insulation of a soft, locally-reacting floor covering (carpet, PVC, linoleum). The two ISO 10140 rooms are replaced by a small softly-supported concrete plate; a standard tapping machine excites it and the structure-borne acceleration level on the underside is measured with and without the covering. For locally-reacting coverings that acceleration-level difference equals the ISO 10140 impact sound reduction.
Acceleration level (Formula (1)). dB, reference . Background correction (Formula (2)) follows the ISO 10140 three-branch rule (unchanged ≥ 15 dB; energy subtraction for 6 ≤ margin < 15 dB; the 1.3 dB limit below 6 dB, flagged as ). The improvement is the position-averaged difference (Formulae (3)/(4)); octaves follow (Formula (5)).
Weighted improvement. is the ISO 717-2 weighted reduction: the
improvement is applied to the heavyweight reference floor
(ISO 717-2 Table 4), , and
, computed by weighted_impact_improvement(), which
reuses the verified ISO 717-2 rating engine. A clause 6.3 measurement spans 18
bands (100–5000 Hz, optionally extended to 50 Hz); the rating is formed on the
100–3150 Hz sub-range of whatever spectrum contains it. The statement of
results (clause 8 e)) also carries the spectrum adaptation term
(ISO 717-2:2020 Formula (A.4)), exposed as
ci_delta on the result and standalone as
impact_improvement_adaptation_term().
Show the code for this figure
import matplotlib.pyplot as pltimport numpy as npfrom phonometry import building
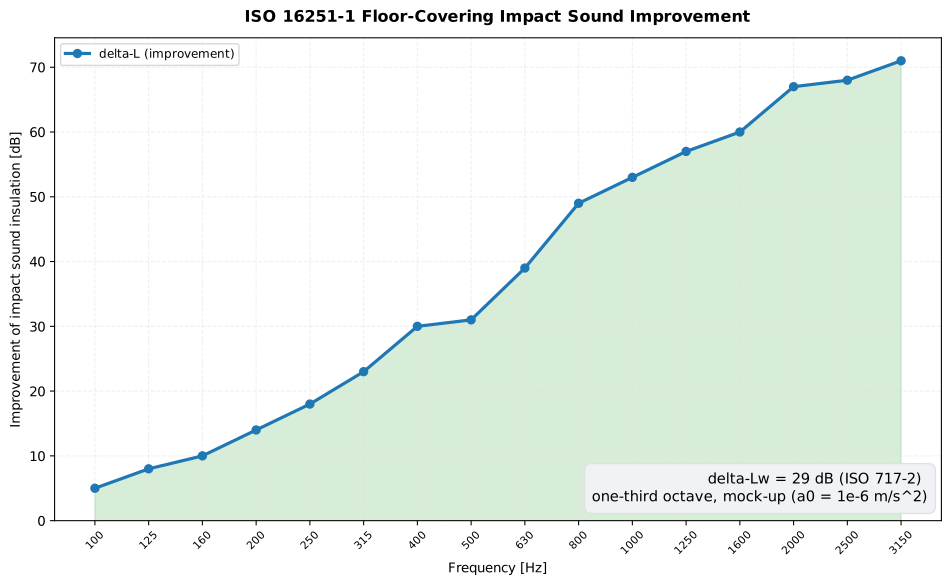
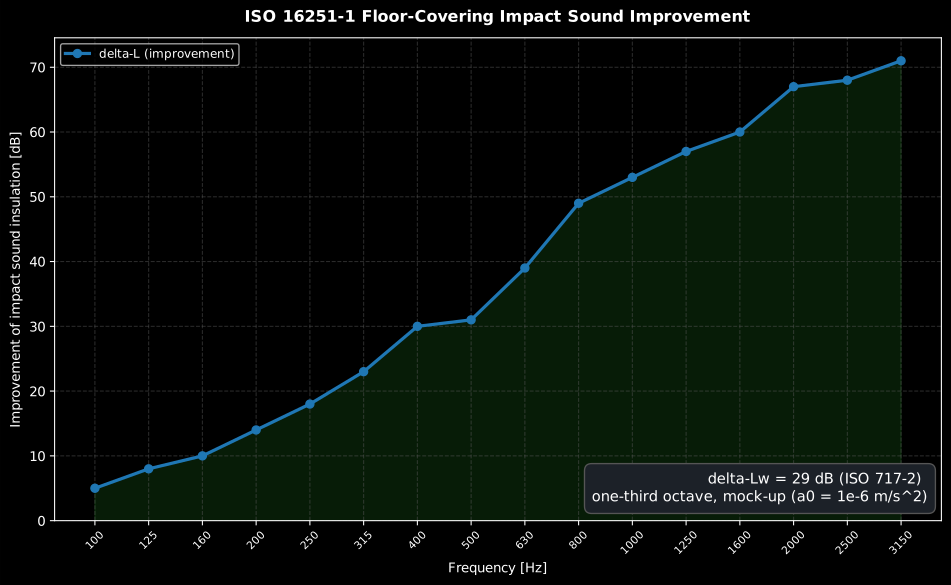
freqs = [100, 125, 160, 200, 250, 315, 400, 500,         630, 800, 1000, 1250, 1600, 2000, 2500, 3150]bare = np.full(16, 78.0)                       # bare-plate acceleration level# A real textile carpet measured on the CSTB mock-up (Foret et al. 2011, Fig. 4).covering = bare - np.array([5, 8, 10, 14, 18, 23, 30, 31,                            39, 49, 53, 57, 60, 67, 68, 71])res = building.impact_improvement(bare, covering, freqs)print(res.delta_lw)   # weighted improvement delta-Lw = 29 dB (ISO 717-2)res.plot()plt.show()
from phonometry import building
# delta-Lw straight from an improvement spectrum (16 one-third-octave bands):delta_l = [5, 8, 10, 14, 18, 23, 30, 31, 39, 49, 53, 57, 60, 67, 68, 71]print(building.weighted_impact_improvement(delta_l)) # 29 dB (carpet)
# From the measured bare/covered acceleration levels, with a background trace:freqs = [100, 125, 160, 200, 250, 315, 400, 500, 630, 800, 1000, 1250, 1600, 2000, 2500, 3150]bare_levels = [72, 73, 74, 74, 75, 75, 76, 76, 77, 77, 78, 78, 79, 79, 80, 80]covered_levels = [b - d for b, d in zip(bare_levels, delta_l)]bg = [40.0] * 16res = building.impact_improvement(bare_levels, covered_levels, freqs, background=bg)res.improvement # delta-L per bandres.delta_lw # weighted single number (rated on the 100-3150 Hz sub-range)res.ci_delta # spectrum adaptation term CI,delta (Formula (A.4))res.limited # bands at the 1.3 dB limit of measurement (> delta-L)res.octave_bands() # (octave freqs, delta-L_oct) via Formula (5)res.plot() # the delta-L(f) improvement spectrum above (needs matplotlib)ISO 16251-1 impact-improvement report (.report())
Section titled “ISO 16251-1 impact-improvement report (.report())”FloorCoveringImprovementResult.report(path) writes a one-page accredited
impact-improvement fiche: the standard-basis line, a metadata header, the
per-band table (frequency and , bands at the 1.3 dB limit prefixed
>) beside the improvement curve, the boxed single-number
(the ISO 16251-1 Clause 8 e) statement of results),
and a footer. Pass a ReportMetadata for the header; the applicable fields are
specimen (the floor covering under test), client, manufacturer,
mounting, mass_per_area, test_room, test_date, temperature,
pressure, measurement_standard, laboratory, operator, report_id,
notes and requirement (a higher weighted improvement is better, so the
verdict passes at or above it). The bare reference floor is the standardised
heavyweight floor of ISO 717-2:2020 Table 4, fixed by the standard.
verbose=True adds the reference-floor-with-covering column
, the derivation basis of .
from phonometry import building, ReportMetadata
freqs = [100, 125, 160, 200, 250, 315, 400, 500,         630, 800, 1000, 1250, 1600, 2000, 2500, 3150]delta_l = [5, 8, 10, 14, 18, 23, 30, 31, 39, 49, 53, 57, 60, 67, 68, 71]bare = [78.0] * 16res = building.impact_improvement(bare, [b - d for b, d in zip(bare, delta_l)], freqs)res.report("dLw.pdf",           metadata=ReportMetadata(               specimen="Textile floor covering (carpet), laid loose",               measurement_standard="ISO 16251-1",               requirement=20.0))  # delta-Lw (CI,delta) = 29 (-13) dB
The example fiche is regenerated with make reports and kept in the
repository. Click the preview to open the PDF:
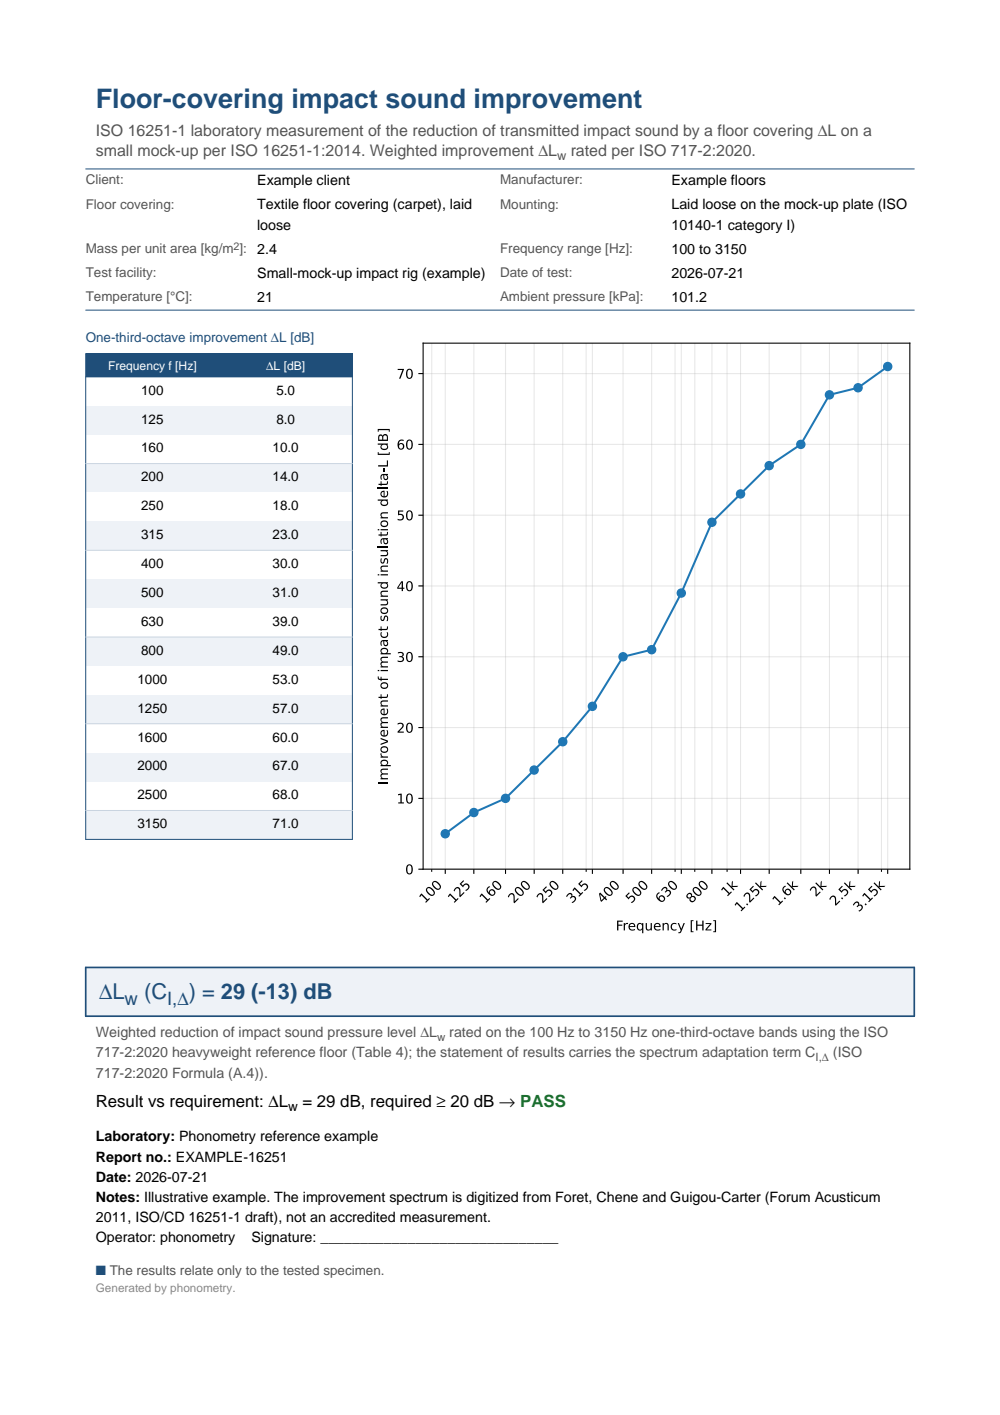
One-page floor-covering impact-improvement test report for a soft carpet whose improvement spectrum is digitized from the Foret et al. (2011) ISO/CD 16251-1 comparison study (an illustrative example, not an accredited measurement): the metadata header (client, floor-covering description, mounting, mass per area, climate), the one-third-octave delta-L table beside the delta-L(f) improvement curve rising with frequency, the boxed delta-Lw (CI,delta) = 29 (-13) dB weighted improvement (ISO 717-2), and a PASS verdict against the 20 dB requirement (a higher weighted improvement is better).
Laboratory flanking transmission (ISO 10848)
Section titled “Laboratory flanking transmission (ISO 10848)”ISO 10848:2006/2010 is the laboratory method that measures the junction
vibration reduction index that the EN 12354 prediction takes
as an input, together with the overall flanking descriptors
(airborne) and (impact). It is the measurement counterpart of the
empirical junction_vibration_reduction() of that prediction.
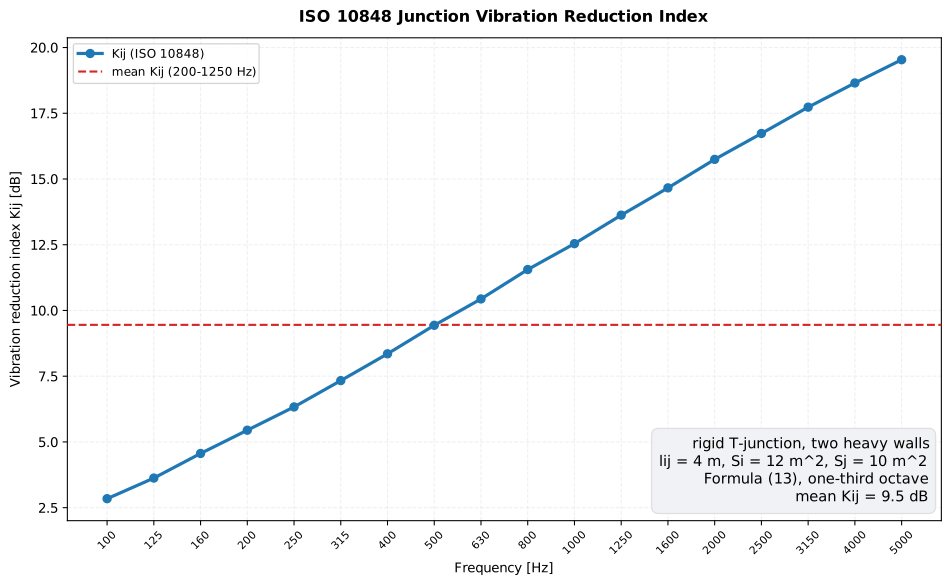
Vibration reduction index (Formula (13)). dB, from the direction-averaged velocity level difference (Formula (11), which makes symmetric), the common-edge junction length and the equivalent absorption lengths (Formula (12), Hz). For lightweight well-damped elements ( m) and Formula (13) reduces to the simplified Formula (14). The related total loss factor is .
Overall descriptors. (Formula (4), airborne) and (Formula (5), tapping machine), ; their / single numbers reuse the ISO 717 rating engines. The single-number is the arithmetic mean over 200–1250 Hz for one-third-octave bands, or over 125–1000 Hz for octave bands (Annex A).
Show the code for this figure
import matplotlib.pyplot as pltimport numpy as npfrom phonometry import building
freqs = [100, 125, 160, 200, 250, 315, 400, 500, 630,         800, 1000, 1250, 1600, 2000, 2500, 3150, 4000, 5000]# Direction-averaged velocity level difference of a rigid T-junction (dB):dv = np.array([4.5, 4.8, 5.2, 5.6, 6.0, 6.5, 7.0, 7.6, 8.1, 8.7,               9.2, 9.8, 10.3, 10.9, 11.4, 11.9, 12.3, 12.7])res = building.vibration_reduction_index(    dv, junction_length=4.0, area_i=12.0, area_j=10.0, frequency=freqs,    structural_reverberation_time_i=0.35, structural_reverberation_time_j=0.40,)print(res.single_number)   # mean Kij over 200-1250 Hz (Annex A)res.plot()plt.show()
Validity. rests on a statistical-energy-analysis simplification:
strong_coupling_satisfied() checks the Formula (15) inequality and, for the
heavy junctions of Part 4, modal_density(), band_mode_count() and
modal_overlap_factor() (Formulae (5)/(4)/(6)) quantify where the mode count
is too low for to be reliable. Pass the per-band modal overlap factor
to vibration_reduction_index(..., modal_overlap=M): bands with
are flagged in result.bracketed and excluded from the single-number
, as Part 4 Clause 9 requires. Because ISO 10848 contains no
worked numeric example, conformance is anchored on closed-form identities
(simplified , at , ).
import numpy as npfrom phonometry import building
freqs = [200, 250, 315, 400, 500, 630, 800, 1000, 1250]lij, s_i, s_j = 4.0, 12.0, 10.0     # junction length (m), element areas (m^2)ts = np.linspace(0.30, 0.10, 9)     # structural reverberation time Ts (s)dv_ij = [5.6, 6.0, 6.5, 7.0, 7.6, 8.1, 8.7, 9.2, 9.8]    # element i excited (dB)dv_ji = [6.4, 6.8, 7.3, 7.8, 8.4, 8.9, 9.5, 10.0, 10.6]  # element j excited (dB)
# Kij from both excitation directions (symmetric via the direction average):dbar = building.direction_averaged_level_difference(dv_ij, dv_ji)res = building.vibration_reduction_index(dbar, lij, s_i, s_j, frequency=freqs,                                structural_reverberation_time_i=ts,                                structural_reverberation_time_j=ts)res.k_ij           # Kij per band (Formula (13))res.single_number  # mean Kij over 200-1250 Hz, or None without the band setres.octave_bands() # Kij in octave bands (its single number averages 125-1000 Hz)
# Overall airborne flanking descriptor and a Part-4 modal-overlap validity check:dnf = building.normalized_flanking_level_difference(np.full(9, 75.0), np.full(9, 42.0),                                           absorption_area=np.full(9, 12.0))m = building.modal_overlap_factor(s_i, critical_frequency=85.0,                         structural_reverberation_time=ts)res_m = building.vibration_reduction_index(dbar, lij, s_i, s_j, frequency=freqs,                                  modal_overlap=m)   # M < 0.25 bands bracketedres_m.bracketed    # per-band flags; bracketed bands leave the single number
# With 16 one-third-octave (or 5 octave) bands, dnf.plot() draws Dn,f vs the# shifted ISO 717-1 reference with Dn,f,w annotated (needs matplotlib):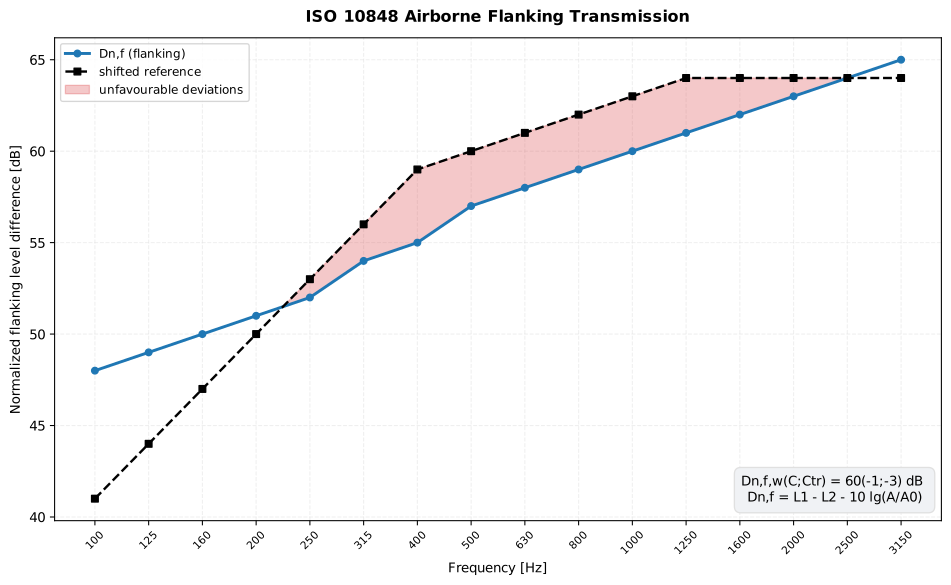
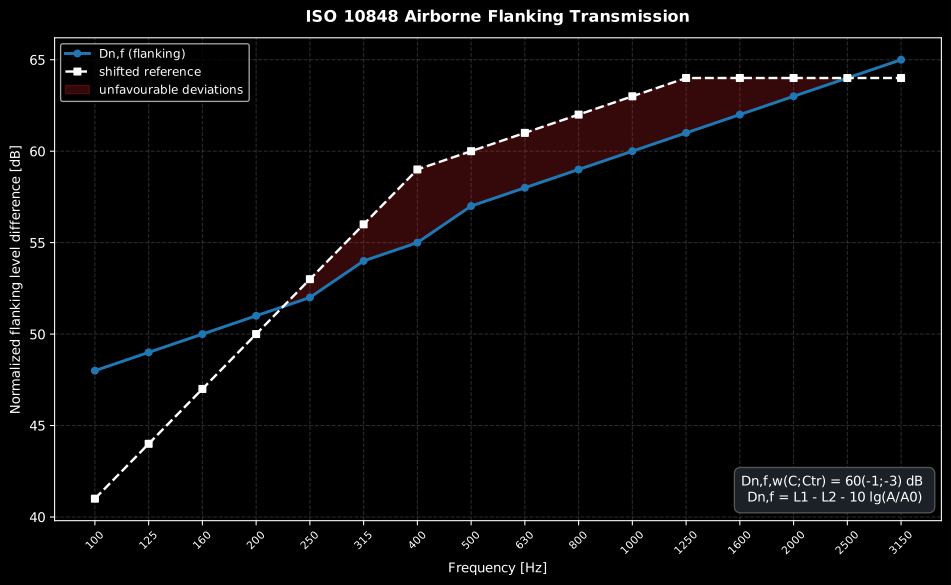
The overall flanking descriptor is an airborne quantity, so its single number comes from the unchanged ISO 717-1 engine; it drops straight into the EN 12354-1 model as the flanking-path datum of the tested junction (the impact counterpart rates per ISO 717-2 the same way).
Show the code for this figure
import matplotlib.pyplot as pltimport numpy as npfrom phonometry import building
# A lightweight junction in the laboratory: source-room level, receiving-room# level over the flanking path, and the receiving-room absorption area.l1 = np.full(16, 80.0)dnf_target = np.array([48, 49, 50, 51, 52, 54, 55, 57,                       58, 59, 60, 61, 62, 63, 64, 65], dtype=float)dnf = building.normalized_flanking_level_difference(    l1, l1 - dnf_target, absorption_area=np.full(16, 10.0))
# One line — Dn,f vs the shifted ISO 717-1 reference:dnf.plot()plt.show()
# By hand, from the rating the result carries:w = dnf.ratingfig, ax = plt.subplots()ax.semilogx(w.band_centers, dnf.d_n_f, "o-", label="Dn,f (flanking)")ax.semilogx(w.band_centers, w.shifted_reference, "s--",            label="shifted reference")ax.fill_between(w.band_centers, w.measured, w.shifted_reference,                where=w.measured < w.shifted_reference, interpolate=True,                alpha=0.3, label="unfavourable deviations")ax.set_xlabel("Frequency [Hz]")ax.set_ylabel("Normalized flanking level difference [dB]")ax.set_title(f"Dn,f,w = {w.rating} dB  (C={w.c:+d}; Ctr={w.ctr:+d})")ax.legend()plt.show()
ISO 10848 flanking-transmission reports (.report())
Section titled “ISO 10848 flanking-transmission reports (.report())”Each of the three results renders a one-page PDF fiche. VibrationReductionResult.report()
writes a junction characterization report of (ISO 10848-1:2006):
the standard-basis line, an optional metadata header, the per-band
table beside the curve and a boxed single-number mean over
the Annex A band range, with the count of averaged and bracketed bands. Bands
bracketed for poor modal overlap (, ISO 10848-4:2010 Clause 9) print
their value in brackets and are excluded from the mean; verbose=True adds a
column stating whether each band enters the mean.
FlankingLevelDifferenceResult.report() and FlankingImpactLevelResult.report()
write measurement reports of the overall descriptors (airborne)
and (impact, tapping machine), reusing the same two-panel insulation
layout: the per-band quantity beside the measured-versus-shifted-ISO 717-reference
curve and the boxed single number Dn,f,w (C; Ctr) (ISO 717-1) or Ln,f,w (CI)
(ISO 717-2). verbose=True annexes the ISO 717 evaluation per band (the value,
the shifted reference and the unfavourable deviation). A requirement supplied
on the ReportMetadata adds a verdict ( passes at or above it,
at or below it), and language="es" renders every fiche in Spanish.
reportlab is required (pip install phonometry[report]).
import numpy as npfrom phonometry import building, ReportMetadata
freqs = [100, 125, 160, 200, 250, 315, 400, 500, 630,         800, 1000, 1250, 1600, 2000, 2500, 3150, 4000, 5000]dv = np.array([4.5, 4.8, 5.2, 5.6, 6.0, 6.5, 7.0, 7.6, 8.1, 8.7,               9.2, 9.8, 10.3, 10.9, 11.4, 11.9, 12.3, 12.7])m = np.full(18, 1.0); m[:3] = 0.1                        # bracket the low bandskij = building.vibration_reduction_index(    dv, junction_length=4.0, area_i=12.0, area_j=10.0, frequency=freqs,    structural_reverberation_time_i=0.35, structural_reverberation_time_j=0.40,    modal_overlap=m,)kij.report("Kij.pdf", metadata=ReportMetadata(specimen="Rigid T-junction"))
l1 = np.full(16, 80.0)dnf = np.array([48, 49, 50, 51, 52, 54, 55, 57, 58, 59, 60, 61, 62, 63, 64, 65],               dtype=float)dres = building.normalized_flanking_level_difference(    l1, l1 - dnf, absorption_area=np.full(16, 10.0))dres.report("Dnf.pdf", metadata=ReportMetadata(requirement=55.0))   # Dn,f,w (C; Ctr)
recv = np.array([58, 57, 56, 55, 54, 52, 50, 48, 46, 44, 42, 40, 38, 36, 34, 32],                dtype=float)lres = building.normalized_flanking_impact_level(recv, absorption_area=np.full(16, 10.0))lres.report("Lnf.pdf", metadata=ReportMetadata(requirement=55.0))   # Ln,f,w (CI)
The example fiches are regenerated with make reports and kept in the
repository. Click a preview to open the PDF:
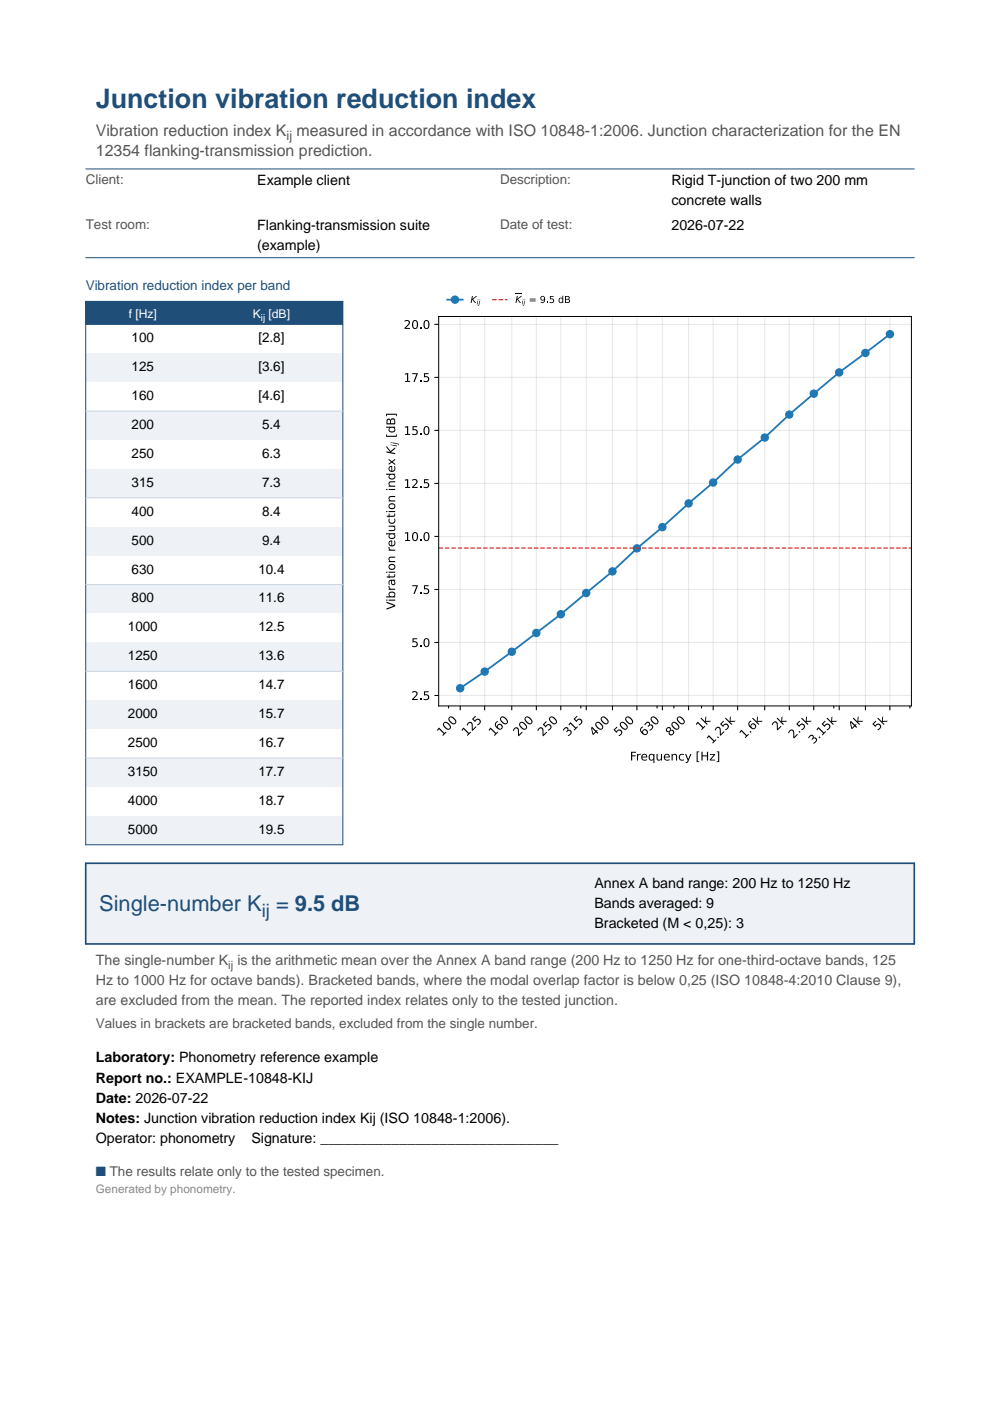
One-page junction-characterization report of the vibration reduction index Kij: the metadata header, the per-band Kij table beside the Kij(f) curve, and the boxed single-number mean Kij over the Annex A band range with the count of averaged and bracketed bands (the three lowest bands bracketed for poor modal overlap).
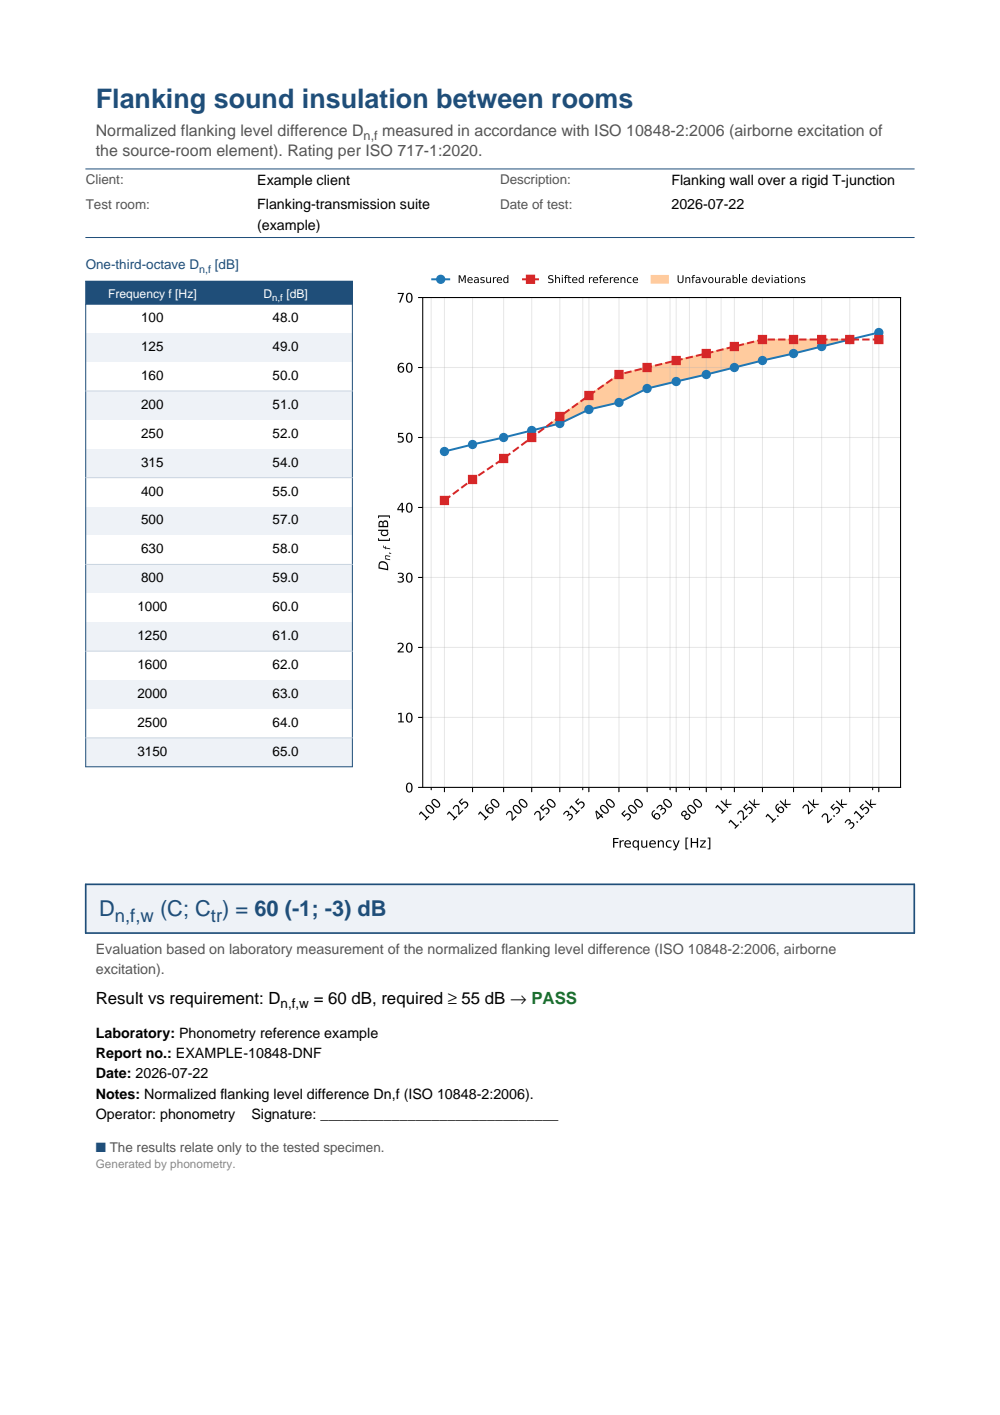
One-page airborne flanking-transmission report of the normalized flanking level difference Dn,f: the metadata header, the one-third-octave Dn,f table beside the measured-versus-shifted-reference curve, the boxed Dn,f,w (C; Ctr) rated per ISO 717-1 and a PASS verdict against the 55 dB requirement.
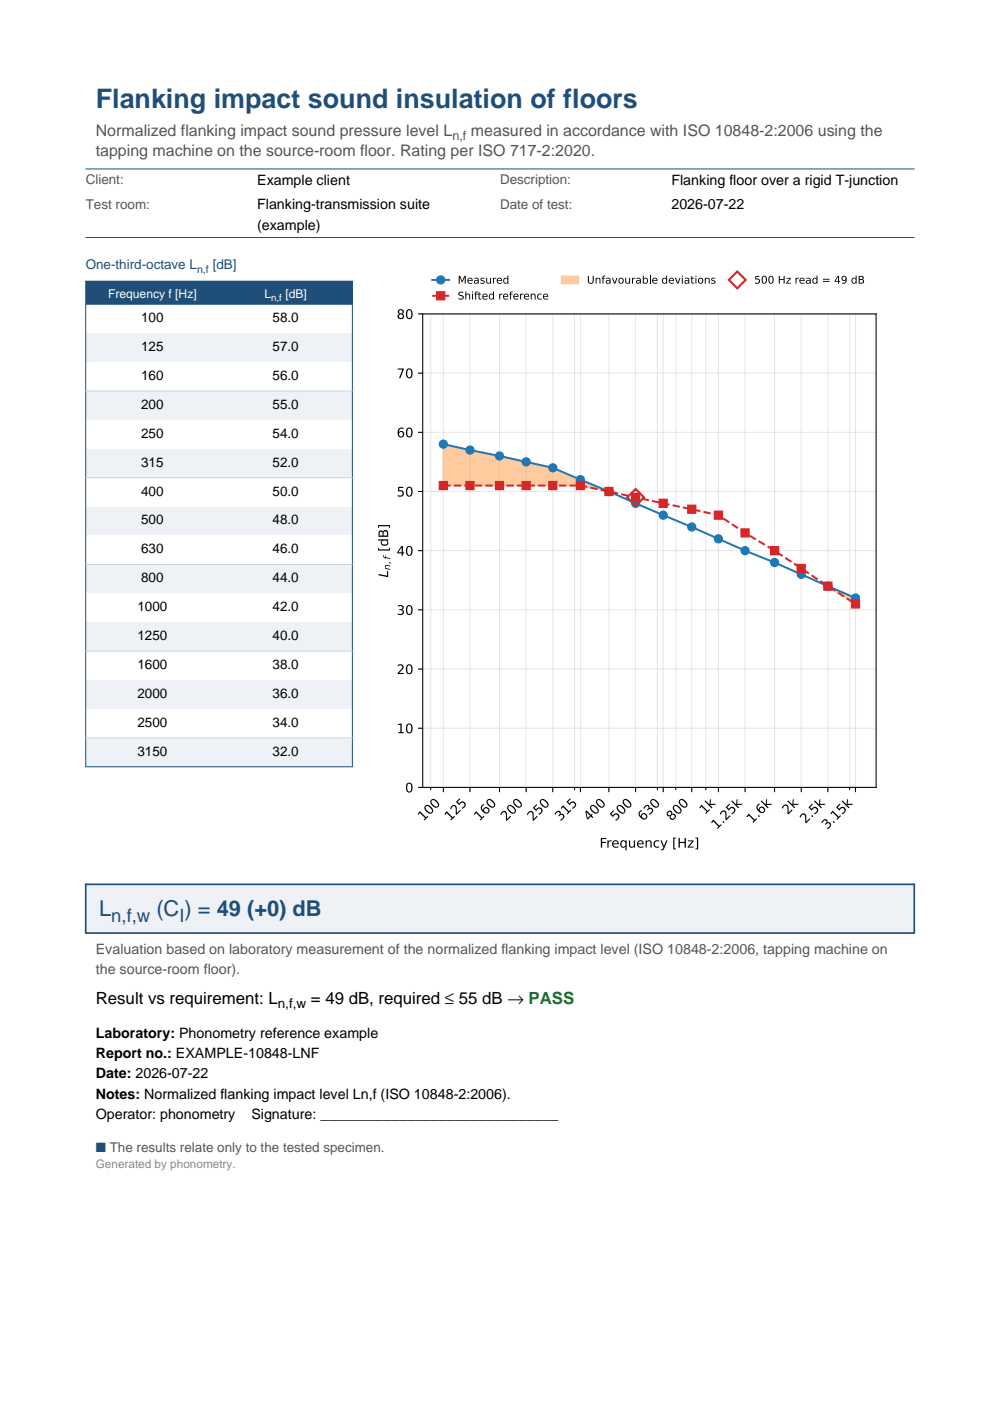
One-page impact flanking-transmission report of the normalized flanking impact level Ln,f: the metadata header, the one-third-octave Ln,f table beside the measured-versus-shifted-reference curve, the boxed Ln,f,w (CI) rated per ISO 717-2 and a PASS verdict against the 55 dB requirement.
What this guide covers
Section titled “What this guide covers”Covered. ISO 10140-2:2010 (the laboratory sound reduction index
with the Clause 4.3 background-noise correction) and ISO 10140-3:2010 (the
laboratory normalized impact level ), via
building.lab_airborne_insulation, building.lab_impact_insulation and
building.background_correction; ISO 15186-1:2000’s intensity sound
reduction index (Clause 3.8), its -modified (Annex B)
and the element-normalized (Clause 3.9), via
building.intensity_sound_reduction, building.adaptation_term_kc and
building.intensity_element_normalized_difference; ISO 16251-1:2014’s
floor-covering impact improvement and its weighted
against the ISO 717-2 Table 4 reference floor, via
building.impact_improvement and building.weighted_impact_improvement;
and ISO 10848-1:2006 (the frame document’s vibration reduction index
, Formula (13), the equivalent absorption length and the Part 4
modal-density/modal-overlap validity checks of Clause 9), with the overall
/ descriptors, via building.vibration_reduction_index,
building.normalized_flanking_level_difference and
building.normalized_flanking_impact_level.
Not covered. ISO 10140-1’s general test-facility and mounting-type
requirements are not implemented; the guide only cites them as a label
string in report metadata ("Type A mounting, mortar-bedded perimeter (ISO 10140-1)"). The sound-intensity measurement itself (the scanning
probe, the two-microphone acquisition and phase-mismatch calibration
behind and ) is not implemented: both levels are taken as
already-measured inputs, and the ISO 15186-1 report fiche states
explicitly that it has no field for the measurement-surface geometry or
the scanning-versus-discrete-point acquisition method. ISO 10848 Parts 2,
3 and 4 differ in which junction and specimen types they apply to;
phonometry implements only the Part 1 //
formulae generically, plus the Part 4 modal-overlap validity check, not
the facility-specific test setups the other parts describe.
See also
Section titled “See also”- Field Insulation Measurement and Ratings: the in-building airborne, impact and façade measurements, their single-number ratings and their uncertainty.
- Predicting Sound Insulation (EN 12354): the flanking model that consumes the laboratory , and .
- Sound Power: the
LWmethods that share the absorption-area machinery of the receiving room. - API reference:
building.lab_insulation,building.intensity_insulationandbuilding.flanking_transmission.
References
Section titled “References”- Foret, R., Chéné, J.-B., & Guigou-Carter, C. (2011). A comparison of the reduction of transmitted impact noise by floor coverings measured using ISO 140-8 and ISO/CD 16251-1. Forum Acusticum 2011, Aalborg (CSTB). The measured textile-carpet improvement spectrum used as the ISO 16251-1 worked example on this page (ΔL_w = 29 dB); the per-band ΔL was digitized from its Figure 4.
- Hopkins, C. (2007). Sound insulation. Butterworth-Heinemann. https://doi.org/10.4324/9780080550473The reference monograph for laboratory sound-insulation measurement, flanking transmission and the vibration reduction index. ISBN 978-0-7506-6526-1.
- International Organization for Standardization. (2000). Acoustics — Measurement of sound insulation in buildings and of building elements using sound intensity — Part 1: Laboratory measurements (ISO 15186-1:2000). The sound-intensity sound reduction index R_I, its Kc-modified form and the element normalized level difference (laboratory); the tool of choice when flanking is high (Clause 1).
- International Organization for Standardization. (2003). Acoustics — Measurement of sound insulation in buildings and of building elements using sound intensity — Part 2: Field measurements (ISO 15186-2:2003). The field counterpart of the intensity method, giving the apparent index R'_I.
- International Organization for Standardization. (2006). Acoustics — Laboratory measurement of the flanking transmission of airborne and impact sound between adjoining rooms — Part 1: Frame document (ISO 10848-1:2006). The frame document of the flanking-transmission measurement: definitions, the vibration reduction index Kij, the equivalent absorption length and the normalized flanking descriptors D_n,f / L_n,f that feed the EN 12354 prediction. Because ISO 10848 contains no worked numeric example, conformance is anchored on closed-form identities.
- International Organization for Standardization. (2006). Acoustics — Laboratory measurement of the flanking transmission of airborne and impact sound between adjoining rooms — Part 2: Application to light elements when the junction has a small influence (ISO 10848-2:2006). Application to light elements whose junction has a small influence.
- International Organization for Standardization. (2006). Acoustics — Laboratory measurement of the flanking transmission of airborne and impact sound between adjoining rooms — Part 3: Application to light elements when the junction has a substantial influence (ISO 10848-3:2006). Application to light elements whose junction has a substantial influence.
- International Organization for Standardization. (2010). Acoustics — Laboratory measurement of sound insulation of building elements — Part 2: Measurement of airborne sound insulation (ISO 10140-2:2010). The laboratory sound reduction index R with the background-noise correction (Clause 4.3).
- International Organization for Standardization. (2010). Acoustics — Laboratory measurement of sound insulation of building elements — Part 3: Measurement of impact sound insulation (ISO 10140-3:2010). The laboratory normalized impact level Ln.
- International Organization for Standardization. (2010). Acoustics — Laboratory measurement of sound insulation of building elements — Part 4: Measurement procedures and requirements (ISO 10140-4:2010). The measurement procedures and the background-noise correction shared by the airborne R and impact Ln.
- International Organization for Standardization. (2010). Acoustics — Laboratory measurement of the flanking transmission of airborne and impact sound between adjoining rooms — Part 4: Application to junctions with at least one heavy element (ISO 10848-4:2010). Application to junctions with at least one heavy element, with the modal-density, band-mode-count and modal-overlap validity checks (M < 0.25 bands bracketed, Clause 9).
- International Organization for Standardization. (2014). Acoustics — Laboratory measurement of the reduction of transmitted impact noise by floor coverings on a small floor mock-up — Part 1: Heavyweight compact floor (ISO 16251-1:2014). The small-mock-up laboratory method for the impact-sound improvement ΔL of soft, locally-reacting floor coverings, with ΔL_w via the ISO 717-2 reference floor and the CI,delta adaptation term.
- International Organization for Standardization. (2020). Acoustics — Rating of sound insulation in buildings and of building elements — Part 2: Impact sound insulation (ISO 717-2:2020). The impact single-number rating engine reused here and the reference floor L_n,r,0 (Table 4) behind ΔL_w, with the Formula (A.4) spectrum adaptation term CI,delta.
- Vigran, T. E. (2008). Building acoustics. CRC Press. https://doi.org/10.1201/9781482266016The transmission theory of single and double constructions that laboratory indices quantify. ISBN 978-0-415-42853-8.