Multiple-shock whole-body vibration (ISO 2631-5)
Standards: ISO 2631Key references: Griffin 1996
Vibration that contains repeated mechanical shocks (off-road vehicles, high-speed marine craft, earth-moving machinery) loads the lumbar spine far more than its equivalent r.m.s. level suggests. ISO 2631-5:2018 predicts the resulting spinal response and the risk of lumbar injury from the measured vertical seat acceleration. phonometry implements the normative Clause 5 spinal-response model and the Annex C health-effect assessment. (The Annex A / Annex E finite-element model is distributed by ISO as separate software and is out of scope here.)
The boundary with the basic method is explicit. ISO 2631-1 declares its r.m.s. evaluation normally sufficient up to a crest factor of 9, and offers the running r.m.s./MTVV and the VDV beyond it; ISO 2631-5 is the additional method for the regime past those, where the record contains repeated shocks. Its clause 4 then splits that regime in two: severe conditions with possible free fall or loss of contact with the seat and a dominant z-axis (military off-road vehicles, high-speed marine craft) use the clause 5 model implemented here, while less severe conditions in which the occupant stays seated throughout (tractors, forestry and earth-moving machinery on rough ground) belong to the Annex A finite-element model. In case of doubt the delineation is quantitative: when the band-limited vertical peak acceleration exceeds 9.81 m/s² (1 g, the free-fall threshold), clause 5 and Annex C apply.
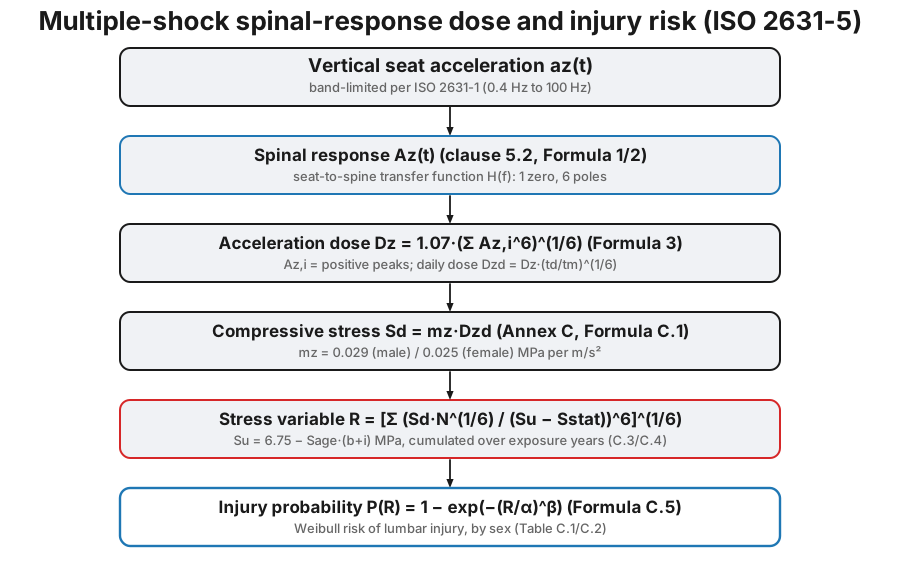
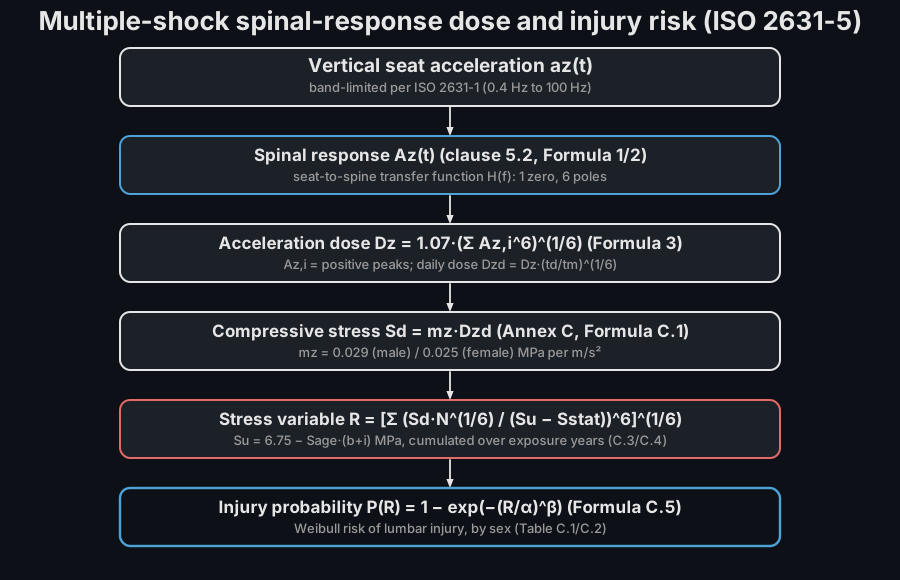
1. Spinal response (clause 5.2)
Section titled “1. Spinal response (clause 5.2)”A seat-to-spine transfer function H(f) (one complex zero and six complex
poles, unity transmissibility at 0 Hz and a resonance near 5 Hz) maps the
measured seat acceleration to the vertical spinal response Az(t)
(Formula 1/2):
The input record must be conditioned (DC-removed): because H is unity at
0 Hz by design, a DC offset (e.g. the 1 g gravity component of a DC-coupled
accelerometer) passes straight into Az(t) and corrupts the positive response
peaks of the dose. Subtract the mean (or high-pass) before processing.
from phonometry import vibration
# The transmissibility peaks near the ~5 Hz spinal resonance.print(round(abs(vibration.seat_to_spine_transfer([2.0])[0]), 2))  # 1.06print(round(abs(vibration.seat_to_spine_transfer([5.0])[0]), 2))  # 1.54
2. Acceleration dose (clause 5.3)
Section titled “2. Acceleration dose (clause 5.3)”The acceleration dose combines the positive response peaks Az,i (each the
maximum between two consecutive zero crossings) with a sixth-power law, so the
largest shocks dominate (Formula 3):
A daily dose scales the measured dose to the daily exposure time td over the
measurement time tm (Formula 4): Dzd = Dz * (td/tm)**(1/6).
from phonometry import vibration
# Five 40 m/s2 response peaks in a day (the Annex C worked example).print(round(vibration.dose_from_peaks([40.0] * 5), 2))  # 55.97  m/s2
3. Injury risk (Annex C)
Section titled “3. Injury risk (Annex C)”The daily dose becomes a daily compressive stress Sd = mz * Dzd
(Formula C.1), where mz (0.029 MPa per m/s² for an 82 kg male, 0.025 for a
64 kg female) converts acceleration to vertebral stress. The stress accumulates
over the exposure years against the ageing spine’s reducing ultimate strength
Su = 6.75 - Sage*(b+i) (Formulae C.3/C.4):
and a Weibull model gives the probability of lumbar injury (Formula C.5):
from phonometry import vibration
# Annex C worked example: 5 x 40 m/s2/day, 82 kg male, age 20 for 20 years,# 120 days/year.dz = vibration.dose_from_peaks([40.0] * 5)sd = vibration.compression_dose(dz)                     # 1.62 MPar = vibration.injury_risk(sd, start_age=20, years=20, days_per_year=120)print(round(r, 2))                               # 1.22print(round(100 * vibration.injury_probability(r)))     # 37  % risk of injury
From a measured time history the whole chain is one call:
import numpy as npfrom phonometry import vibration
# A synthetic 10 s seat record at 256 Hz with five 60 m/s2 shocks (stand-in# for a measured az(t)).fs = 256.0az = np.zeros(2560)az[256::512] = 60.0result = vibration.multiple_shock_assessment(    az, fs, start_age=20, years=20, days_per_year=120, sex="male",)print(round(result.acceleration_dose, 2))  # 20.94  m/s2print(round(result.risk, 2))               # 0.46print(round(result.probability, 2))        # 0.03
result.plot()   # the injury-probability curve with this assessment's R marked (needs matplotlib)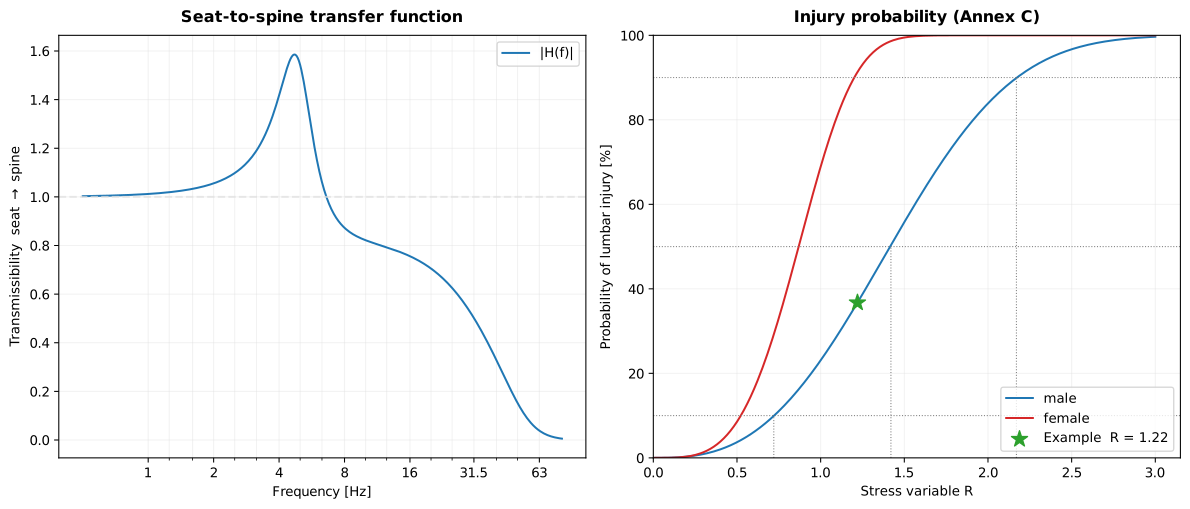
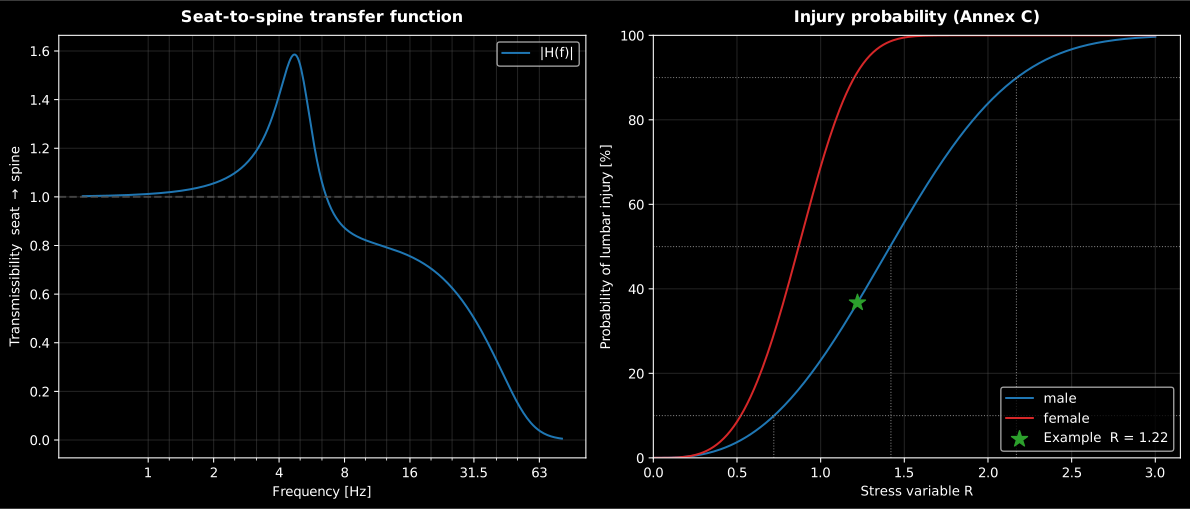
Show the code for this figure
import numpy as npimport matplotlib.pyplot as pltfrom phonometry import vibration
# Left: the seat-to-spine transfer function magnitude.f = np.logspace(np.log10(0.5), np.log10(80.0), 400)plt.plot(f, np.abs(vibration.seat_to_spine_transfer(f)))plt.xscale("log"); plt.show()
# Right: the injury-probability curve with this assessment's R marked# (az/fs as in the snippet above).fs = 256.0az = np.zeros(2560)az[256::512] = 60.0vibration.multiple_shock_assessment(    az, fs, start_age=20, years=20, days_per_year=120,).plot()plt.show()
The MultipleShockResult carries the dose Dz, the daily dose Dzd, the
compressive stress Sd, the stress variable R, the injury probability and the
response peaks, and its .plot() draws the injury-probability curve with the
10/50/90 % risk thresholds of Table C.2. The model is vertical-axis only:
clause 4 neglects the horizontal contributions to spinal compression by design,
and the horizontal spinal model of the withdrawn 2004 edition is not reinstated,
so horizontal whole-body exposure is assessed instead with the r.m.s.,
running-r.m.s./MTVV and VDV metrics of
Human Vibration (ISO 2631-1).
4. The health-risk report
Section titled “4. The health-risk report”The dose chain exists to be written down and read against the Annex C guidance.
MultipleShockResult.report() writes a one-page PDF health-risk assessment
sheet: the standard-basis line (Clause 5 spinal response and the Annex C risk
model), an optional metadata header (client, subject, workplace/vehicle,
instrumentation, calibration), the exposure-scenario grid (subject sex, the age
at which the exposure started, the number of exposure years , the number
of exposure days per year and the number of counted response shocks), and
the dose-and-stress analysis table with the acceleration dose (Formula 3),
the daily dose (Formula 4), the daily compressive stress
(Formula C.1), the cumulative stress variable (Formula C.3) and the
probability of lumbar injury (Formula C.5).
Because ISO 2631-5:2018 defines no exposure limit, the fiche carries a
risk-band zone row rather than a PASS/FAIL verdict: the boxed and
name the Annex C risk classification, and a classification table places
among the Table C.2 stress variables for / / % risk of injury
(low / moderate / high / very high probability of an adverse health effect),
with the injury-probability chart above it. language="es" renders the Spanish
fiche (comma decimals).
The metadata argument accepts a ReportMetadata whose relevant fields for a
multiple-shock report are client, specimen (the subject), test_room (the
workplace or vehicle), test_date, instrumentation, calibration, and the
footer identity laboratory, operator, report_id and notes.
import numpy as npfrom phonometry import vibration, ReportMetadata
# The Annex C worked example: five 40 m/s2 spinal-response shocks per day,# 82 kg male, exposed from age 20 for 20 years at 120 days/year. The record is# rebuilt from those response peaks (the standard states the example in terms# of the peaks), so the fiche prints the published Annex C values.peaks = np.array([40.0] * 5)dz = vibration.dose_from_peaks(peaks)sd = vibration.compression_dose(dz)r = vibration.injury_risk(sd, start_age=20, years=20, days_per_year=120)result = vibration.MultipleShockResult(    sex="male",    acceleration_dose=dz,    daily_dose=dz,    compression_dose=sd,    risk=r,    probability=float(vibration.injury_probability(r)),    start_age=20.0,    years=20,    days_per_year=120.0,    peaks=peaks,    risk_thresholds=vibration.RISK_THRESHOLDS_MALE,)
result.report(    "multiple_shock.pdf",    metadata=ReportMetadata(        client="Example transport operator",        specimen="82 kg male operator (seated)",        test_room="Off-road vehicle, driver's seat",        report_id="EXAMPLE-2631-5",    ),)   # R = 1.22, Pi = 37 % -> moderate probability of an adverse health effect
The example fiche is regenerated with make reports and kept rendered in the
repository; click the preview to open the PDF.
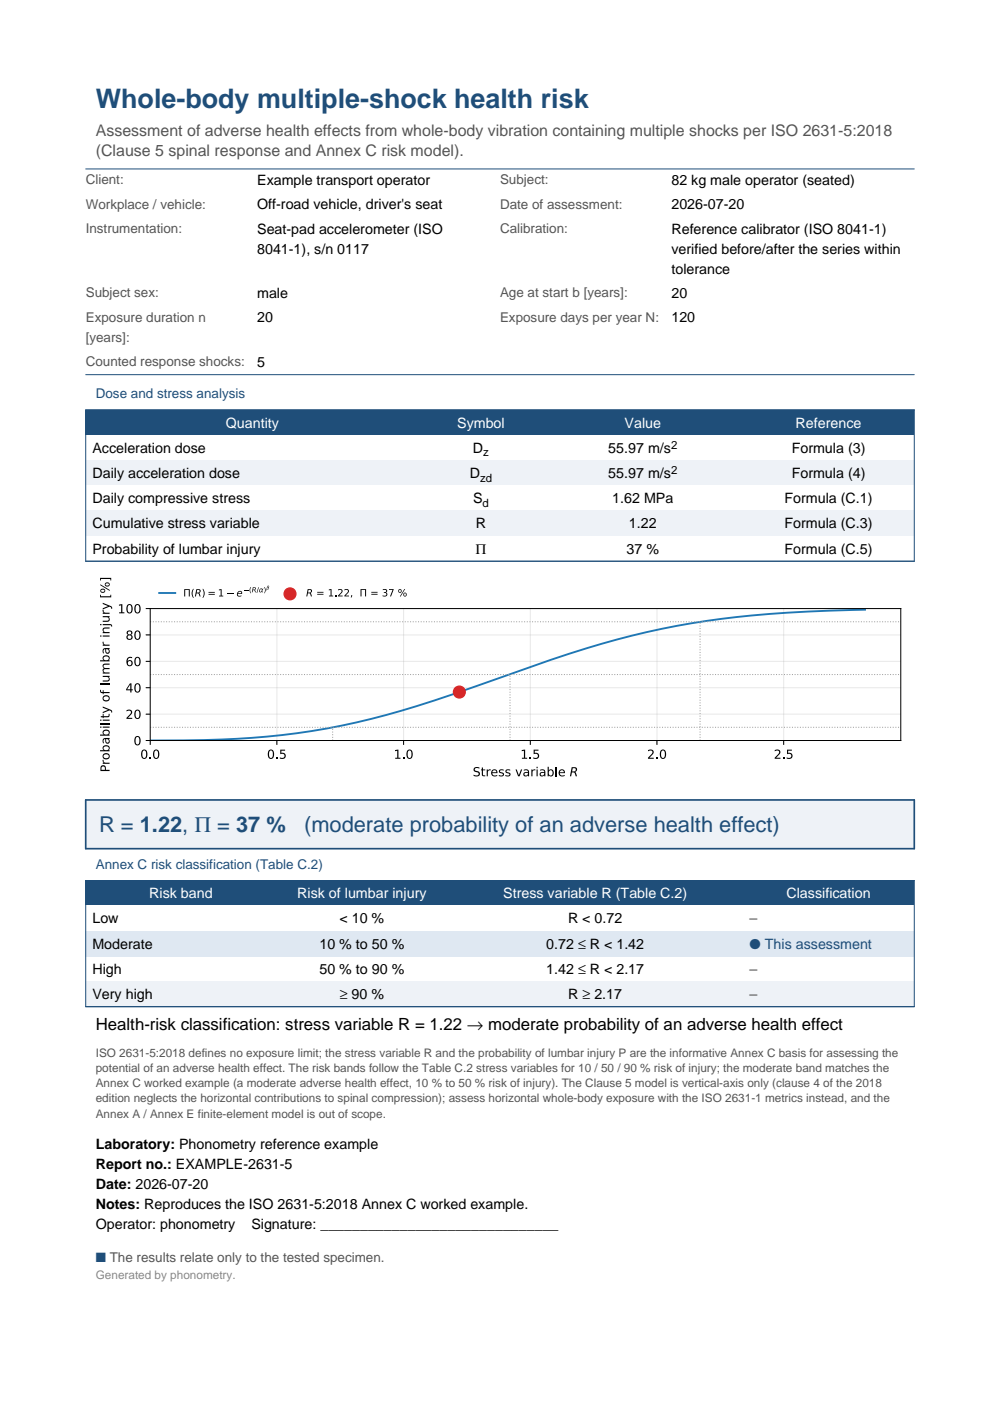
One-page whole-body multiple-shock health-risk assessment fiche: a header with the transport operator, the subject and the off-road vehicle, the exposure-scenario grid (82 kg male, age 20, 20 years, 120 days per year, five counted shocks), the dose-and-stress analysis table with the acceleration dose Dz = 55.97 m/s2, the daily compressive stress Sd = 1.62 MPa, the cumulative stress variable R = 1.22 and the probability of lumbar injury 37 percent, the injury-probability curve with the Table C.2 risk levels and this assessment marked, the boxed R = 1.22 and 37 percent classed as a moderate probability of an adverse health effect, and the Annex C classification table where the moderate band (10 to 50 percent risk of injury) is the assessment's band.
See also
Section titled “See also”- API reference:
vibration.multiple_shock_vibration.
References
Section titled “References”- Griffin, M. J. (1996). Handbook of human vibration. Academic Press. ISBN 978-0-12-303041-2. Background on whole-body shock exposure, spinal biodynamics and the lumbar health effects that the ISO 2631-5 dose model quantifies.
- International Organization for Standardization. (2018). Mechanical vibration and shock — Evaluation of human exposure to whole-body vibration — Part 5: Method for evaluation of vibration containing multiple shocks (ISO 2631-5:2018). The seat-to-spine transfer function (clause 5.2, Formula 1), the acceleration and daily dose (clause 5.3, Formulae 3-5) and the Annex C assessment of adverse health effects (Formulae C.1, C.3-C.5, Tables C.1/C.2).