Three kinds of evidence back a number computed with this library, and they live on different pages. The verifiers are public functions that grade a filter or weighting you configured against the acceptance limits of its governing standard. The conformance report is the published table of 1447 checks that pins the shipped implementation to the standards’ own expected values, regenerated on every change. And the scope notes on each guide say where the software’s claim ends and a laboratory’s begins. This page is the map of the three: what a performance class actually asserts, which function verifies what, how to read the report, and exactly which parts of the IEC 61672 and IEC 61260 series a library can and cannot claim.
1. What a performance class asserts
Section titled “1. What a performance class asserts”IEC 61672-1:2013 (sound level meters) and IEC 61260-1:2014 (octave-band and fractional-octave-band filters) both specify two performance categories, class 1 and class 2, and both define them the same way: class 1 and class 2 share the same design goals and differ mainly in the acceptance limits around those goals and in the range of operational temperature; class 2 limits are greater than or equal to class 1 limits everywhere (IEC 61672-1:2013, clause 1; IEC 61260-1:2014, subclause 1.2).
So a class is not a quality grade of the reading. It is a worst-case error bound under stated conditions: a class 1 A-weighting may deviate from the design-goal response at 1 kHz by at most ±0.7 dB, a class 2 one by ±1.0 dB, and every band of a class 1 one-third-octave filter reads a mid-band tone within ±0.4 dB of its true level. The bound is what chains: a class 1 measurement needs every stage to hold class 1, from the calibrator through the weighting to the band filter, because each stage’s tolerance enters the level it hands on. One class 2 stage bounds the chain at class 2, whatever the rest attests.
Two edges of the vocabulary are worth pinning down before verifying anything:
- Class 0 is not a 2014 class. The strictest filter class belongs to the
withdrawn IEC 61260:1995 / ANSI S1.11-2004 masks; IEC 61260-1:2014 defines
classes 1 and 2 only. The verifiers keep the old mask alive behind
edition="1995", and Filter Class Verification covers when a class 0 claim is honest and how to cite it. - A class belongs to a specification, not to a number. “Class 1” written alone says nothing; the claim is “class 1 per IEC 61672-1:2013 Table 3” or “class 1 per IEC 61260-1:2014 Table 1”, and the two masks are different objects checked by different functions, which is the next section.
2. The verifiers: which function proves what
Section titled “2. The verifiers: which function proves what”The library exposes one verifier per instrument stage. Each checks a design
you configured, band by band or frequency by frequency, against the
acceptance limits transcribed from the governing standard, and each returns
the same verdict vocabulary: an overall_class (the strictest class met, or
None), per-band margins in decibels to the nearest limit, and a
range_limited flag when part of the standard’s frequency range could not be
demonstrated at your sample rate.
| Stage | Verifier | Acceptance limits | Deep dive |
|---|---|---|---|
| Frequency weighting (A, C, Z) | verify_weighting_class | IEC 61672-1:2013 Table 3 | Frequency Weighting, section 6 |
| Weightings B and AU | verify_weighting_class | ANSI S1.4-1983 Tables IV/V; IEC 61012:1990 Table 1 | Special Weightings |
| Fractional-octave filter bank | verify_filter_class; verify_time_invariance | IEC 61260-1:2014 Table 1, 5.12 and 5.16 as IEC 61260-2 computes them (1995 mask via edition="1995"); 5.14 by an exponential sweep | Filter Class Verification |
| Intensity instrument spectrum | verify_intensity_class | IEC 61043:1993 Table 2 | Sound Intensity |
The masks themselves are public too: weighting_class_limits(1) returns the
34 nominal frequencies of Table 3 with the class 1 deviation limits, and
class_limits(fraction, filter_class, omega) returns the Table 1
relative-attenuation corridor, so a report can draw the same limits the
verdict was judged against.
Verifying a whole measurement chain is two calls. The configuration below is the one the conformance suite itself pins, a 48 kHz chain with the default order-6 Butterworth bank over 100 Hz to 10 kHz:
from phonometry import filters
wf = filters.WeightingFilter(48000, "A")weighting = filters.verify_weighting_class(wf)print(weighting.overall_class)       # 1print(weighting.range_limited)       # False
bank = filters.OctaveFilterBank(fs=48000, fraction=3, order=6,                                limits=[100, 10000])bands = filters.verify_filter_class(bank)print(bands.overall_class)           # 1print(bands.range_limited)           # True: its top bands reach Nyquist
Read the flags, not just the class. range_limited on the bank is True
because its bands from 5 kHz up, filtered at the full rate, cannot be
evaluated beyond the 24 kHz Nyquist frequency, which falls short of the end of
their Table 1 mask, so their far stopband rests on the anti-alias filter of
the capture chain rather than on the band filter itself; the weighting at
48 kHz checks all 34 nominal frequencies and reports False. The margins say how close the verdict came:
worst = min(bands.bands, key=lambda b: b["margin_class1_db"])print(round(worst["margin_class1_db"], 3)) # 0.4print(weighting.bands[20])# {'freq': 1000.0, 'class': 1, 'deviation_db': 0.0, 'margin_class1_db': 0.7, 'margin_class2_db': 1.0}The class of a bank is the strictest class it meets on every requirement
graded, and bands.requirements lists them: here the Table 1 mask, the
effective bandwidth and the summation of adjacent outputs, all class 1. A bank
can still part company with its Table 1 verdict: at 48 kHz an order-4
one-third-octave bank is class 1 on Table 1 and misses class 1 on the
summation by 0.002 dB, at its 16 kHz band, and
Filter Class Verification
shows how the summation is graded. A margin of +0.400 dB on a passing Butterworth bank is the passband
half-corridor itself, the best a compliant design can report, not a result to
improve; Filter Class Verification
explains which constraint binds and why raising the order stops helping the
moment the verdict turns positive.
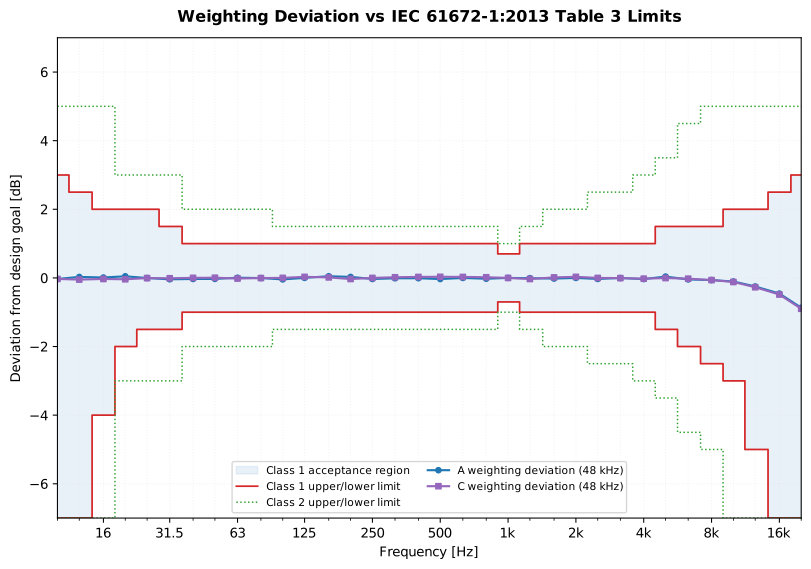
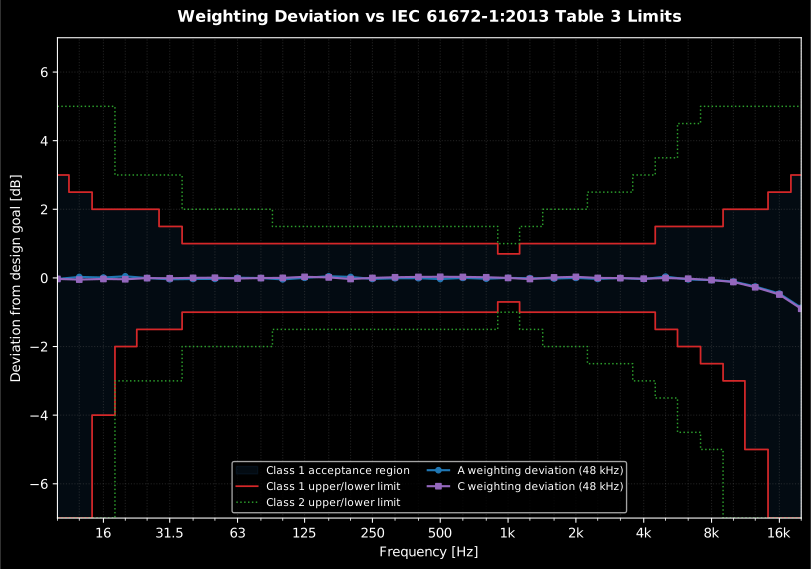
What a verifier actually checks, drawn for the weightings: the deviation of the designed response from the design goal (markers) must stay inside the class 1 corridor (shaded) at every nominal frequency. The filter-bank equivalent, a relative-attenuation corridor around each mid-band frequency, is drawn in Filter Class Verification.
Show the code for this figure
import matplotlib.pyplot as pltimport numpy as np
freqs, lower1, upper1 = filters.weighting_class_limits(1)_, lower2, upper2 = filters.weighting_class_limits(2)lo1, lo2 = np.clip(lower1, -7, 7), np.clip(lower2, -7, 7)
fig, ax = plt.subplots(figsize=(10, 6.5))ax.fill_between(freqs, lo1, upper1, step="mid", alpha=0.10,                label="Class 1 acceptance region")ax.plot(freqs, upper1, drawstyle="steps-mid", label="Class 1 upper/lower limit")ax.plot(freqs, lo1, drawstyle="steps-mid", color="C1")ax.plot(freqs, upper2, ":", drawstyle="steps-mid", label="Class 2 upper/lower limit")ax.plot(freqs, lo2, ":", drawstyle="steps-mid", color="C2")
for curve, marker in (("A", "o"), ("C", "s")):    verdict = filters.verify_weighting_class(filters.WeightingFilter(48000, curve))    f = [b["freq"] for b in verdict.bands]    dev = [b["deviation_db"] for b in verdict.bands]    ax.plot(f, dev, marker=marker, label=f"{curve} weighting deviation (48 kHz)")
ax.set(xscale="log", xlim=(10, 20000), ylim=(-7, 7),       xlabel="Frequency [Hz]", ylabel="Deviation from design goal [dB]")ax.legend(fontsize=8, ncol=2)plt.show()
When the verdict has to leave the console, the same call answers: what
verify_filter_class returns carries .plot() (the worst-margin band drawn
on its class corridor) and .report(), the one-page accredited fiche with an
optional PASS/FAIL row against a required class:
from phonometry import ReportMetadata, filters
bank = filters.OctaveFilterBank(fs=48000, fraction=1, order=6, limits=[125, 4000])result = filters.verify_filter_class(bank)   # result.overall_class == 1result.report(    "iec61260.pdf",    metadata=ReportMetadata(        specimen="1/1-octave filter bank",        measurement_standard="IEC 61260-1:2014",        required_class=1,    ),)                                        # -> Class 1 - COMPLIES, PASS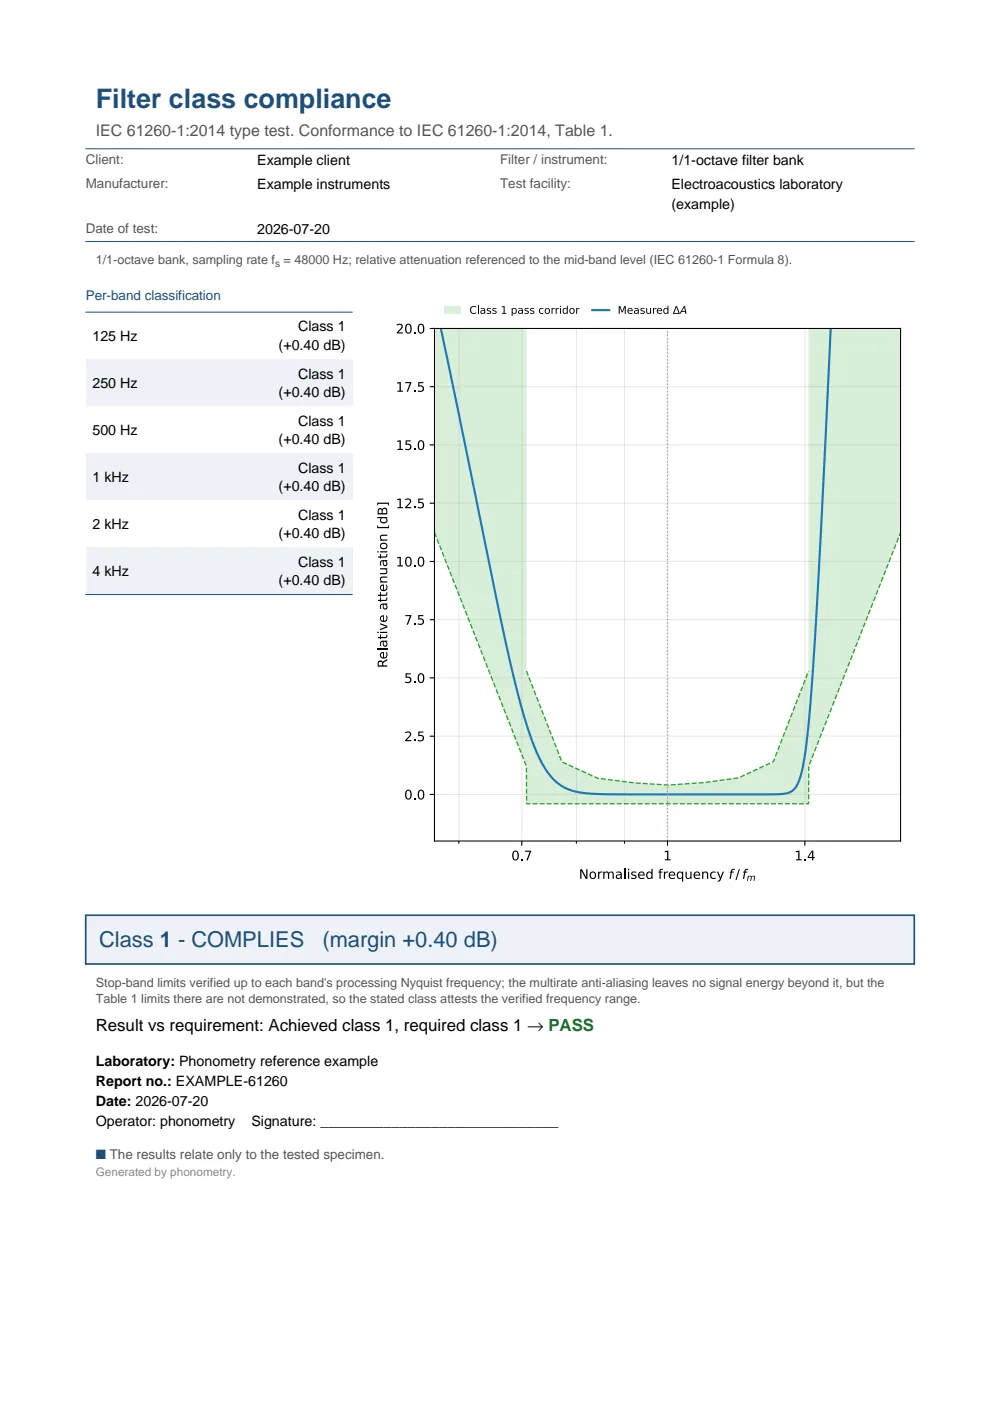
One-page filter-class-compliance fiche: a metadata header, a per-band classification table listing each octave band's achieved class and binding margin, the worst-margin band's measured relative attenuation overlaid on the green class-1 acceptance corridor with the three requirements graded beneath it, the boxed Class 1 - COMPLIES result and a PASS verdict against the required class 1.
The intensity verifier follows the same pattern one domain over:
verify_intensity_class grades a measured pressure-residual intensity index
spectrum against the IEC 61043 class limits and hands back a result with
.plot() and its own fiche, with the residual-index physics explained in
Sound Intensity.
The verifiers that grade a measurement, not a design
Section titled “The verifiers that grade a measurement, not a design”Seven more functions carry the same verify_ prefix and answer a different
question. The four above are handed a filter this library built, and report
whether that design fits an acceptance mask; these are handed numbers
somebody measured on a bench, and report whether that instrument, on the day
it was measured, meets the standard it is sold against. There are no classes
and no decibel margins in them: the verdict is a pass or a fail, in the unit
its own standard writes its tolerances in. All seven return a result object
whose verdict says so and whose other fields say where and by how much, down to
verify_running_rms_decay, which grades one printed row and keeps it.
| What is graded | Verifier | Acceptance limits | Deep dive |
|---|---|---|---|
| Aircraft-noise measurement system | verify_aircraft_noise_system | IEC 61265:1995 Table 1, and the scalar limits beside it | Aircraft Noise |
| Human-vibration frequency weighting | verify_weighting | ISO 8041-1:2017 Tables 4 and 5 | Verifying a Human-Vibration Meter |
| Human-vibration phase response | verify_phase_response | ISO 8041-1:2017 Table 5 and Formula (6) | Verifying a Human-Vibration Meter |
| Saw-tooth burst indications | verify_signal_burst_response | ISO 8041-1:2017 Tables 7 to 9 (the signal is Table 6) | Verifying a Human-Vibration Meter |
| Running r.m.s. decay time | verify_running_rms_decay | ISO 8041-1:2017 Tables 10 and 11 | Verifying a Human-Vibration Meter |
| Sound calibrator | verify_sound_calibrator | IEC 60942:2017 Tables 2 to 7 and A.1 to A.5 | Calibration and dBFS |
| Band-filter periodic test | verify_filter_periodic | IEC 61260-3:2016 clauses 10, 11 and 13 and Table 1, with the maxima of IEC 61260-1:2014 Annex B | Filter Class Verification |
One clause of ISO 8041-1 makes those four different in kind from everything
else on this page. The deviation a laboratory reports is extended by that
laboratory’s own expanded uncertainty before it is compared with the limit
(clauses 13.1 and 14.1), so the same instrument passes on one bench and fails
on another, and verify_weighting takes that uncertainty as an argument
rather than assuming it away.
The conformance rule of IEC TC 29
Section titled “The conformance rule of IEC TC 29”The IEC instrument standards written since 2013 answer the same question another way, and all of them in the same sentence. IEC 61672-1:2013 prints it in 5.1.21 and IEC 60942:2017 in 5.1.15: conformance to a performance specification is demonstrated when the measured deviation from the design goal does not exceed the acceptance limits and the laboratory’s actual expanded uncertainty does not exceed the maximum-permitted uncertainty the standard prints for that test. The uncertainty is not added to the deviation. It has a ceiling of its own, and the tolerance the instrument has to meet lies beyond the acceptance limit by that ceiling (IEC 60942 Annex D, IEC 61672-1 Annex A), so a laboratory within its maximum is unlikely to pass an instrument outside its tolerance. Unlikely, not unable: the ceiling is stated for a 95 % coverage interval, and the guard band lowers the risk of a false acceptance without removing it. Both limits are inclusive: a deviation equal to its acceptance limit conforms, and so does an uncertainty equal to its maximum.
metrology.verify_conformance is that rule on its own, for any standard that
uses it: IEC 61672-3:2013 (4.1) and IEC 61260-2 and -3:2016 write the same one,
for the pattern evaluation and the periodic tests of meters and filters. Its
verdict says which of the four outcomes of IEC 60942 E.2.2 (IEC 61672-1 C.2.2)
it is, in the words of the “Reasons” column the tables print, and it has no
truth value, so an if verify_conformance(...): raises instead of passing
everything.
from phonometry import metrology
# IEC 61672-1:2013 Table C.1: acceptance limits +1.0 dB and -1.2 dB, and a# maximum-permitted uncertainty of 0.5 dB.on_the_limit = metrology.verify_conformance(          # example 7    -1.2, uncertainty=0.3, acceptance_limits=(-1.2, 1.0), max_uncertainty=0.5)print(on_the_limit.passes, on_the_limit.outcome)      # True 1both_out = metrology.verify_conformance(              # example 10    -2.0, uncertainty=0.7, acceptance_limits=(-1.2, 1.0), max_uncertainty=0.5)print(both_out.passes, both_out.outcome)              # False 4print(both_out.reason)# Deviation exceeds acceptance limits AND uncertainty exceeds maximum-permitted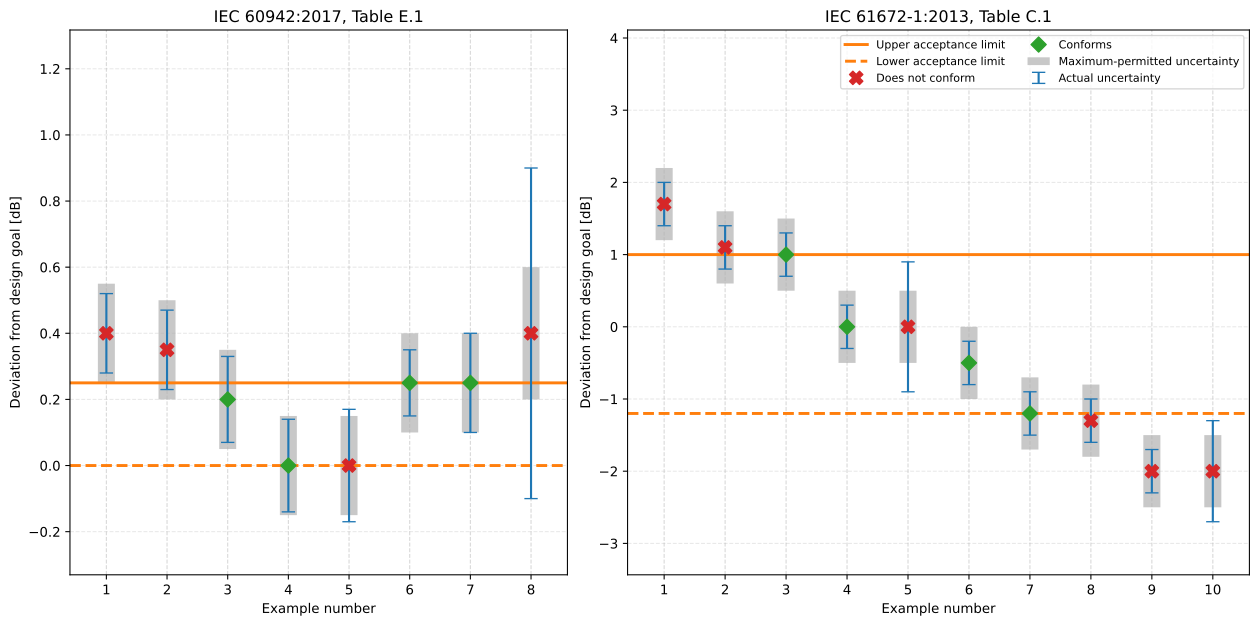
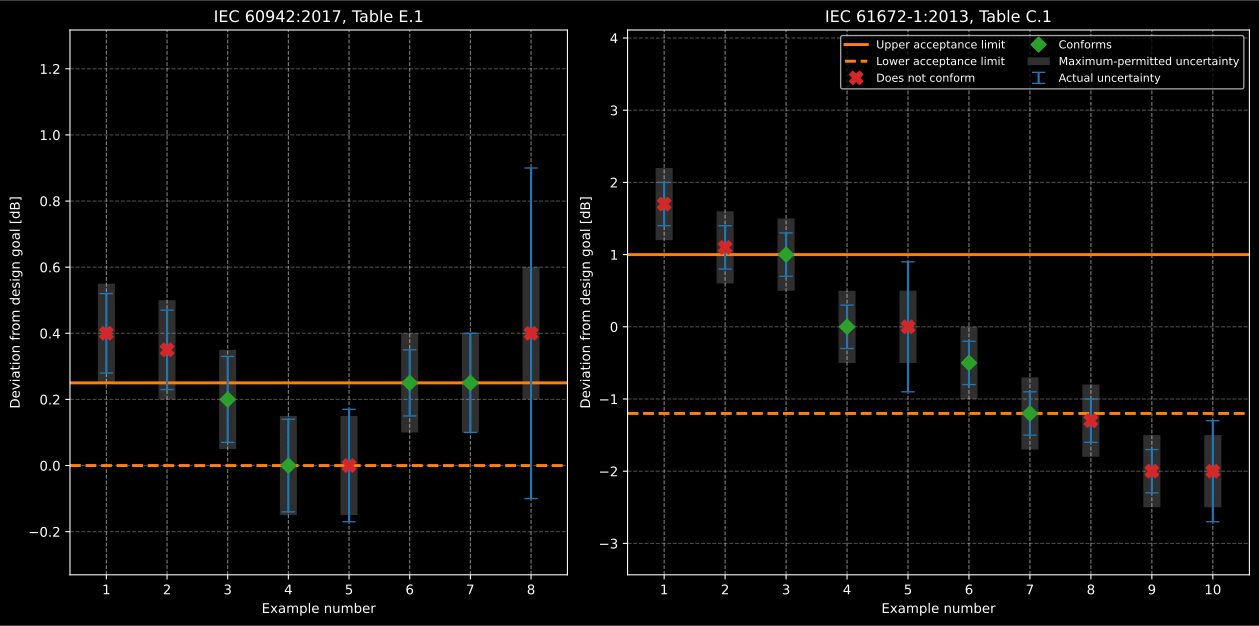
The eighteen printed examples, each marker the verdict verify_conformance
returned, which is the verdict the table prints. The shaded band is the
maximum-permitted uncertainty and the error bar the actual one; a diamond on a
limit line conforms, and a cross inside the limits (example 5 of both tables)
is a measurement whose uncertainty was too large to demonstrate anything.
Show the code for this figure
import matplotlib.pyplot as pltfrom phonometry import metrology
table_e1 = [(0.40, 0.12, 0.15), (0.35, 0.12, 0.15), (0.20, 0.13, 0.15),            (0.00, 0.14, 0.15), (0.00, 0.17, 0.15), (0.25, 0.10, 0.15),            (0.25, 0.15, 0.15), (0.40, 0.50, 0.20)]table_c1 = [(1.7, 0.3), (1.1, 0.3), (1.0, 0.3), (0.0, 0.3), (0.0, 0.9),            (-0.5, 0.3), (-1.2, 0.3), (-1.3, 0.3), (-2.0, 0.3), (-2.0, 0.7)]# Table E.1 prints the absolute deviation, so Figure E.1 draws its limits at# 0 dB and 0.25 dB.e1 = [metrology.verify_conformance(d, uncertainty=u, acceptance_limits=(0.0, 0.25),                                   max_uncertainty=m) for d, u, m in table_e1]c1 = [metrology.verify_conformance(d, uncertainty=u, acceptance_limits=(-1.2, 1.0),                                   max_uncertainty=0.5) for d, u in table_c1]

def draw(ax, results, title):    ax.axhline(results[0].upper_limit, color="tab:orange", lw=2)    ax.axhline(results[0].lower_limit, color="tab:orange", lw=2, ls="--")    for x, v in enumerate(results, start=1):        ax.bar(x, 2 * v.max_uncertainty, bottom=v.deviation - v.max_uncertainty,               width=0.28, color="0.8")        ax.errorbar(x, v.deviation, yerr=v.uncertainty, fmt="none",                    ecolor="tab:blue", capsize=5)        ax.plot(x, v.deviation, "D" if v.passes else "X", ms=9,                color="tab:green" if v.passes else "tab:red")    ax.set_title(title)    ax.set_xlabel("Example number")    ax.set_ylabel("Deviation from design goal [dB]")

fig, (ax_e, ax_c) = plt.subplots(1, 2, figsize=(13, 6))draw(ax_e, e1, "IEC 60942:2017, Table E.1")draw(ax_c, c1, "IEC 61672-1:2013, Table C.1")plt.show()
All eighteen examples, the eight of IEC 60942 Table E.1 and the ten of
IEC 61672-1 Table C.1, are rows of the
conformance report, verdict and reason
each. IEC 60942 writes its limits on the absolute deviation, so a signed
deviation takes one number (acceptance_limits=0.25 is ±0.25 dB). Table E.1
prints the absolute deviation already, and Figure E.1 draws its limits at 0 dB
and 0.25 dB, so the figure above passes acceptance_limits=(0.0, 0.25): the
eight verdicts are the same either way. IEC 61672-1 writes most of its own
limits as an asymmetric pair, and IEC 61260-1:2014 Table C.1 prints the same
ten examples, which are rows of the report too. A stop-band requirement has a
minimum and no maximum, so one end of the interval may be open:
acceptance_limits=(70.0, math.inf). verify_sound_calibrator applies the
rule to every requirement of IEC 60942:2017 with the limits the class and the
nominal frequency select, as Calibration and dBFS
shows, and verify_filter_periodic to every result of an IEC 61260-3:2016
periodic test, as
Filter Class Verification
shows.
3. Reading the conformance report
Section titled “3. Reading the conformance report”The verifiers grade your configuration. The conformance report is the complementary evidence: 1447 numerical checks across 97 domains and 477 standards, each row pinning one implemented quantity to the governing standard’s own expected value, with the computed value, the signed delta and a pass/fail verdict beside it. It is regenerated on every pull request and the build fails if it drifts from the code, so the published table always describes the library as shipped.
Three habits make it useful rather than decorative:
- Find the row before trusting the feature. Every table is
Standard | Quantity | Expected | Computed | Delta | Status, grouped by domain, and the expected value is the standard’s worked example or tolerance-table entry, not a regression baseline. The row for a metric you rely on tells you which clause of which edition the implementation was held to, which is exactly the citation a report needs. - Note the configuration of the class rows. The filters-and-weightings section walks the five filter architectures and the weighting curves through the same verifiers this page documents, in one pinned configuration: order 6, one-third-octave, 100 Hz to 10 kHz, 48 kHz. The report proves the implementation; for any other fraction, order or sample rate, section 2 is how the claim transfers to your bank.
- Cite the version that ran. The report describes the exact library version that generated it, so a defensible citation pins the version and quotes the report of that version, as About this project spells out.
Where re-deriving a standard this closely has exposed defects in the published documents themselves, the evidence lives in the errata registry, which the report links row by row where it applies.
4. What only a laboratory can attest
Section titled “4. What only a laboratory can attest”Both instrument series continue past their Part 1 with two test regimes, and
neither regime is something a software library can run on itself. The
delimitation below is verified against the four documents; the one-line
summary is that the library checks designs against Part 1 acceptance
limits, while Parts 2 and 3 check physical instruments. The two claims
are not interchangeable. What the library can do with Parts 2 and 3 is
arithmetic: the requirements of a filter set that Part 2 computes from a
response are computed on the design (Filter Class Verification, sections 1b
and 1c), and the results a Part 3 test of a filter set returns are graded by
verify_filter_periodic, which runs none of the tests.
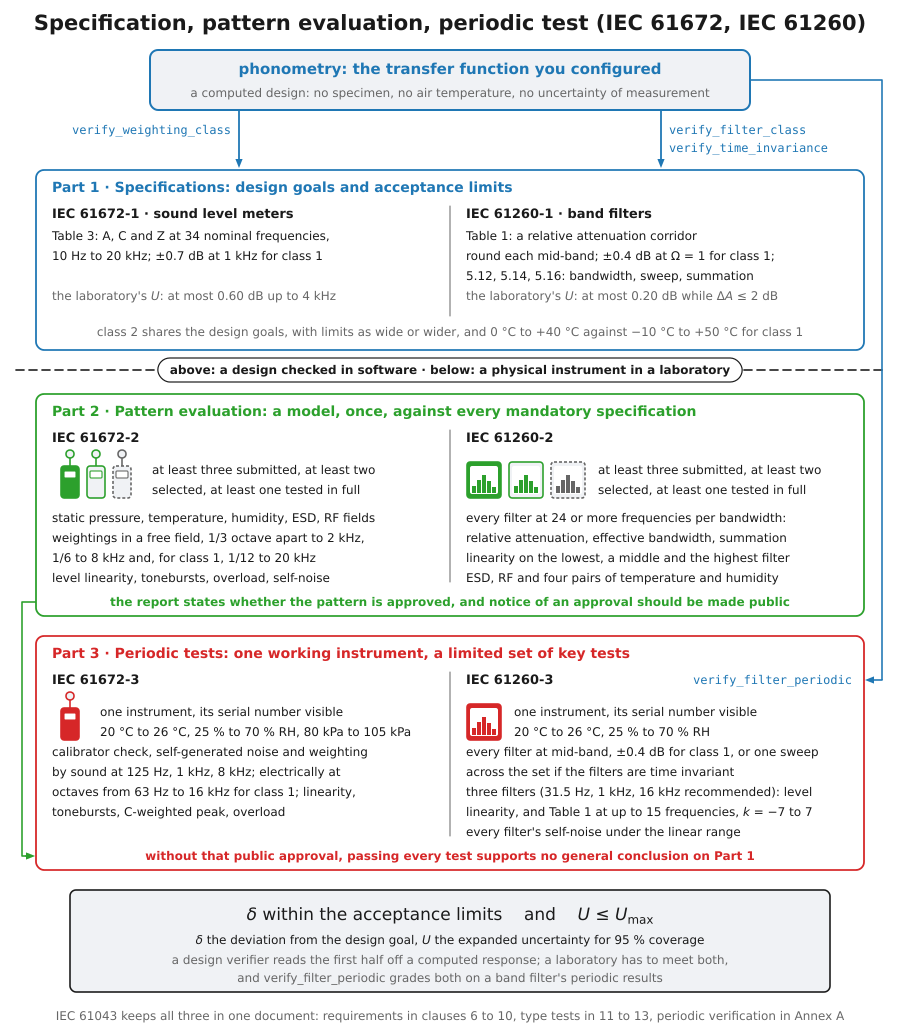
The two series side by side, their three parts stacked. The design verifiers
reach only the Part 1 requirements and only the first half of the conformance
criterion; Parts 2 and 3, under the dashed line, need a physical instrument,
whose periodic-test results verify_filter_periodic grades on both halves,
and a periodic test says nothing general until the pattern approval it leans
on is public.
Pattern evaluation (IEC 61672-2:2013 for meters, IEC 61260-2:2016 for filters) is the type-approval regime a model passes once. Its stated scope is the tests necessary to verify conformance to all mandatory specifications of the Part 1 (IEC 61672-2:2013, clause 1; IEC 61260-2:2016, subclause 1.1), on physical specimens: IEC 61260-2 requires at least three specimens of the pattern submitted for testing (subclause 4.1). That includes everything a transfer function does not have: the influence of static pressure, air temperature and relative humidity, immunity to electrostatic discharge and to power-frequency and radio-frequency fields, directional response and the acoustical tests of the frequency weightings with the microphone in the sound field, level linearity of the real electronics, self-generated noise, toneburst response, overload behaviour (IEC 61672-2:2013, clauses 7 to 9; IEC 61260-2:2016, clauses 7 to 9).
Periodic tests (IEC 61672-3:2013, IEC 61260-3:2016) are what a working instrument receives in the laboratory, typically every year or two. Their scope is deliberately the opposite of exhaustive: a limited set of key tests, valid for the environmental conditions of the day, “restricted to the minimum considered necessary” (IEC 61672-3:2013, clause 1; IEC 61260-3:2016, subclauses 1.2 and 1.3). For a filter set that means the relative attenuation at the midband frequency of every filter or the effective bandwidth deviation, the linear operating range with its level range control and overload indicator, the lower limit of that range, and a relative-attenuation test at the normalized frequencies of the standard’s own Table 1 on the three filters selected for the linearity tests (IEC 61260-3:2016, clauses 10 to 13); for a meter, the calibrator check, self-generated noise, weightings by acoustical and electrical signals, linearity, tonebursts, C-weighted peak and overload (IEC 61672-3:2013, clauses 9 to 21). Both Part 3 scopes end with the same caveat: because the extent is limited, passing every periodic test supports no general conclusion of conformance to the Part 1 unless the model’s pattern approval is on record (IEC 61672-3:2013, clause 1; IEC 61260-3:2016, subclause 1.5).
The same honesty applies to this library, in both directions:
- What a class verdict is. A statement about a design: the digital transfer function you configured fits the Part 1 acceptance mask, with the reported margins, over the checked frequency range. Every measurement made wholly in software inherits it, which is why the sound level meter walkthrough ends by running the verifiers on the chain it just built.
- What a measurement verdict is. Narrower still. The seven verifiers of the second table are handed numbers somebody read off a bench, so their verdict belongs to that instrument on the day it was measured and nothing inherits it, not even a second run of the same test.
- What it is not. A pattern evaluation, a periodic test, or a certificate
for any physical device. Nothing here has a microphone, a temperature or a
serial number; the influence-quantity, immunity and acoustical tests above
are not implemented, and no green verdict from section 2 says anything
about the hardware that recorded your samples. A real front end brings its
own paper: the meter’s periodic test per IEC 61672-3 and the calibrator’s
laboratory results per IEC 60942, which
verify_sound_calibratorgrades but cannot produce (asverify_filter_periodicgrades a filter set’s IEC 61260-3 results), both discussed with the field ritual in Calibration and dBFS. - Name both verdicts in a report. “Band levels computed with filters verified class 1 per IEC 61260-1:2014 Table 1 (library version X, see its conformance report); acquisition chain periodically tested per IEC 61672-3:2013 on date Y” is a claim a reviewer can check end to end. Either half alone quietly borrows the other’s authority.
What this guide covers
Section titled “What this guide covers”Covered
What a performance class asserts in IEC 61672-1:2013 and IEC 61260-1:2014 and how the claim chains through a measurement; the public verifiers (
verify_weighting_class,verify_filter_class,verify_intensity_class, withweighting_class_limitsandclass_limitspublishing the masks, and the last two returning a result that carries.plot()and the accredited fiche, andverify_time_invariancefor the swept test of a filter bank); the seven verifiers that grade a measured instrument rather than a design, and where each one’s page is; the conformance rule of IEC TC 29 (verify_conformance, reproducing every example of IEC 60942:2017 Table E.1 and IEC 61672-1:2013 Table C.1); how to read and cite the published conformance report; and the verified scope of the pattern-evaluation and periodic-test parts.Not covered
The verification mathematics of each stage, which belongs to the stage’s own guide (Frequency Weighting, Special Weightings, Filter Class Verification, Sound Intensity); and every test of Parts 2 and 3 themselves, which this page delimits but the library does not perform: no environmental, immunity, acoustical or linearity test is run, and no physical instrument is assigned a class.
verify_filter_periodicgrades the results of a filter-set periodic test; it does not produce them.
Quick answers
Section titled “Quick answers”Can phonometry certify my sound level meter or analyser as class 1?
Section titled “Can phonometry certify my sound level meter or analyser as class 1?”No. The verifiers grade the digital design they are given against the IEC 61672-1:2013 Table 3 or IEC 61260-1:2014 Table 1 acceptance limits; a class for a physical instrument comes from pattern evaluation (IEC 61672-2:2013 / IEC 61260-2:2016) and stays credible through periodic tests (IEC 61672-3:2013 / IEC 61260-3:2016), all of which need the device in a laboratory. A measurement made with a hardware front end carries two verdicts, the library’s design verdict and the instrument’s test record, and a defensible report names both.
What is the difference between pattern evaluation and periodic tests?
Section titled “What is the difference between pattern evaluation and periodic tests?”Pattern evaluation (Part 2 of each series) verifies a model against every mandatory specification of Part 1 once, on submitted specimens, including environmental and electromagnetic influence tests. Periodic tests (Part 3) re-check a working instrument on a limited, deliberately minimal set of key tests, valid for the conditions of the day; both Part 3 scopes state that passing them supports no general conformance conclusion unless the model’s pattern approval is on record.
Which functions check standards compliance in phonometry?
Section titled “Which functions check standards compliance in phonometry?”verify_weighting_class checks a frequency weighting against
IEC 61672-1:2013 Table 3 (B and AU against ANSI S1.4-1983 and
IEC 61012:1990), verify_filter_class checks a fractional-octave bank
against IEC 61260-1:2014 Table 1, 5.12 and 5.16 (the 1995 class 0 mask via
edition="1995"), and verify_intensity_class checks an intensity
instrument’s residual-index spectrum against IEC 61043:1993. All three report
a per-band class with margins in dB, and the last two hand back a result
that carries .plot() and an accredited .report() fiche. Seven more verifiers grade a measurement rather
than a design and return a plain pass or fail:
verify_aircraft_noise_system against IEC 61265:1995, verify_weighting,
verify_phase_response, verify_signal_burst_response and
verify_running_rms_decay against the tolerance tables of ISO 8041-1:2017, and
verify_sound_calibrator against IEC 60942:2017 and verify_filter_periodic
against IEC 61260-3:2016, both by the conformance rule of IEC TC 29 that
verify_conformance publishes on its own.
References
Section titled “References”- International Electrotechnical Commission. (1993). Electroacoustics — Instruments for the measurement of sound intensity — Measurements with pairs of pressure sensing microphones (IEC 61043:1993). The class limits on the pressure-residual intensity index behind verify_intensity_class, the third verifier family this page inventories.
- International Electrotechnical Commission. (2013). Electroacoustics — Sound level meters — Part 1: Specifications (IEC 61672-1:2013). The two performance categories of clause 1 (same design goals, different acceptance limits and operational temperature range), the Table 3 frequency-weighting acceptance limits checked by verify_weighting_class, and the conformance rule of 5.1.21 with the ten examples of Table C.1 that verify_conformance reproduces.
- International Electrotechnical Commission. (2013). Electroacoustics — Sound level meters — Part 2: Pattern evaluation tests (IEC 61672-2:2013). The full type-approval regime for a physical sound level meter: every mandatory specification of Part 1, including the environmental, electrostatic and radio-frequency influence tests, exercised on submitted specimens. Nothing on this page performs it.
- International Electrotechnical Commission. (2013). Electroacoustics — Sound level meters — Part 3: Periodic tests (IEC 61672-3:2013). The deliberately restricted set of key tests a working meter receives in the laboratory, and the clause 1 caveat that periodic results alone support no general conformance conclusion. Cited here as the model for what a class verdict does not say.
- International Electrotechnical Commission. (2014). Electroacoustics — Octave-band and fractional-octave-band filters — Part 1: Specifications (IEC 61260-1:2014). The class 1 / class 2 relative-attenuation acceptance limits of Table 1, the effective bandwidth of 5.12 and the summation of 5.16 checked by verify_filter_class, the time-invariant operation of 5.14 by verify_time_invariance, the Annex B maxima verify_filter_periodic grades against, and the subclause 1.2 statement of what separates the two classes.
- International Electrotechnical Commission. (2016). Electroacoustics — Octave-band and fractional-octave-band filters — Part 2: Pattern-evaluation tests (IEC 61260-2:2016). The pattern-evaluation regime for a physical filter set: at least three submitted specimens, the full Table 1 walk, linearity, electromagnetic compatibility and climate sensitivity. Its Formulas (1) to (3) and its swept test of 7.4 are computed on a design by verify_filter_class and verify_time_invariance; the tests on a specimen are a laboratory's.
- International Electrotechnical Commission. (2016). Electroacoustics — Octave-band and fractional-octave-band filters — Part 3: Periodic tests (IEC 61260-3:2016). The periodic tests of a working analyser: midband relative attenuation or effective bandwidth deviation, the linear operating range with its level range control and overload indicator, the lower limit of that range, and the clause 13 relative-attenuation test at the Table 1 normalized frequencies on three selected filters. verify_filter_periodic grades a laboratory's results against them.
- International Electrotechnical Commission. (2017). Electroacoustics — Sound calibrators (IEC 60942:2017). The conformance rule of 5.1.15 and Annex D, the eight examples of Table E.1 that verify_conformance reproduces, and the requirements verify_sound_calibrator grades a calibrator against.