Frequency Weighting (A, C, Z)
Standards: ISO 226IEC 61672IEC 651Key references: Fletcher & Munson 1933
Frequency weighting curves simulate the human ear’s sensitivity. This guide
covers A, C and Z, the curves specified by IEC 61672-1:2013:
where they come from, how to apply them, the high_accuracy design and the
Table 3 class verification. The rest of the family, the infrasound G curve,
the historical B and D and the AU curve, is
Special Weightings.
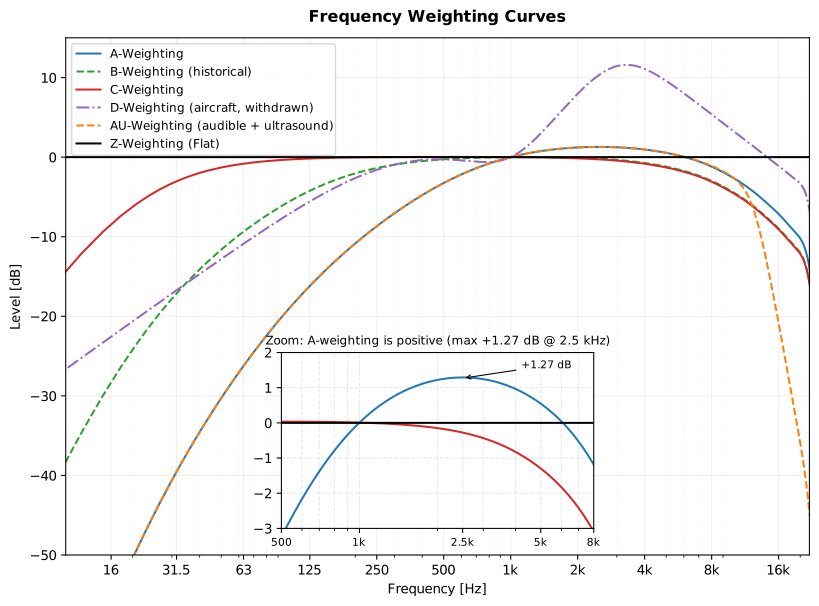
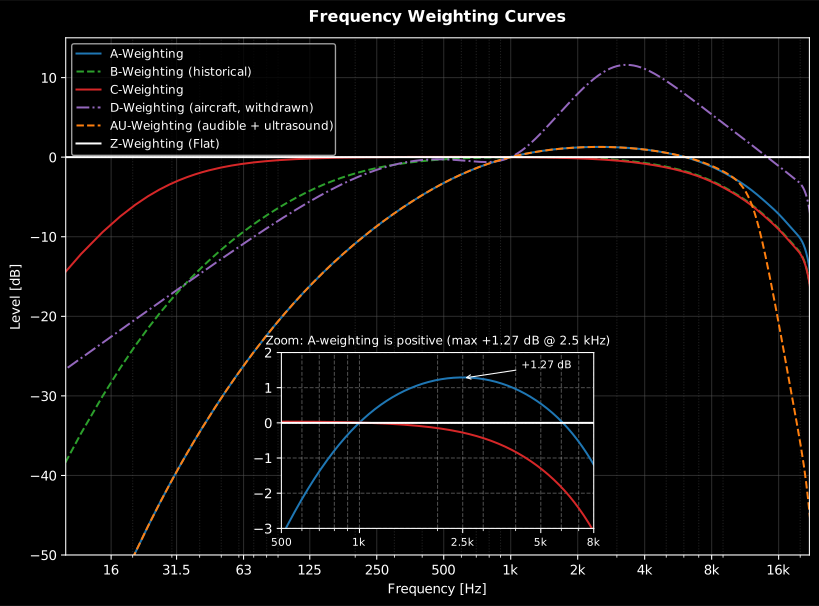
The three curves of IEC 61672-1, measured through the library’s own filters at 48 kHz: A, which discards the bass; C, which keeps it; and Z, which weights nothing at all. The inset magnifies the small positive region of A around 2.5 kHz. The special B, D and AU curves have their own chart in Special Weightings, together with the infrasound G curve.
Show the code for this figure
import matplotlib.pyplot as pltimport numpy as npfrom phonometry import filters
# Measure each curve's response: weight a centered unit impulse and take# its spectrum (1 s buffer -> 1 Hz frequency resolution).fs = 48000impulse = np.zeros(fs)impulse[fs // 2] = 1.0freqs = np.fft.rfftfreq(fs, 1 / fs)
fig, ax = plt.subplots(figsize=(9, 5))for curve in ("A", "C", "Z"): spectrum = np.fft.rfft(filters.weighting_filter(impulse, fs, curve=curve)) ax.semilogx(freqs[1:], 20 * np.log10(np.abs(spectrum[1:]) + np.finfo(float).eps), label=curve)ax.set(xlim=(10, 22000), ylim=(-72, 15), xlabel="Frequency [Hz]", ylabel="Response [dB]")ax.grid(True, which="both", alpha=0.3)ax.legend()plt.show()- A-Weighting (
A): Standard for environmental noise (IEC 61672-1). - C-Weighting (
C): Used for peak sound pressure and high-level noise. - Z-Weighting (
Z): flat by specification, not by omission. IEC 61672-1 defines Z as a nominally flat response from 10 Hz to 20 kHz with the same Table 3 tolerances as A and C, which is whyverify_weighting_classcan grade it at all. The library implements it as a bypass, so the effective bandwidth of a Z-weighted level is whatever your capture chain delivered: remove DC (detrend) and high-pass the wind noise yourself if the recording extends below 10 Hz.
The curve argument also accepts the four special weightings, charted and
documented in Special Weightings:
'G' for infrasound (ISO 7196), the historical 'B' (ANSI S1.4-1983) and
'D' (IEC 537), and 'AU' for audible sound in the presence of ultrasound
(IEC 61012).
The one-line answer is filters.weighting_filter(recording, fs, curve='A').
Section 2 shows it on a runnable signal, section 5 explains why the default
design is fitted at the sample rate rather than transformed from the printed
prototype, and section 6 proves the result meets class 1.
1. Where the curves come from
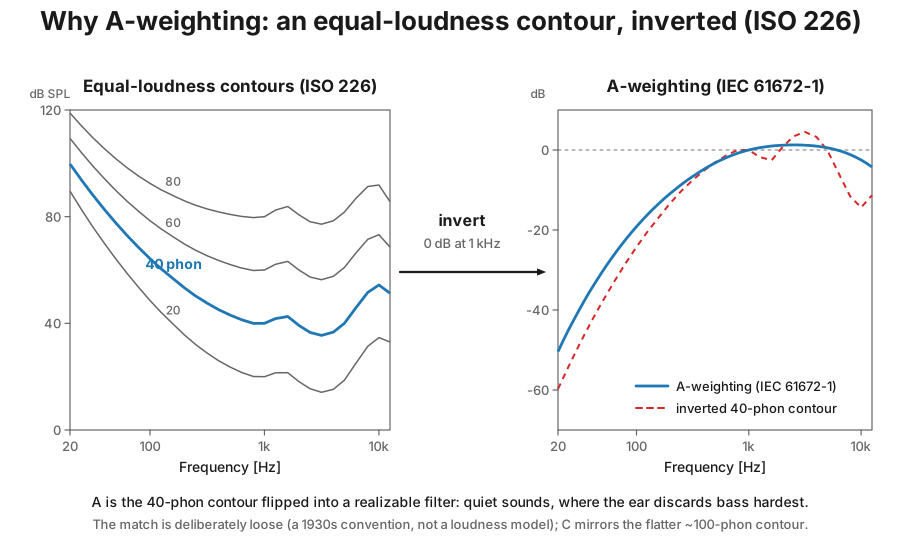
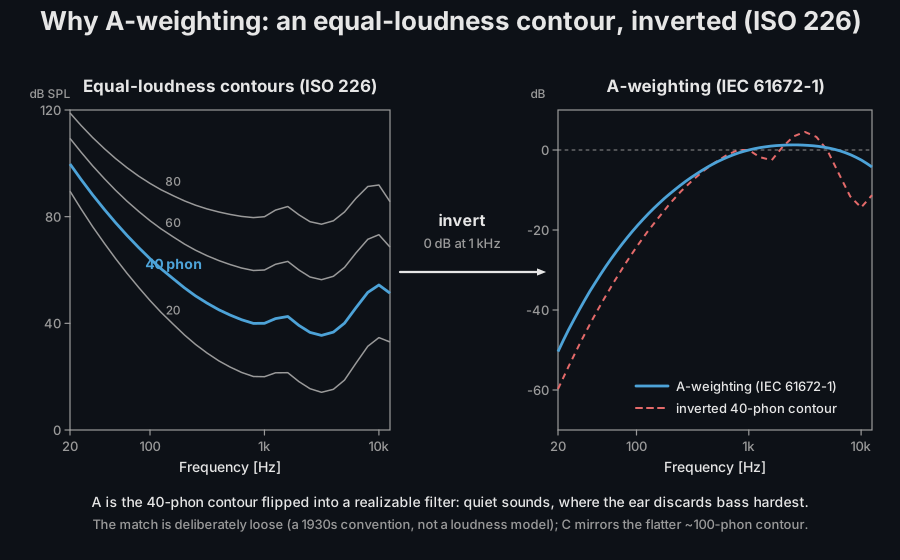
Section titled “1. Where the curves come from”The A and C curves are inverted equal-loudness contours, frozen into filters: A approximates the inverse of the historic 40-phon contour (quiet levels, where the ear discards bass most aggressively) and C the flatter ~100-phon one (loud levels). IEC 61672-1:2013 (Annex E) defines both analytically from four corner frequencies:
C is a band-pass with double poles at and (2 zeros at the origin); A adds the and poles (4 zeros), which is why it keeps falling through the low-mids. Both are normalized to exactly 0 dB at 1 kHz. Z applies no shaping inside the specified band; its design goal is 0 dB everywhere from 10 Hz to 20 kHz. The full pole/zero derivation is in the Theory page.
A short history: A, B, C and Z
Section titled “A short history: A, B, C and Z”The chain runs from Fletcher and Munson’s 1933 equal-loudness measurements to the first American sound level meter standard (1936), which gave meters switchable responses so the reading could approximate loudness at different levels: A from the 40-phon contour for quiet sounds, B from the ~70-phon contour for moderate ones, and a flat response for loud ones (the C curve proper, mirroring the flatter ~100-phon contour, arrived with the 1944 revision). Switching curves by level died in practice (readings jumped at the switch points, and field measurements became incomparable), but A survived alone: decades of hearing-damage and community-annoyance data had been collected with it, and it correlates with both about as well as far more elaborate metrics. IEC 61672-1 (first edition 2002) finished the cleanup: B was dropped, A and C were kept with tightened tolerances, and Z was introduced to replace the vaguely specified “linear” of older meters, which varied by manufacturer. The B curve (and the aircraft-noise D curve that met the same fate) remains available for historical data; see Special Weightings.
When C − A matters
Section titled “When C − A matters”Because A discards bass and C keeps it, the difference is a one-number indicator of low-frequency content:
- Below about 10 dB: an ordinary broadband spectrum; the A-weighted level rates it fairly.
- Around 15 to 20 dB or more: the energy is concentrated at low frequencies (HVAC rumble, compressors, music bass through a wall). The A-weighted level then understates the problem; look at the octave spectrum, and below 20 Hz switch to the G curve.
- Hearing-protector selection: the HML method of ISO 4869-2 keys on exactly this C-minus-A difference to decide how much low-frequency attenuation a protector must provide (the simpler SNR method sidesteps it by working from the C-weighted level directly).
import numpy as npfrom phonometry import filters, signals
# A 50 Hz rumble under a light broadband hiss: quiet in A, loud in C.fs = 48000t = np.arange(10 * fs) / fsrng = np.random.default_rng(1)x = 0.2 * np.sin(2 * np.pi * 50 * t) + 0.01 * rng.standard_normal(t.size)
la = signals.leq(filters.weighting_filter(x, fs, curve="A"))lc = signals.leq(filters.weighting_filter(x, fs, curve="C"))print(f"LAeq = {la:.1f} dB   LCeq = {lc:.1f} dB   C - A = {lc - la:.1f} dB")# LAeq = 52.4 dB   LCeq = 75.7 dB   C - A = 23.2 dB# C - A above 20 dB: the A-weighted number alone would hide the rumble.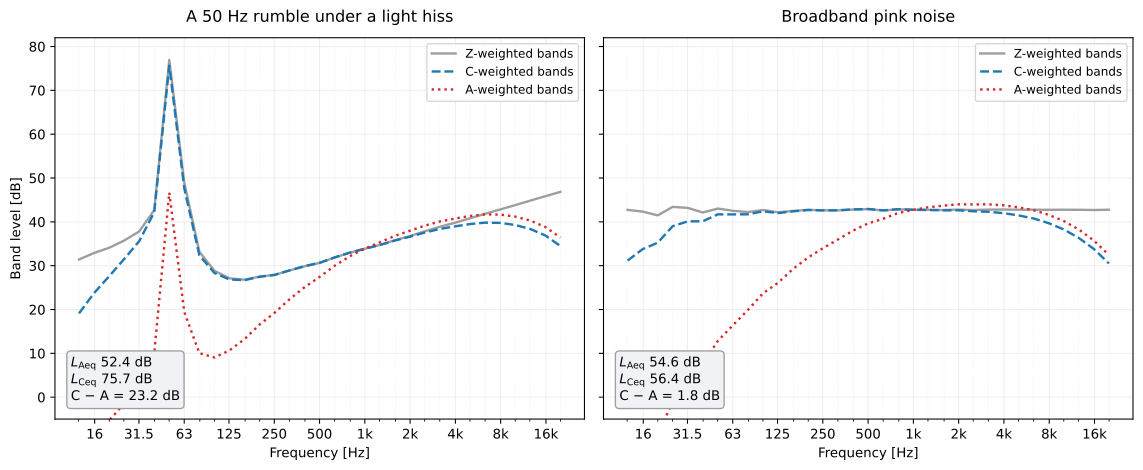
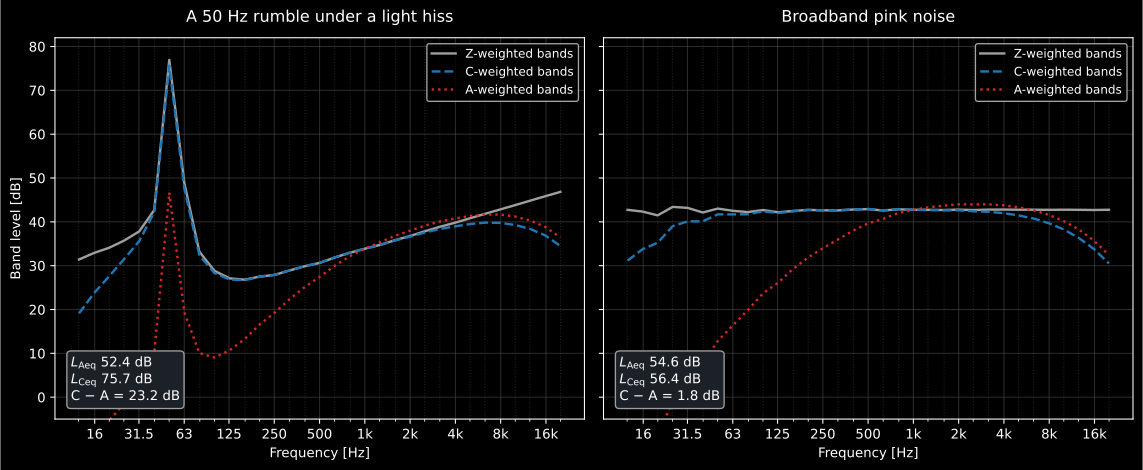
The same three band levels for two signals. A concentrated low-frequency source (left) puts almost all its energy where A cuts hardest, so C − A reaches 23 dB and the A-weighted level alone says nothing about it. Broadband pink noise (right) gives C − A = 1.8 dB, which is the regime the first bullet describes.
Show the code for this figure
import matplotlib.pyplot as plt
fig, ax = plt.subplots(figsize=(9, 4.5))for curve, style in (("Z", "-"), ("C", "--"), ("A", ":")):    filtered = filters.octave_filter(        filters.weighting_filter(x, fs, curve=curve), fs, fraction=3)    band_levels, centres = filtered.levels, filtered.frequencies    ax.semilogx(centres, band_levels, style, label=f"{curve}-weighted bands")ax.set(xlabel="Band centre frequency [Hz]", ylabel="Band level [dB]")ax.legend()plt.show()
What A-weighting cannot do
Section titled “What A-weighting cannot do”A is a fixed filter derived from pure-tone equal-loudness data at one loudness level, and it is applied to complex spectra at every level. Three assumptions follow, and each breaks in a way worth naming. It says nothing about how bands combine, because the contours were measured with single tones; it is frozen at the 40-phon contour, so loud low-frequency sound is systematically under-rated as the real contours flatten with level; and it has no time structure at all, so an impulse and a steady sound of the same energy receive identical treatment.
Each of those has a proper instrument. For perceived loudness, use the ISO 532 models of Loudness rather than a different weighting curve. For content below 20 Hz, use the G curve of ISO 7196 (Special Weightings). For tonal or impulsive character, use the ISO 1996-1 adjustments (Environmental Levels). None of that makes A wrong to use: A-weighted levels are the quantity the limits are written in, so a report states the A-weighted level and adds the other metrics as supporting evidence, never as a substitute.
2. Basic usage
Section titled “2. Basic usage”import numpy as npfrom phonometry import filters
# recording: a calibrated microphone capture (Pa) — recorded through your measurement chain. Synthesized here so the guide runs standalone.fs = 48000recording = 0.2 * np.sin(2 * np.pi * 1000 * np.arange(fs) / fs)
# Apply A-weighting to the raw recordingweighted_signal = filters.weighting_filter(recording, fs, curve='A')
# Apply C-weighting for peak analysisc_weighted_signal = filters.weighting_filter(recording, fs, curve='C')The special weightings take the same curve argument; each is documented,
with its own response chart, in
Special Weightings.
Weighting a spectrum, not a waveform
Section titled “Weighting a spectrum, not a waveform”The commonest desk task is not weighting a recording but A-weighting a table of one-third-octave band levels, and there are two routes that do not give the same answer. The exact one is what a meter does: weight the waveform, then band-filter it.
band_source = signals.noise_signal(fs, 20.0, color="pink", rms=0.05, seed=3)filtered = filters.octave_filter( filters.weighting_filter(band_source, fs, curve="A"), fs, fraction=3)weighted_bands, centres = filtered.levels, filtered.frequenciesprint(f"energy sum of the A-weighted bands " f"{10 * np.log10(np.sum(10 ** (weighted_bands / 10))):.2f} dB")print(f"LAeq of the same signal " f"{signals.laeq(band_source, fs):.2f} dB")# energy sum of the A-weighted bands 62.84 dB# LAeq of the same signal 62.79 dBThe table route is the one you are forced into when the data arrives as band levels already: add the tabulated to each band level. It is an approximation, because A slopes steeply across the low bands, so its energy-weighted mean inside a band is not its value at the mid frequency. Measured against the exact route on the same pink noise: the two agree to better than 0.1 dB from 100 Hz to 8 kHz, the table route reads up to 0.7 dB low in the lowest bands (where A rises by about 12 dB per octave) and up to 1 dB high in the topmost band at 48 kHz (where A falls steeply and the band is clipped by Nyquist), while the totals agree to a few hundredths. So the error is not one-sided: it follows the sign of the curvature of the weighting across the band.
Report which route produced a weighted spectrum. The totals will agree; the band levels will not, and a band-by-band comparison between a meter’s A-weighted spectrum and a table-corrected one will show tenths of a decibel that are method, not measurement. The same argument applies unchanged to C and to G.
3. weighting_filter() / WeightingFilter parameters
Section titled “3. weighting_filter() / WeightingFilter parameters”| Parameter | Type | Units | Range / default | Notes |
|---|---|---|---|---|
x | 1D or 2D array, or Signal | any | non-empty | 2D is [channels, samples] |
fs | int | Hz | > 0; taken from x when x is a Signal | |
curve | str | — | 'A' (default), 'B', 'C', 'D', 'G', 'AU', 'Z', '468' | 'G' per ISO 7196 (infrasound), 'B'/'D' historical and 'AU' per IEC 61012 are covered in Special Weightings; 'Z' is implemented as a bypass of a response the standard specifies as flat; '468' is the ITU-R BS.468-4 programme-level curve, and its skirt is steep enough that it needs the fitted design and refuses high_accuracy=False |
high_accuracy | bool | — | default True | Fit the analog prototype at instead of transforming it blind; keeps A/C in class 1 at every sample rate. Details in §5 |
stateful | bool (class only) | — | default False | Carries filter state across blocks (streaming) |
steady_ic | bool (class only) | — | default False | Steady-state initial conditions (no onset transient) |
4. Reusable filter object
Section titled “4. Reusable filter object”If you weight many signals with the same parameters, design the filter once:
import numpy as npfrom phonometry import filters
# recording: a calibrated microphone capture (Pa) — recorded through your measurement chain. Synthesized here so the guide runs standalone.fs = 48000recording = 0.2 * np.sin(2 * np.pi * 1000 * np.arange(fs) / fs)
wf = filters.WeightingFilter(fs, "A")batch = [recording]                  # your batch of recordingsfor recording in batch:    weighted = wf.filter(recording)
5. High-frequency accuracy (high_accuracy)
Section titled “5. High-frequency accuracy (high_accuracy)”The curves of section 1 are analog: poles and zeros in the plane. Turning them into a digital filter with the bilinear transform is exact in magnitude and wrong in frequency: it puts the prototype’s response at instead of at , and the error grows quadratically toward Nyquist. At kHz that plain design reads 15.7 dB below the A design goal at the 19 952.6 Hz row, and at kHz it reads 61.4 dB below it at 15 848.9 Hz.
By default (high_accuracy=True) phonometry does not transform the prototype
blind: it fits an analog prototype of the same structure whose response
at the warped frequencies is the printed prototype’s response at the true
ones, and transforms that. What runs is one cascade of second-order sections
at the input rate, with nothing around it. Measured against the printed
prototype over each standard’s own band:
| Curve | 32 kHz | 44.1 kHz | 48 kHz | 96 kHz |
|---|---|---|---|---|
| A | 0.008 dB | 0.003 dB | 0.0003 dB | 0.00001 dB |
| C | 0.002 dB | 0.002 dB | 0.0004 dB | 0.00001 dB |
| AU | 0.003 dB | 0.005 dB | 0.004 dB | 0.001 dB |
| 468 | 0.041 dB | 0.052 dB | 0.060 dB | 0.00002 dB |
A and C therefore verify to class 1 at every sample rate from 8 kHz up, and at every Table 3 row their deviation stays inside the 0.05 dB the table itself is rounded to. The path used to reach its sections through an interpolation and a decimation stage instead, and the anti-alias filter of those stages had its transition band on the input Nyquist frequency: at kHz that put the 15 848.9 Hz row 16.2 dB below the A design goal, over the −16.0 dB class 1 limit, so A verified only to class 2 there.
The band the fit controls is the curve’s own standardised range, clipped at the top to 99.5 % of the Nyquist frequency, enough to contain every frequency these standards state a requirement at, the closest approach being Table 3’s 15 848.9 Hz row at 0.9906 of Nyquist when kHz. Above that last half percent the response is not claimed: no digital filter can track an analog curve past Nyquist, and the magnitude of a real-coefficient filter has zero slope there. That is where the 468 row of the table above comes from; its skirt is still falling at about dB/octave where the band ends, and it is 3 % of that curve’s dB tolerance, not an accuracy shortfall.
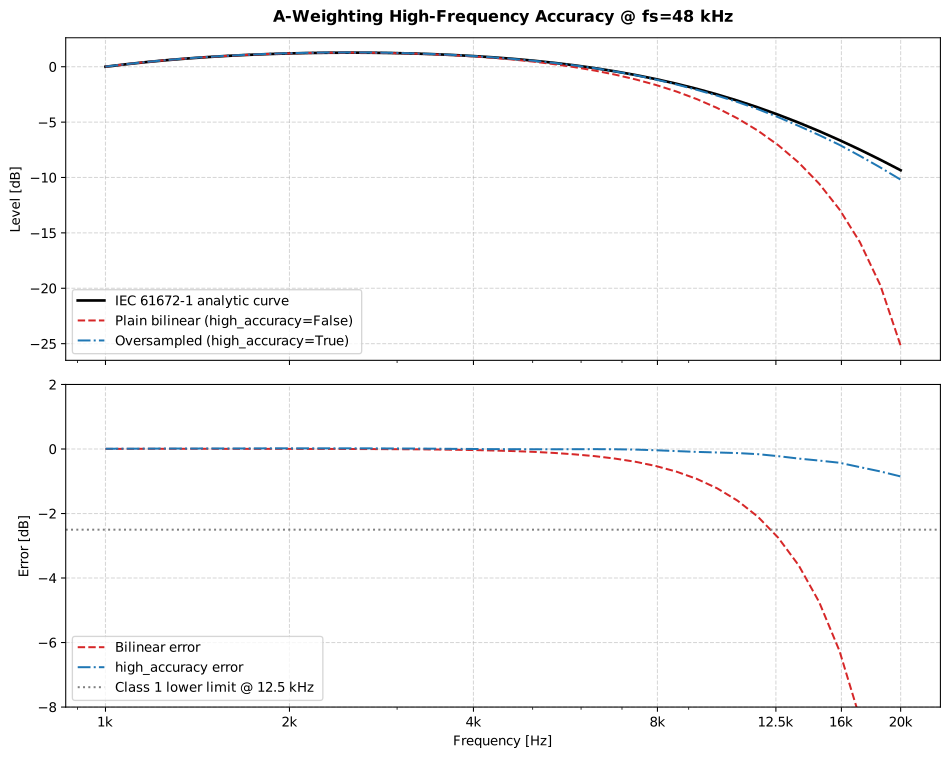
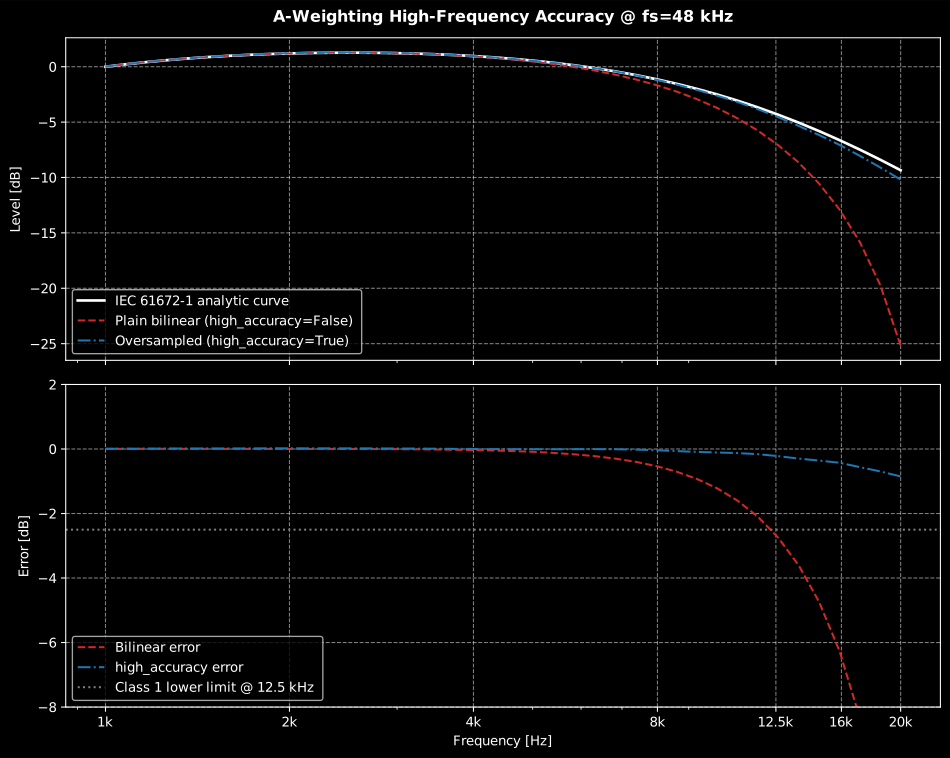
The plain bilinear design (red) crosses the class 1 tolerance near 12.5 kHz; the fitted design (blue) sits on the analytic curve.
Show the code for this figure
import matplotlib.pyplot as pltimport numpy as npfrom phonometry import filters
# Measured response of both designs at fs = 48 kHz: weight a centered# unit impulse and take its spectrum...fs = 48000impulse = np.zeros(fs)impulse[fs // 2] = 1.0freqs = np.fft.rfftfreq(fs, 1 / fs)[1:]
# ...versus the analytic IEC 61672-1 A-curve built from the four corner# frequencies of section 1, normalized to 0 dB at 1 kHz.f1, f2, f3, f4 = 20.599, 107.653, 737.862, 12194.217gain = (f4**2 * freqs**4) / ((freqs**2 + f1**2)        * np.sqrt((freqs**2 + f2**2) * (freqs**2 + f3**2))        * (freqs**2 + f4**2))analytic = 20 * np.log10(gain / gain[np.argmin(np.abs(freqs - 1000))])
fig, ax = plt.subplots(figsize=(9, 5))ax.semilogx(freqs, analytic, "k--", label="Analytic (IEC 61672-1)")for high_accuracy, label in ((False, "Plain bilinear"), (True, "Fitted at fs (default)")): weighted = filters.weighting_filter(impulse, fs, curve="A", high_accuracy=high_accuracy) response = 20 * np.log10(np.abs(np.fft.rfft(weighted)) + np.finfo(float).eps)[1:] ax.semilogx(freqs, response, label=label)ax.set(xlim=(1000, 20000), ylim=(-12, 3), xlabel="Frequency [Hz]", ylabel="A-weighting response [dB]")ax.grid(True, which="both", alpha=0.3)ax.legend()plt.show()high_accuracy=Falsegives the plain bilinear design: the closed form a reader can check against the standard term by term, at the cost above. It verifies to class 1 for Hz, degrades to class 2 at 32 000 and 22 050 Hz, and meets no class at 16 000 Hz.- The
'468'curve refuseshigh_accuracy=False: its skirt puts the plain design 23 dB out at 16 kHz, and ITU-R BS.468-4 prints one tolerance mask and no lower grade to fall back to. - Stateful (block) processing carries no penalty. Both designs are plain
second-order sections at the input rate, so
statefulandhigh_accuracyare independent, stateful defaults to the fitted design like everything else, and stitched blocks reproduce a single call exactly. - The fit costs about 200 ms and is cached per curve and sample rate, so it is paid once. Even including it, weighting one minute of 44.1 kHz audio is faster than it used to be: about 215 ms against 377 ms for A, and 220 ms against 775 ms for the 468 curve. Once the design is cached the filtering alone is about 18 ms, and it holds 21 MB of intermediates instead of 169 MB.
import numpy as npfrom phonometry import filters
# recording: a calibrated microphone capture (Pa) — recorded through your measurement chain. Synthesized here so the guide runs standalone.fs = 48000recording = 0.2 * np.sin(2 * np.pi * 1000 * np.arange(fs) / fs)
# The closed-form bilinear design, explicitlyy = filters.weighting_filter(recording, fs, curve="A", high_accuracy=False)
# Stateful block processing (same fitted design, state carried between blocks)wf = filters.WeightingFilter(fs, "A", stateful=True)blocks = [recording]                 # your sequence of recording blocksfor block in blocks:    weighted = wf.filter(block)
See Block Processing for the streaming workflow and Theory for the analytic curve definitions.
6. Verifying against the tolerance tables (IEC 61672-1)
Section titled “6. Verifying against the tolerance tables (IEC 61672-1)”verify_weighting_class checks a weighting filter against the acceptance
limits of IEC 61672-1:2013 (Table 3). It evaluates the filter’s relative
response at the exact base-10 frequency behind each nominal label below
Nyquist (Table 3’s design goals are computed at ,
e.g. 15 848.9 Hz for “16 kHz”; IEC 61672-3 tests at the same frequencies),
subtracts the design-goal weighting, and reports the performance class per
frequency with its margin in dB. A dense logarithmic sweep additionally
enforces subclause 5.5.7 between the nominal frequencies (the deviation
from the analytic Annex E goal must stay within the larger of the two
adjacent limits, so a resonance or notch between nominals cannot pass), and
when Table 3 rows with finite lower limits fall beyond Nyquist the verdict is
flagged range_limited (it then attests the checked frequencies only, not
full 10 Hz-20 kHz conformance):
from phonometry import filters
result = filters.verify_weighting_class(filters.WeightingFilter(48000, "A"))print(result.overall_class)          # 1print(result.range_limited)          # Falseprint(result.between_nominals)       # {'worst_freq': ..., 'margin_class1_db': ...}print(result.bands[20])# {'freq': 1000.0, 'class': 1, 'deviation_db': 0.0, 'margin_class1_db': 0.7, 'margin_class2_db': 1.0}
The Table 3 acceptance mask itself is public too: weighting_class_limits(1)
returns the 34 nominal frequencies with the lower/upper deviation limits (a
lower limit of -inf means only the upper limit applies). The limits qualify
the deviation from the design goal, so they are the same for A, C and Z.
The laboratory grade lives in the superseded edition. IEC 61672-1:2013
publishes classes 1 and 2 only; Type 0, the tightest of the four
instrument types of IEC 651:1979, survives in that standard’s Table V.
Pass edition="1979" to grade against it, exactly as verify_filter_class
reaches the IEC 61260:1995 class 0. Class N is then the standard’s
instrument Type N, and every band and the sweep carry one margin per type,
margin_class0_db through margin_class3_db:
from phonometry import filters
result = filters.verify_weighting_class(    filters.WeightingFilter(48000, "A"), edition="1979")print(result.overall_class)                             # 0print(min(b["margin_class0_db"] for b in result.bands)) # 0.650...
It is a different mask, not a rename, and it sees errors class 1 cannot:
Type 0 holds +2/-3 dB at both 16 kHz and 20 kHz, where class 1 opens to
+2.5/-16 dB and +3/-inf. The undersampled high_accuracy=False design at
48 kHz droops 15.7 dB at the 20 kHz row and still earns class 1 for it; under
Table V that row is refused and the filter is graded Type 1. The 1979 edition
covers A, B and C, the weightings IEC 651 defines: its Table V footnote makes
one mask govern every weighting characteristic, so B is held to the same
limits there rather than borrowing the ANSI ones.
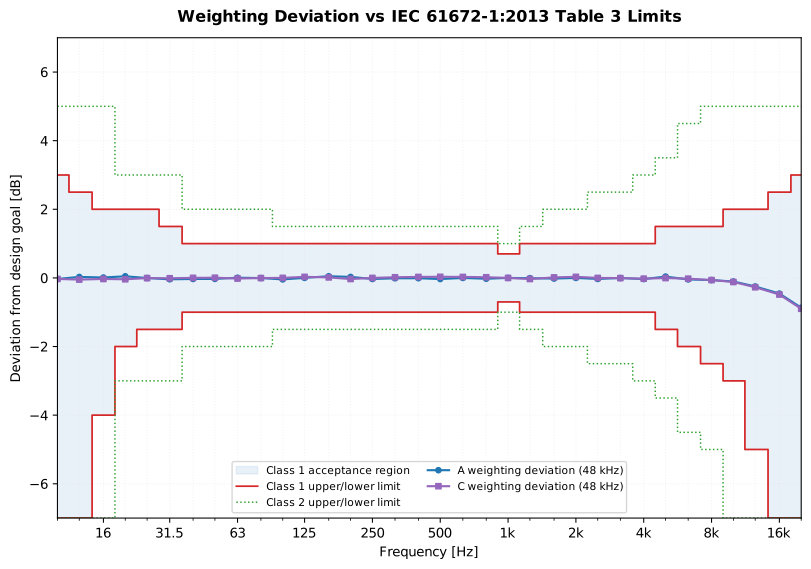
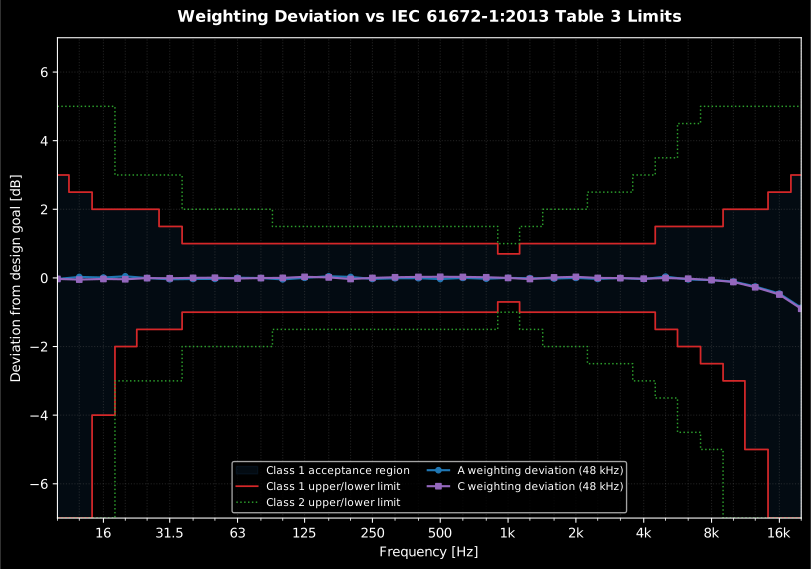
The fitted A and C designs (blue, purple) stay near zero deviation, well inside the class 1 corridor (shaded); the wider class 2 limits are dotted. The corridor widens at the band extremes where only a one-sided limit applies.
Show the code for this figure
import matplotlib.pyplot as pltimport numpy as npfrom phonometry import filters
freqs, lower1, upper1 = filters.weighting_class_limits(1)_, lower2, upper2 = filters.weighting_class_limits(2)lo1, lo2 = np.clip(lower1, -7, 7), np.clip(lower2, -7, 7)
fig, ax = plt.subplots(figsize=(10, 6.5))ax.fill_between(freqs, lo1, upper1, step="mid", alpha=0.10,                label="Class 1 acceptance region")ax.plot(freqs, upper1, drawstyle="steps-mid", label="Class 1 upper/lower limit")ax.plot(freqs, lo1, drawstyle="steps-mid", color="C1")ax.plot(freqs, upper2, ":", drawstyle="steps-mid", label="Class 2 upper/lower limit")ax.plot(freqs, lo2, ":", drawstyle="steps-mid", color="C2")
for curve, marker in (("A", "o"), ("C", "s")):    bands = filters.verify_weighting_class(filters.WeightingFilter(48000, curve)).bands    f = [b["freq"] for b in bands]    dev = [b["deviation_db"] for b in bands]    ax.plot(f, dev, marker=marker, label=f"{curve} weighting deviation (48 kHz)")
ax.set(xscale="log", xlim=(10, 20000), ylim=(-7, 7),       xlabel="Frequency [Hz]", ylabel="Deviation from design goal [dB]")ax.legend(fontsize=8, ncol=2)plt.show()
What this guide covers
Section titled “What this guide covers”Covered
IEC 61672-1:2013 for the A, C and Z curves: the Annex E analytic definition from four corner frequencies, the
high_accuracydesign that keeps class 1 tolerances at every sample rate from 8 kHz up, and the Table 3 class 1/class 2 acceptance limits checked byverify_weighting_class.Not covered
The special curves, the infrasound G of ISO 7196, the historical B (ANSI S1.4-1983) and D (IEC 537) and the AU of IEC 61012, together with the verification of B and AU against their tolerance tables, have their own guide: Special Weightings.
Quick answers
Section titled “Quick answers”How do I apply A-weighting to a signal in Python?
Section titled “How do I apply A-weighting to a signal in Python?”Call filters.weighting_filter(recording, fs, curve='A') on a calibrated
signal. It returns the A-weighted time signal, filtered with the pole-zero
design of IEC 61672-1:2013 within class 1 tolerances, so
signals.leq() on the output is the . The same function applies C,
Z, B, D, AU and the infrasound G weighting through curve.
When should I use C-weighting instead of A-weighting?
Section titled “When should I use C-weighting instead of A-weighting?”Use C-weighting for peak sound pressure and high-level noise, and use the difference as a low-frequency indicator: below about 10 dB the A-weighted level rates the spectrum fairly, while around 15 to 20 dB or more the energy is concentrated at low frequencies and the A-weighted level understates the problem. The HML method of ISO 4869-2 keys on exactly this C minus A difference for hearing-protector selection.
Is A-weighting accurate near 16 kHz at a 48 kHz sample rate?
Section titled “Is A-weighting accurate near 16 kHz at a 48 kHz sample rate?”Not with a plain bilinear design: at kHz the A-curve error reaches −2.7 dB at 12.5 kHz, outside the IEC 61672-1 class 1 tolerance (+2.0/−2.5 dB). The default high_accuracy=True fits the prototype at the sample rate instead, which leaves 0.0003 dB anywhere in the table at 48 kHz and 0.008 dB at 32 kHz, so class 1 holds at every sample rate from 8 kHz up. §5 has the numbers and the band the fit controls.
References
Section titled “References”- Fletcher, H., & Munson, W. A. (1933). Loudness, its definition, measurement and calculation. The Journal of the Acoustical Society of America, 5(2), 82-108. https://doi.org/10.1121/1.1915637The original equal-loudness measurements whose 40-phon contour the A-curve inverts (section 1).
- International Electrotechnical Commission. (1979). Sound level meters (IEC 651:1979). The superseded edition whose Table V publishes the laboratory-grade Type 0 tolerance mask that verify_weighting_class offers as edition='1979' in section 6, read from the identical British adoption BS 5969:1981.
- International Electrotechnical Commission. (2013). Electroacoustics — Sound level meters — Part 1: Specifications (IEC 61672-1:2013). The normative A, C and Z frequency-weighting curves (the Annex E analytic definition from four corner frequencies, normalized to 0 dB at 1 kHz), the class 1 tolerances the high_accuracy design keeps at every sample rate from 8 kHz up, and the Table 3 class 1/class 2 acceptance limits checked by verify_weighting_class in section 6.
- International Organization for Standardization. (2023). Acoustics — Normal equal-loudness-level contours (ISO 226:2023). The modern successors of the Fletcher-Munson curves, drawn in the diagram of section 1.