Everything else in this section follows vibration because it ends up as sound. This page follows it because it ends up as a crack. A pile driver next door, a tram at the end of the street or a blast on a nearby site puts vibration into the ground, the ground puts it into a foundation, and the question the neighbours ask has nothing to do with audibility: will the building be damaged?
Answering it properly means the dynamic stresses in the structure, compared against what the material and the design allow. DIN 4150-3 offers the cheap answer first, and it is the one used in practice: guideline values (Anhaltswerte) for a single measured quantity, the peak particle velocity, drawn from a large body of measurements on real buildings. Keep under them and damage of the kind the standard defines has not been observed in that body of measurements, which is a statement about the evidence rather than a promise about this building: meeting a guideline value satisfies the DIN 4150-3 criterion and certifies nothing. Exceed them and nothing follows automatically. The standard is explicit that damage does not have to occur; what has run out is the cheap answer, and the stress calculation has to be done instead.
1. What is measured
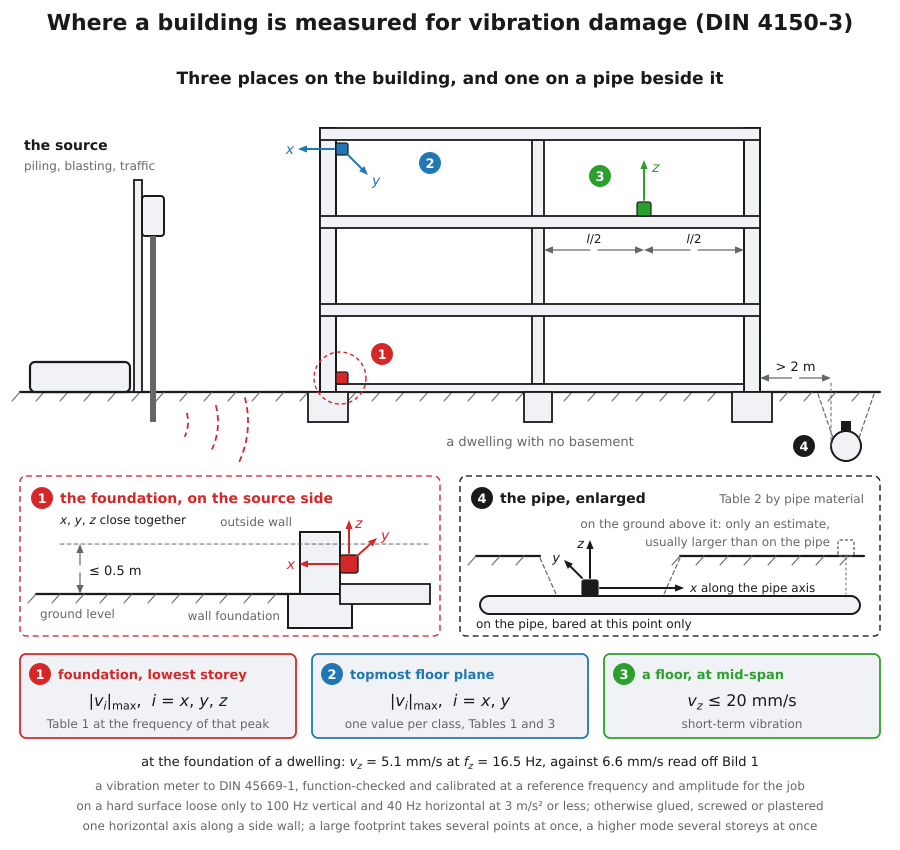
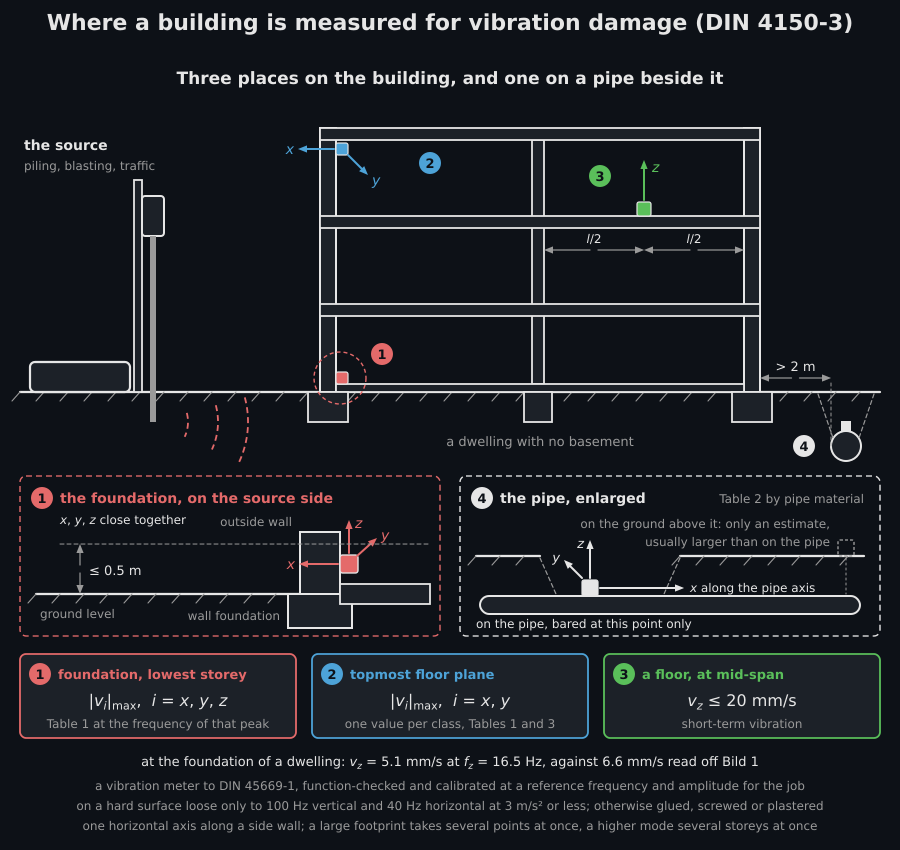
Section titled “1. What is measured”Clause 5.1 fixes the quantity before it fixes any number. At the foundation, the three components , and of the particle velocity are recorded separately and the largest peak of the three, , is the value judged; the standard then writes it and so does this page. The transducers go in the lowest storey, on the foundation or the outside wall, and on an unbasemented building no more than 0,5 m above ground level, preferably on the side facing the excitation.
In the topmost floor plane the quantity changes: the larger of the two horizontal components, measured in or close to the outside wall. That measurement is not a second excitation. It is the building’s horizontal answer to the one at its foundation, which is why the guideline value there does not depend on frequency at all: the response is already at the structure’s own frequencies.
How the measurement goes
Section titled “How the measurement goes”Use a vibration meter that meets DIN 45669-1, function-checked and calibrated at a reference frequency and amplitude for the job. At the foundation, three transducers go close together in the lowest storey, on the foundation of the outside wall, on the wall or in a recess of it, preferably on the side facing the source and, without a basement, no higher than 0,5 m above ground level. They record and two horizontal directions at right angles, one parallel to a side wall and preferably pointing at the source; a large footprint takes several points at once. Loose steps, loose slabs and hollow-sounding surfaces are unsuitable, and on a hard surface a transducer set down loose holds only to 100 Hz vertically and 40 Hz horizontally at 3 m/s² or less; otherwise it is glued, screwed or plastered on. In the topmost floor plane, and go in or close to the outside wall; where relevant, on the floors expected to vibrate most, goes at about mid-span. On a pipeline the transducers go on the pipe where possible, bared only at the measuring point, one horizontal direction along the axis; the ground above is a substitute where the source is neither close beside the pipe nor a short distance below it, and gives only an estimate, usually larger. Record the whole event, or representative stretches, and where possible judge extraneous vibration by comparing the readings with and without the source acting. Read the peak of each component and its frequency, and report what Annex A lists: every point, its direction and its distance to the source.
2. Short-term vibration, and why the guideline rises with frequency
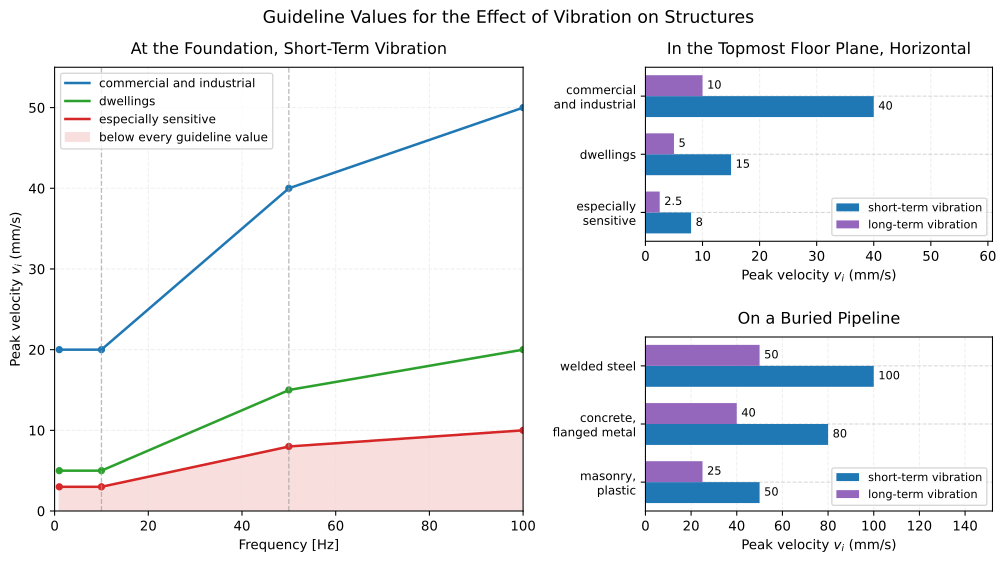
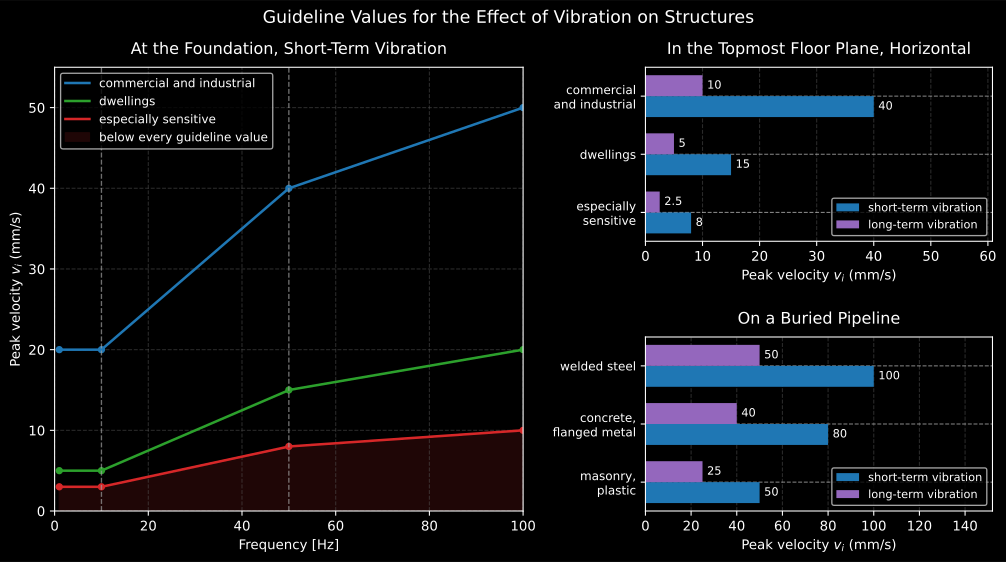
Section titled “2. Short-term vibration, and why the guideline rises with frequency”Short-term vibration is vibration that does not occur often enough to build up resonance in the structure: construction work, blasting, a passing train on a line that is not busy. Table 1 gives its guideline values for three building classes, and at the foundation they depend on frequency.
They rise, and the reason is that the standard is really about strain. The same velocity at a lower frequency means a larger displacement, and it is the displacement across a wall that opens a crack in the plaster. So a building tolerates a fast wiggle better than a slow one, and the guideline value climbs from 1 Hz to 100 Hz. Above 100 Hz the 100 Hz value may be used.
Show the code for this figure
import matplotlib.pyplot as pltimport numpy as npfrom phonometry import vibration
freq = np.linspace(1.0, 100.0, 400)
fig, ax = plt.subplots()for name in vibration.BUILDING_CLASSES:    ax.plot(freq, vibration.guideline_velocity(name, freq), label=name)ax.set(xlabel="Frequency [Hz]", ylabel="Peak velocity $v_i$ [mm/s]")ax.grid(True, alpha=0.3)ax.legend()plt.show()
# One measurement against the guideline it is judged by, drawn on the same# curves:res = vibration.assess_building_vibration(    4.2, building_class="residential", frequency_hz=18.0)print(round(res.guideline_mm_s, 2), res.within_guideline)   # 7.0 Trueres.plot()plt.show()
The three tables at once. The left panel is Bild 1: the guideline value at the foundation, flat to 10 Hz and rising after it. The right panels are the values that carry no frequency, each with the long-term value beside it.
Table 1 prints the middle band as a range, “5 bis 15” for a dwelling between 10 Hz and 50 Hz, and a range does not say what 30 Hz is worth. Bild 1 says it: the corner values joined by straight lines on a linear frequency axis. A dwelling at 30 Hz is allowed 10 mm/s, and that is a reading of the figure, not of the table.
from phonometry import vibration
# The corners Table 1 prints, for a dwelling.for f in (1.0, 10.0, 50.0, 100.0):    print(f, vibration.guideline_velocity("residential", f))# 1.0 5.0 / 10.0 5.0 / 50.0 15.0 / 100.0 20.0
# Inside a band, which only Bild 1 decides.print(vibration.guideline_velocity("residential", 30.0))          # 10.0
# In the topmost floor plane there is nothing to read against frequency,# and passing one anyway is refused rather than ignored.print(vibration.guideline_velocity("residential", location="top_floor"))  # 15.0
The three classes are the rows of Table 1: "commercial" for commercial and
industrial buildings and buildings of like structure, "residential" for
dwellings and buildings of like construction or use, and "sensitive" for
buildings that fit neither and are worth preserving, a listed building being
the example the standard gives. A massive engineering structure such as a
reinforced-concrete abutment or a block foundation may raise the row 1 values
by up to a factor of two, which is what 5.1 allows provided nothing dangerous
comes of the soil mechanics. The allowance is a sentence of Clause 5 naming
Table 1, so it stops at short-term vibration and the library refuses to carry
it over to Table 3:
print(vibration.guideline_velocity("commercial", 50.0, massive_structure=True))3. Floors, and the one number that covers them
Section titled “3. Floors, and the one number that covers them”A floor or ceiling gets its own sentence rather than a table. Clause 5.2: if
the vertical velocity at the point of largest vibration, in general mid-span,
stays at or below 20 mm/s, no reduction in the serviceability of the floor is
expected. The value is published as
FLOOR_VERTICAL_MM_S,
and for a building in row 3 of Table 1 the standard notes that even that may
have to be reduced.
4. Buried pipelines
Section titled “4. Buried pipelines”A pipe in the ground is judged on the pipe, not on the building above it, and by what it is made of. Table 2 has three rows, and Clause 6.3 lets long-term vibration use the same table at 50 % without further evidence:
from phonometry import vibration
print(vibration.pipeline_guideline_velocity("welded_steel"))                # 100.0print(vibration.pipeline_guideline_velocity("masonry_or_plastic"))          #  50.0print(vibration.pipeline_guideline_velocity(    "masonry_or_plastic", duration="long_term"))                            #  25.0
House connections up to 2 m from the building are judged by the building’s own foundation values instead, and drainage pipes by row 3 whatever they are made of.
5. Long-term vibration
Section titled “5. Long-term vibration”Long-term vibration (Dauererschütterungen) is the opposite case: it occurs often enough for the structure to respond at its own frequencies. Table 3 answers it with one value per class in the topmost floor plane and nothing at the foundation, because a structure ringing at its own frequency is judged where it rings. The values run from a quarter to a third of the short-term ones, and the fraction is not the same for the three classes: 10 against 40, 5 against 15 and 2.5 against 8 mm/s.
from phonometry import vibration
for name in vibration.BUILDING_CLASSES:    short = vibration.guideline_velocity(name, location="top_floor")    long = vibration.guideline_velocity(        name, location="top_floor", duration="long_term"    )    print(name, short, long)# commercial 40.0 10.0 / residential 15.0 5.0 / sensitive 8.0 2.5
Asking for a long-term value at the foundation raises, because Table 3 does not have that column.
6. From a velocity to a stress
Section titled “6. From a velocity to a stress”Clause 6.2 is the bridge back to the proper calculation. For a beam or a one-way slab of full rectangular section, constant stiffness and uniform mass, vibrating in one mode, the peak bending stress follows from the peak velocity alone:
No length, no depth, no span: the dimensions cancel, which is the whole reason the formula is worth having. A velocity measured where the amplitude is largest is enough. The mode coefficient lies between 1 and 1,3 in the technically important cases, so it can move the answer by less than a third, and is 1 for a beam carrying nothing but itself.
from phonometry import vibration
# Concrete, 30 GPa dynamic modulus, 2400 kg/m3, first mode, 10 mm/s peak.# Note the unit: the tables are in mm/s and this formula is in m/s.sigma = vibration.bending_stress(    0.010, dynamic_modulus_pa=3.0e10, density_kg_m3=2400.0)print(round(sigma / 1e6, 2), "MPa")     # 0.15 MPa
Clause 6.4 adds the estimate that says whether the topmost floor plane will answer at all: for a building of about five storeys or more, the lowest horizontal natural frequency is roughly with the number of storeys.
print(vibration.storey_fundamental_frequency(10)) # 1.0 HzBelow that, BuildingDamageWarning says so: four storeys still return
2.5 Hz, because “about five” is not a line the standard drew, but the number
is an extrapolation of a rule offered for taller buildings rather than the
rule itself.
What this guide covers
Section titled “What this guide covers”Covered
The guideline values of DIN 4150-3 as published: Table 1 at the foundation against frequency and in the topmost floor plane, Table 2 for buried pipelines, Table 3 for long-term vibration, the doubling of row 1 for massive engineering structures (5.1), the 50 % reduction of Table 2 for long-term vibration (6.3) and the 20 mm/s vertical value for floors (5.2).
The reading of Bild 1 between the printed corner values: straight lines on a linear frequency axis, so a value inside a band is defined rather than left to the reader.
The bending stress of Formula (1) in 6.2 and the storey estimate of 6.4.
Not covered
Nothing predicts the vibration: the guideline values are compared against a measurement you supply. Prediction of ground-borne vibration from a source to a building, which is DIN 4150-1, is not here, and neither is the human perception of vibration in buildings of DIN 4150-2. For people rather than structures, see the human vibration pages.
The stress route is one formula, not a design check. Clauses 4.2 to 4.4, which determine the dynamic stresses by measurement or calculation and compare them against the permissible ones, are what a reader has to do when a guideline value is exceeded; only the closed-form bridge of 6.2 is implemented. Fatigue, settlement of non-cohesive soils under repeated vibration (4.6, Annex C) and foundation displacement are described in the standard and not modelled here.
The measurement is described, not checked. Where the transducers go, how they are set down and what the report carries are 5.4, Annex A and the DIN 45669 parts 5.4 refers to, set out above for the person measuring. None of that is implemented here, and neither is the instrument itself.
References
Section titled “References”- Deutsches Institut für Normung. (1999). Erschütterungen im Bauwesen — Teil 3: Einwirkungen auf bauliche Anlagen (DIN 4150-3:1999-02). The measured quantity of 5.1, the short-term guideline values of Table 1 with the curves of Bild 1, the ceiling rule of 5.2, the buried-pipeline values of Table 2, the long-term values of Table 3 and the 50 % reduction of 6.3, the bending stress of Formula (1) in 6.2 and the storey estimate of 6.4. The measuring points, directions and report of 5.4, the pipeline notes of D.1 and the worked dwelling of D.2 are prose, set out in the measurement section.
- Deutsches Institut für Normung. (2005). Messung von Schwingungsimmissionen — Teil 2: Messverfahren (DIN 45669-2:2005-06). Where the transducers of a building measurement go and how they are set down: the foundation positions of 5.1.2, the measuring directions of 5.2, the loose-mounting limits of 5.3.2, the measurement time of 6.1, the check before use of 6.3 and the comparison with the source stopped of 7.2.2.