A vibration meter turns a
record into two numbers, the maximum weighted vibration severity KB_Fmax
and the clock maximum r.m.s. KB_FTm, and stops. DIN 4150-2 is where those
numbers are judged for the people who live or work where the vibration
arrives: a table of guide values by kind of area and time of day, a
procedure that reads them in a fixed order, and a set of rules for the
sources that most often shake a house, from a hammer in the workshop next
door to the railway at the end of the street.
It is not a standard of limits, and it says so. The guide values are “not to
be applied mechanically”, the annex that explains them calls them recommended
values rather than binding ones, and one of its own worked examples finds a
reading 13 % above the lower value and calls the requirement met, because a
measurement of KB_F is uncertain by about that much. What the standard does
fix is the procedure, and the procedure is what this page implements.
1. Two quantities, and the order they are read in
Section titled “1. Two quantities, and the order they are read in”KB_Fmax says how bad the vibration was at its worst. The assessment
vibration severity KB_FTr says what it added up to over the whole
assessment period, 16 h by day (6:00 to 22:00) and 8 h by night. Both are
formed for the three directions and the largest is assessed.
Clause 6.2 reads the guide values of Table 1 in a fixed order, which its Figure 2 draws as a flowchart:
KB_Fmaxat or below the lower valueA_u: the requirement is met, and nothing else is asked.KB_Fmaxabove the upper valueA_o: not met, however short the exposure.- In between: up to three short events a day are met as they are; anything
else is decided by
KB_FTragainstA_r.
from phonometry import vibration
guide = vibration.guide_values("commercial")print(guide)  # GuideValues(a_u=0.3, a_o=6.0, a_r=0.15, time_of_day='day', edition='1999')
# Annex C, Example 1: a sawmill's stationary 5 Hz vibration at KB_Fmax = 0.25.verdict = vibration.assess_people_in_buildings(0.25, guide)print(verdict.complies, verdict.criterion)  # True A_u
# Above A_o the question ends the other way, unless the events are rare.print(vibration.assess_people_in_buildings(6.5, guide).criterion)  # A_oblast = vibration.assess_people_in_buildings(2.0, guide, rare_short_events=True)print(blast.complies)  # True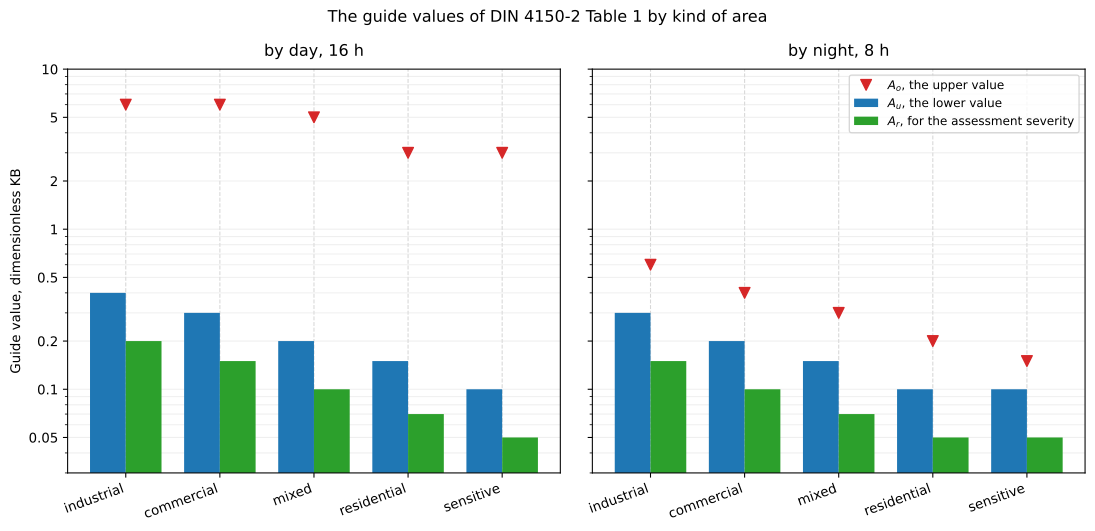
Figure code
import matplotlib.pyplot as pltimport numpy as np
from phonometry import vibration
areas = list(vibration.GUIDE_VALUES)x = np.arange(len(areas))fig, axes = plt.subplots(1, 2, figsize=(11.5, 5.6), sharey=True)for ax, time_of_day in zip(axes, ("day", "night"), strict=True):    values = [vibration.guide_values(a, time_of_day=time_of_day) for a in areas]    ax.bar(x - 0.19, [v.a_u for v in values], 0.38, label="$A_u$")    ax.bar(x + 0.19, [v.a_r for v in values], 0.38, label="$A_r$")    ax.plot(x, [v.a_o for v in values], "v", label="$A_o$")    ax.set_yscale("log")    ax.set_xticks(x, areas)    ax.set_title(time_of_day)axes[0].legend()
The verdict compares at the decimals the guide value is printed with, half
up as a hand rounds, because that is what the standard does: its Example 4
forms a KB_FTr of 0,154, writes it as 0,15 and finds it at the A_r of
0,15, met. And it follows Example 3 on a KB_Fmax above A_u by less than
the 15 % a measurement of KB_F is uncertain by: the requirement “can as a
rule still be regarded as met”, the standard concludes, and the verdict says
so, with within_uncertainty set for anyone who wants to read it more
strictly.
How the measurement goes
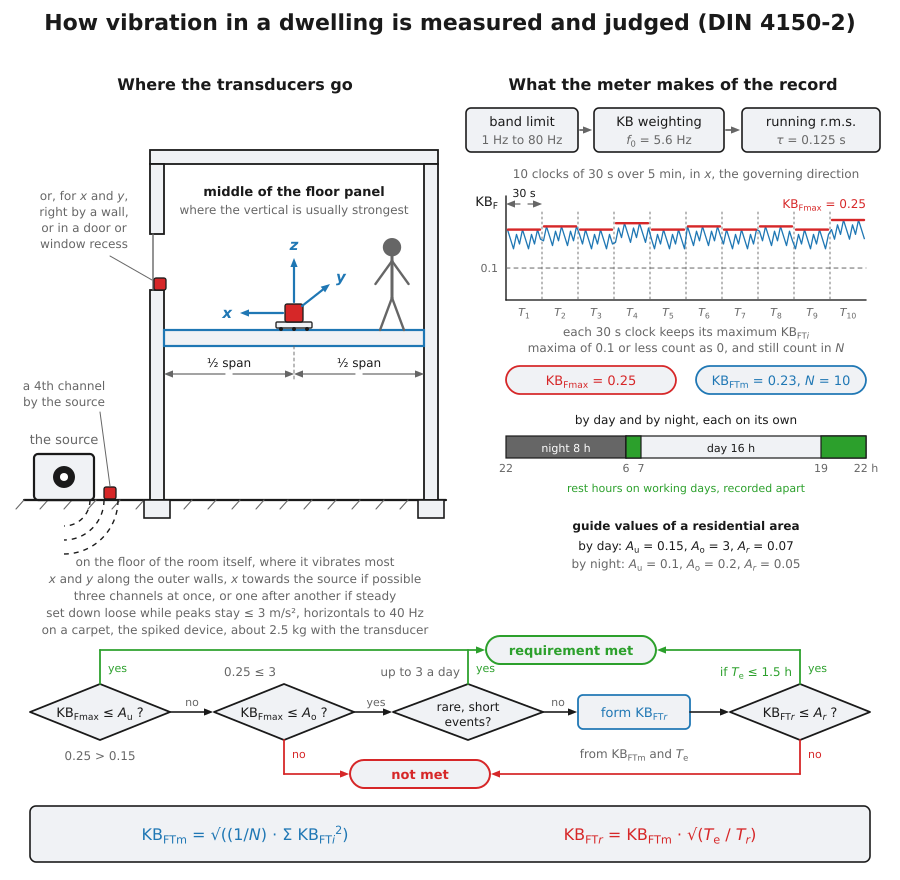
Section titled “How the measurement goes”Use a meter to DIN 45669-1, working from 1 Hz to 80 Hz, and check the chain
before and after measuring, with a calibrator, a tap test or the vibration
already there. Measure on the floor of the room itself, where the strongest
vibration is expected; for the vertical that is usually the middle of the floor
panel. Take z and two horizontals along the outer walls, x towards the
source where possible; the horizontals may also go by a wall or in a door or
window recess. Record the three at once, or one after another only when the
vibration is steady, with a fourth channel near the source to tell it from
other disturbances. Prefer a hard surface: set down loose, a transducer holds
while the peaks stay at or below 3 m/s², its horizontals only to 40 Hz, and on
a carpet it stands on the spiked device, about 2,5 kg with the transducer,
pressed and tapped through the covering. Measure long enough to capture the
characteristic exposure, mark an untypical state as such, and form KB_Fmax
and, where it is needed, KB_FTr separately by day and by night, recording the
rest hours apart. Clock maxima of 0,1 or less count as zero, because vibration
that weak is as a rule not felt, and the clock still counts in N. A
disturbance is kept out by interrupting the clock maxima, erasing at most the
running clock and the one before it, and is judged, where possible, with the
source running and stopped. The report names the institution and the person
responsible, the purpose, the date and measuring times, the sources and how
they ran, a site plan and the propagation conditions, the measuring and
immission point, the directions and the coupling, the meter with make, type and
number, its settings and the rest of the equipment, the quantities measured,
the disturbances and the subjective observations.
2. The assessment vibration severity
Section titled “2. The assessment vibration severity”KB_FTr is the clock maximum r.m.s. of each stretch of exposure, weighted by
the share of the assessment period it lasts for (Formula (4a); with one
stretch, Formula (4b)):
KB_FTr = √( (1 / T_r) · Σ_j T_e,j · KB²_FTm,j )A stretch that falls in the rest hours of the day, 6:00 to 7:00 and
19:00 to 22:00 on working days and the whole day on Sundays and public
holidays, carries the weight 2 (Formula (5)). Annex C works the same two forging hammers through
both formulas: hammer a) for 6 h at a KB_FTm of 0,16 and hammer b) for
1,5 h at 0,39, first with both outside the rest hours and then with hammer b)
moved into them.
from phonometry import vibration
hour = 3600.0hammers = [0.16, 0.39]hours = [6 * hour, 1.5 * hour]
# Annex C, Example 4: Formula (4a), both hammers outside the rest hours.kb_ftr = vibration.assessment_vibration_severity(hammers, hours)print(f"KB_FTr = {kb_ftr:.3f}")  # 0.154, which the standard writes as 0.15
# Example 5: hammer b) runs 19:00 to 20:30, in the rest hours, Formula (5).evening = vibration.assessment_vibration_severity(    hammers, hours, in_rest_time=[False, True])print(f"KB_FTr = {evening:.2f}")  # 0.20
guide = vibration.guide_values("commercial")print(vibration.assess_people_in_buildings(0.47, guide, kb_ftr=kb_ftr).complies)   # Trueprint(vibration.assess_people_in_buildings(0.47, guide, kb_ftr=evening).complies)  # False
The same formula turned around says how long a source may act before
KB_FTr reaches A_r, which is what Example 2 asks: the sawmill of Example 1
in a residential area instead, where A_r is 0,07, may run for 1,48 h of the
16 h day.
from phonometry import vibration
exposure = vibration.admissible_exposure_s(0.23, 0.07)print(f"{exposure / 3600:.2f} h")  # 1.48 h
3. The sources that have their own rules
Section titled “3. The sources that have their own rules”Clause 6.5 adds a rule per kind of source, and each is one argument:
- Rare short events, up to three a day, blasting among them:
KB_Fmaxis compared withA_oalone, whichrare_short_events=Trueasks for. Quarry blasting has more: blasts in immediate succession may count as one event, at most fifteen a week if they do; and blasts on working days with the neighbours warned, between 7:00 and 13:00 or 15:00 and 19:00, one a day, are held in a mixed or residential area to theA_oof an industrial one, 6, whichsource="quarry_blasting"asks for, with aKB_Fmaxof 8 allowed a few times a year in exceptional cases. - Road traffic uses the procedure as it stands, without the rest-time weighting.
- A railway is judged on
A_uandA_ronly, with the rest-time weighting not applied either, whichsource="railway"asks for;A_ois not a verdict for it, and 6.5.3.5 sets its own thresholds instead, a night-time clock maximum above 0,6 on a surface line or 0,3 underground being a reason to look into the cause, flat spots on wheels for one, and to put it right. An urban surface line, a tram, light rail or S-Bahn, getsA_uandA_rraised by the factor 1,5 withsource="urban_railway". A new line is held to Table 1; an existing one often exceeds it, and the standard leaves that case to judgement. - A construction site has its own Table 2, by how many working days it
shakes the neighbours and by the stage the operator is held to, stage I
below which no considerable annoyance is expected, stage II which needs the
measures of 6.5.4.3, and stage III above which the exposure is
unreasonable. The values for two to six days are interpolated between the
one-day column and the column that starts at seven, as Figure 3 draws them;
at night Table 1 applies; and the site’s blasting is held to an
A_oof 8.
from phonometry import vibration
for days in (1, 3, 6, 7, 30):    guide = vibration.construction_guide_values(days, stage="I")    print(f"{days:2d} working days: A_u {guide.a_u:.2f}, A_r {guide.a_r:.2f}")#  1 working days: A_u 0.80, A_r 0.40#  3 working days: A_u 0.67, A_r 0.37#  6 working days: A_u 0.47, A_r 0.32#  7 working days: A_u 0.40, A_r 0.30# 30 working days: A_u 0.30, A_r 0.20
urban = vibration.guide_values("residential", time_of_day="night", source="urban_railway")print(urban)  # GuideValues(a_u=0.15, a_o=0.2, a_r=0.075, time_of_day='night', edition='1999')
4. A railway, class by class
Section titled “4. A railway, class by class”The trains of a railway occupy a few clock intervals each and leave the rest
quiet, so Annex A forms KB_FTm for each class of train over the
intervals its trains occupied (Formula (A.1)), puts a standard deviation on
its square (Formula (A.2)), and weights each class in KB_FTr by the
intervals it occupies in the period, 1920 by day and 960 by night (Formula
(A.3)). Example 8 does it for a ten-minute record with three passages, the
third of which takes three intervals: the peak interval of each train is one
class and the two flank intervals of the third train another, extrapolated to
a day of 288 and 192 occupied intervals:
from phonometry import vibration
class_1 = [0.92, 0.6, 0.9]  # the clock maxima trains of class 1 occupiedclass_2 = [0.2, 0.24]
kb_ftm = [vibration.railway_takt_maximum_rms(c) for c in (class_1, class_2)]spread = [vibration.railway_takt_spread(c) for c in (class_1, class_2)]print([round(v, 2) for v in kb_ftm])  # [0.82, 0.22]
railway = vibration.railway_assessment_severity(kb_ftm, [288, 192], spread=spread)print(f"KB_FTr = {railway.kb_ftr:.3f}")  # 0.325print(f"  from {railway.lower:.3f} to {railway.upper:.3f}")  # 0.253 to 0.384
guide = vibration.guide_values("residential")verdict = vibration.assess_people_in_buildings(    0.92, guide, kb_ftr=railway.kb_ftr, source="railway")print(verdict.complies, verdict.criterion)  # False A_r
Annex D turns Formula (A.3) around into a figure: with one class of train and
each train occupying one clock interval, how many an hour keep KB_FTr at
A_r. It reads off 7 trains for the 0,05 of a dwelling at night and 14 for
the 0,07 of a mixed area, both at a KB_FTm of 0,2, and the formula behind
the figure is 120 (A_r / KB_FTm)².
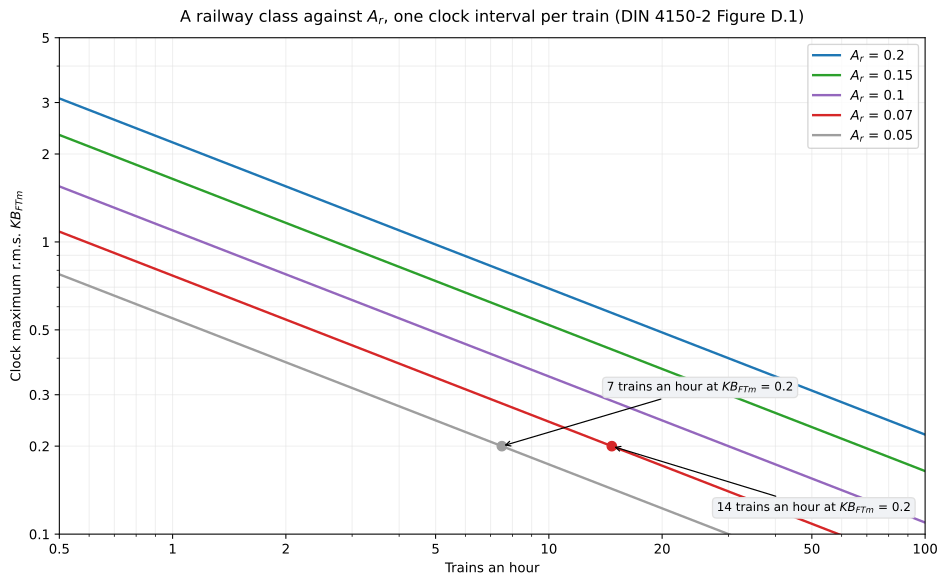
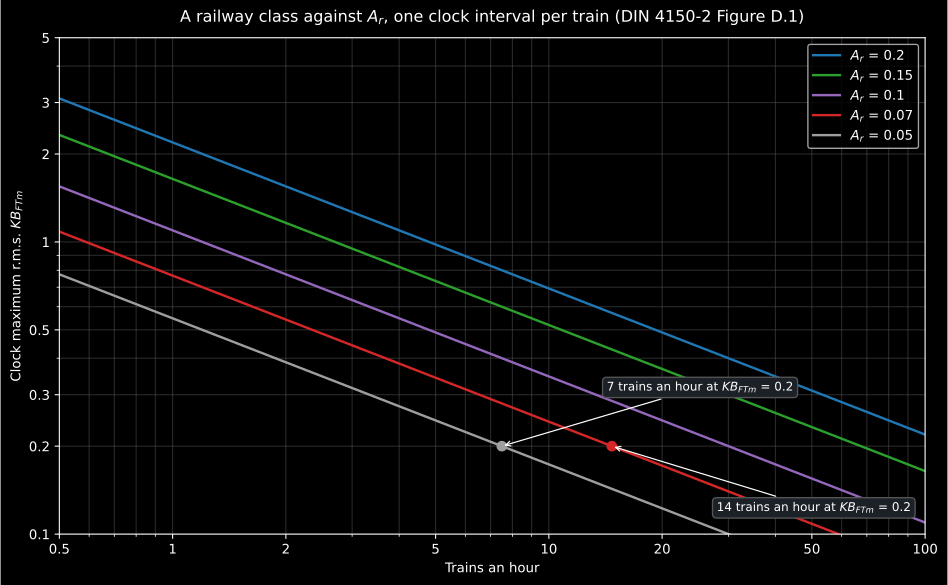
Figure code
import matplotlib.pyplot as pltimport numpy as np
from phonometry import vibration
trains = np.geomspace(0.5, 100.0, 200)fig, ax = plt.subplots(figsize=(10, 6.2))for a_r in (0.2, 0.15, 0.1, 0.07, 0.05):    ax.loglog(trains, a_r * np.sqrt(120.0 / trains), label=f"$A_r$ = {a_r:g}")for a_r in (0.05, 0.07):    n = vibration.admissible_trains_per_hour(0.2, a_r)    ax.plot([n], [0.2], "o")ax.set_xlabel("Trains an hour")ax.set_ylabel("$KB_{FTm}$")ax.legend()
from phonometry import vibration
print(int(vibration.admissible_trains_per_hour(0.2, 0.05))) # 7print(int(vibration.admissible_trains_per_hour(0.2, 0.07))) # 145. From an unweighted record
Section titled “5. From an unweighted record”Where only an unweighted velocity record exists, Clause 7 estimates KB_Fmax
from its peak and its frequency: Formula (6) is what the KB weighting would
leave of a sine of that peak, with the 5,6 Hz corner of the meter, and
Formula (7) scales it by an empirical factor of Table 3 for the kind of
vibration, 0,9 for a clean harmonic signal down to 0,6 for a single short
event with no resonance in the floor. The standard marks the result with an
asterisk because it is an estimate, and puts the factors at about 15 %
either way.
from phonometry import vibration
# Annex C, Example 7: a blast on a ceiling, 4 mm/s peak at 14 Hz.estimate = vibration.kb_fmax_from_peak_velocity(4.0, 14.0, kind="single_event_resonant")print(f"KB*_Fmax = {estimate:.1f}")  # 2.1, against an A_o of 3
6. A formula printed wrong
Section titled “6. A formula printed wrong”Formula (A.1b) prints KB_FTm,j equal to a mean of squares with no root over
it, while Formula (A.1a) beside it takes the root, Formula (A.2) beneath them
uses KB²_FTm,j for the mean square, and Example 8 applies (A.1b) with the
root. The library takes the root, the tests hold it to the example, and the
errata page has the reading.
7. The draft of 2023
Section titled “7. The draft of 2023”E DIN 4150-2:2023-08 is to replace this edition, and the library reads it
with edition="2023" on guide_values and assess_people_in_buildings.
It changes one cell of Table 1, the night A_u of a mixed area down to 0,1;
no longer excuses a KB_Fmax within the 15 % above A_u; compares a
railway with A_o and forms its numbers by category of train, with a
weighting factor per kind of train, and a road by night not; and adds an
existing road whose neighbours must put up with 50 % more, and an induced
seismic event held to the daytime A_o. The guide values carry the edition
they were read for and the verdict follows it. The railway and the rest of
the changes have
their own page.
from phonometry import vibration
print(vibration.guide_values("mixed", time_of_day="night", edition="2023"))# GuideValues(a_u=0.1, a_o=0.3, a_r=0.07, time_of_day='night', edition='2023')The guide values of Table 1 by area, time of day and kind of source, the procedure of Clause 6.2 as a verdict with the criterion that decided it, and the assessment vibration severity of Formulae (4a), (4b) and (5) with the exposure
A_rallows.The source rules of Clause 6.5: rare short events on
A_oalone, the railway onA_uandA_rwith the factor 1,5 of an urban surface line, and the construction site’s Table 2 by duration and stage with the interpolation of Figure 3.Annex A in full: the clock maximum r.m.s. of a class of train, the spread of its square, the assessment severity by classes and the interval the spread puts on it; and Figure D.1, trains an hour against
A_r. And Clause 7, the estimate ofKB_Fmaxfrom a peak velocity with Table 3.Not covered
No judgement of the cases the standard leaves open. An existing railway line, a construction site beyond 78 working days, a hospital next to one, and whatever 6.2 sends to an individual assessment are decided case by case in the standard, and are not decided here.
The measurement is described, not checked. Where the transducers go, how they are coupled and how long a measurement runs are Clause 5 and DIN 45669-2, set out above for the person measuring. Of all that, the library puts a number only to the loose-mounting limits, the wax limit of Table 1 and the mass loading of 7.2.4, on the meter’s page; the quantities themselves come from the meter of DIN 45669-1, which forms them from a record.
What this guide covers
Section titled “What this guide covers”References
Section titled “References”- Deutsches Institut für Normung. (1999). Erschütterungen im Bauwesen — Teil 2: Einwirkungen auf Menschen in Gebäuden (DIN 4150-2:1999-06). The assessment quantities of Clause 6.1, the procedure of 6.2 with Figure 2, the guide values of Table 1, the assessment vibration severity of Formulae (4a), (4b) and (5), the source-specific rules of 6.5 with Table 2 and the interpolation of Figure 3, the estimate of Clause 7 with Formulae (6) and (7) and Table 3, and Annex A with Formulae (A.1) to (A.4). Annex C is the oracle of the conformance rows. Clause 5 on the measurement and the report of Clause 8 are text, set out in the measurement section.
- Deutsches Institut für Normung. (2005). Messung von Schwingungsimmissionen — Teil 2: Messverfahren (DIN 45669-2:2005-06). The measurement section: the floor positions of 5.1.3, the directions of 5.2, the couplings of 5.3.2 and 5.3.3 with Table 1, the measuring time of 6.1, the disturbances of 7.2.2 and the report of Clause 9. The loose-mounting limits, the wax limit and the mass loading are implemented on the meter's page; the rest is text.
- Deutsches Institut für Normung. (2010). Messung von Schwingungsimmissionen — Teil 1: Schwingungsmesser — Anforderungen und Prüfungen (DIN 45669-1:2010-09). The meter whose KB_Fmax and clock maxima this standard assesses, and the corner frequency of 5,6 Hz that Formula (6) carries. The three simultaneous channels and the fourth near the source of 5.1.2, the interruption and back-erasure of the clock maxima of 5.1.6.4, and the check before a measurement of 6.5.