Predicting a building's own frequency
Standards: ISO 4866
Vibration damage to structures reads a measured velocity against a guideline value that depends on frequency, and in the topmost floor plane it stops depending on frequency because the building is answering at its own. Both readings assume you know roughly where that own frequency is. This page is what ISO 4866 says to do when you cannot measure it.
Measure it if you can: that is the main body of the standard and it comes first. Annex D is the fallback, for when a direct measurement cannot be made, or high damping, subcomponent resonances or other practical problems limit how useful it is. It offers four predictors and is candid about every one.
1. Four predictors, and what they are made of
Section titled “1. Four predictors, and what they are made of”The simplest counts storeys. hertz, which is the same rule
DIN 4150-3 prints in its 6.4 and this library already publishes as
storey_fundamental_frequency; here it is the "storeys" model, so the
four predictors can be compared through one entry point.
The other three are the shapes the period takes in national codes, each with a coefficient the codes disagree about:
with the height and the width parallel to the force, both in metres. The first knows only how tall the building is. The second adds how wide it is, which is what actually resists the sway. The third adds a slenderness factor, , which is always below 1 and so shortens the period relative to the second form. It shortens it least for a tall narrow building, where the factor approaches 1, and most for a squat wide one.
D.2 prints a range for each coefficient rather than a value: 0,014 to 0,03
for , 0,087 to 0,109 for , 0,06 to 0,08 for . The range is the
spread across the codes it collected them from, and the annex offers no way to
choose inside it, so fundamental_period takes the midpoint unless you name a
coefficient.
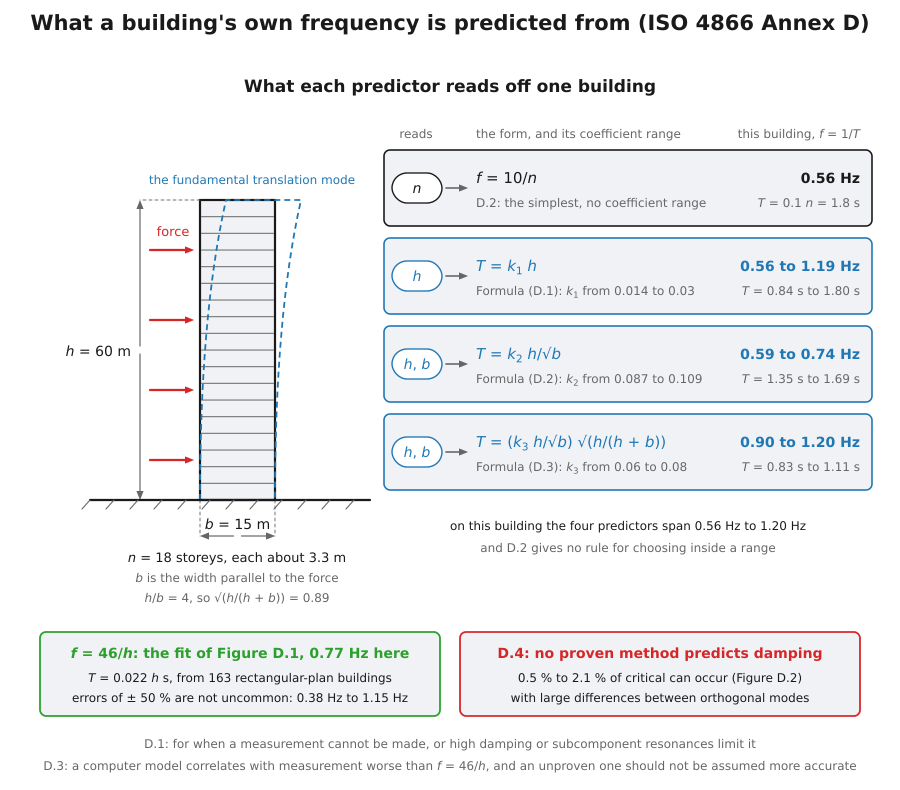
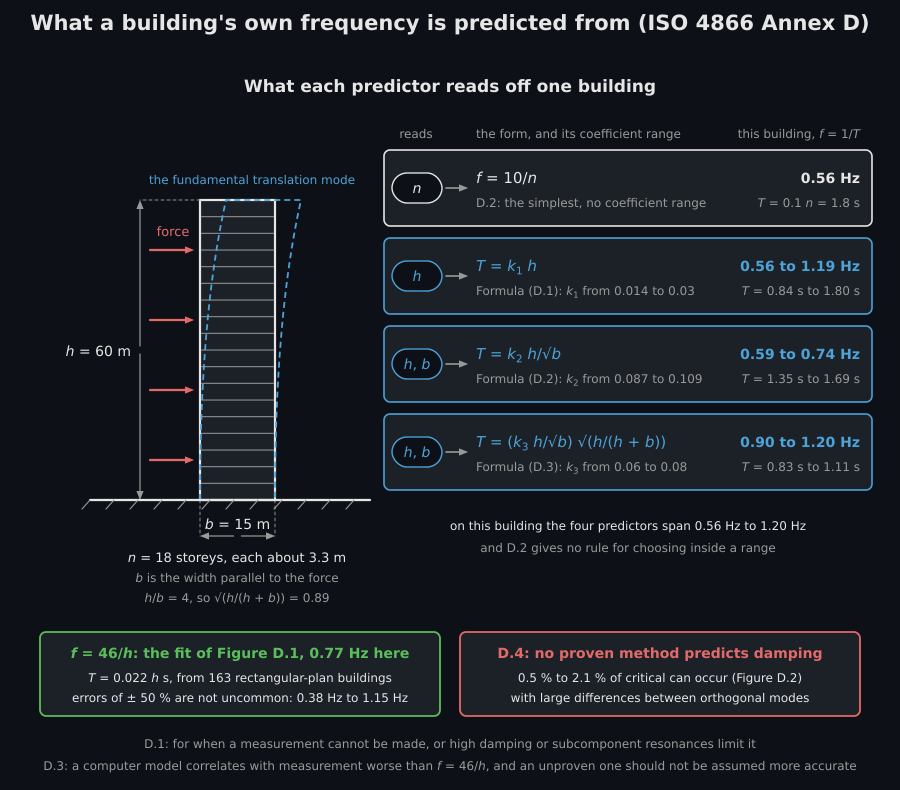
The building the code below describes twice, and what each predictor takes from it. The three code forms give a period and a range for its coefficient, so on one building they give a span, not a frequency; the fit to measurement gives one value with errors of ± 50 % not uncommon around it, and damping has no proven method at all.
The four predictors take different arguments, so comparing them means describing the same building twice: eighteen storeys at a shade over three metres each is the sixty metres the other three are given.
from phonometry import vibration
# The same sixty-metre building, fifteen wide, by each of the four predictors.for model, kwargs in (    ("storeys", {"storeys": 18}),        # 18 storeys, about 3.3 m each    ("height", {"height_m": 60.0}),    ("height_width", {"height_m": 60.0, "width_m": 15.0}),    ("slenderness", {"height_m": 60.0, "width_m": 15.0}),):    f = vibration.fundamental_frequency(model, **kwargs)    print(model, round(f, 2), "Hz")# storeys 0.56 Hz / height 0.76 Hz / height_width 0.66 Hz / slenderness 1.03 Hz
2. The fit to measurement, and the error it admits
Section titled “2. The fit to measurement, and the error it admits”D.2 closes by leaving the codes aside and fitting one curve to data: 163 rectangular-plan buildings give hertz, equivalently seconds. Two things about that line are worth carrying away.
The first is quiet and this library pins it with a test: 0,022 is also the middle of the range the codes span. The oldest and crudest of the code forms, taken at the centre of its spread, is the measured fit.
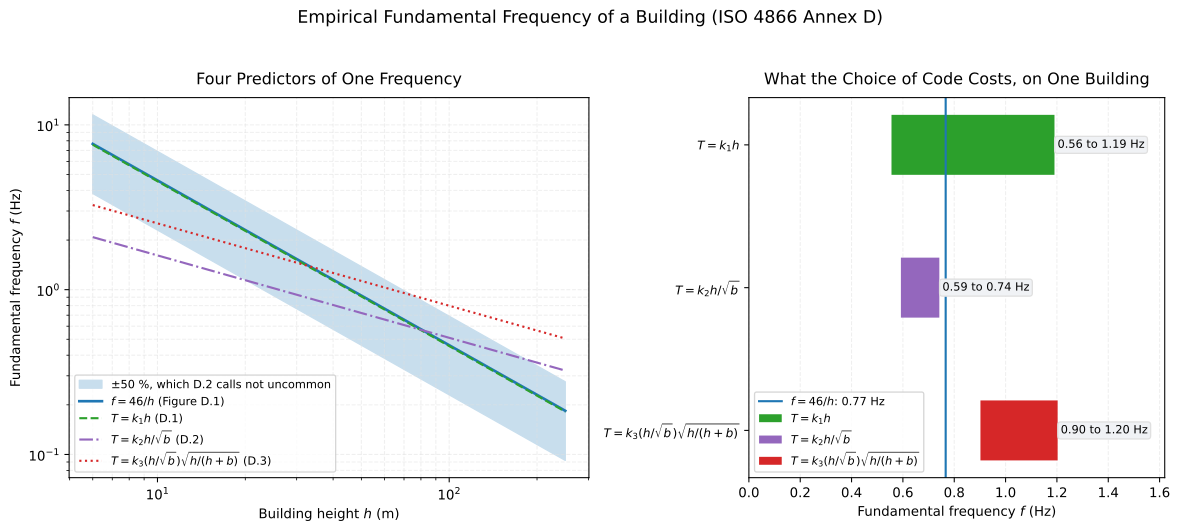
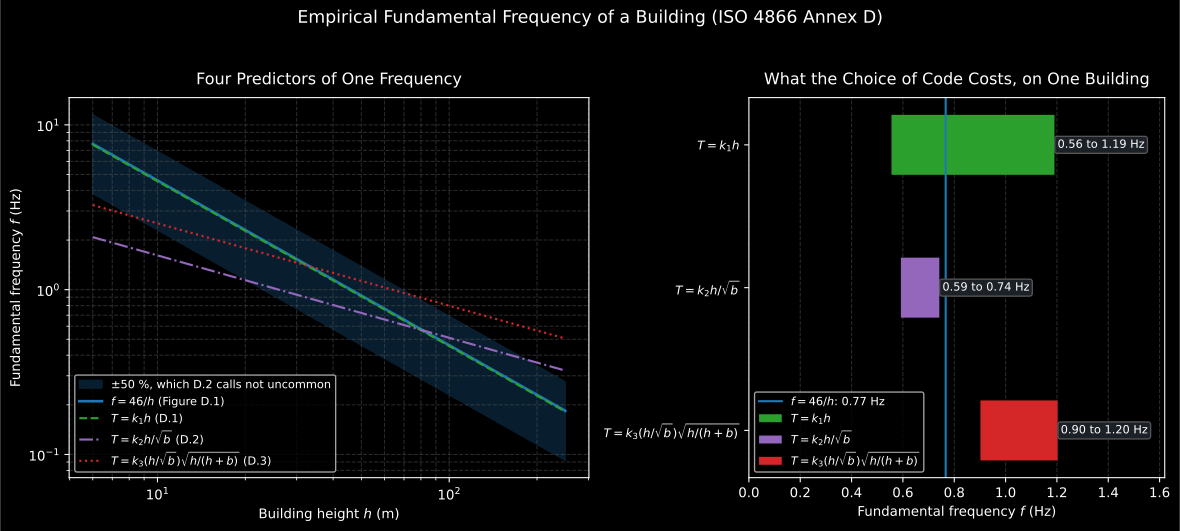
The second is the annex being honest about accuracy. Around that line, errors of ± 50 % are not uncommon, and D.2 says this is typical of what an empirical formula can do. D.3 then says something a reader does not expect: the correlation between computed frequencies, from a standard structural model, and measured ones is worse than the correlation with , because a model is only as good as its idea of what the building is made of.
Show the code for this figure
import matplotlib.pyplot as pltimport numpy as npfrom phonometry import vibration
heights = np.logspace(np.log10(6.0), np.log10(250.0), 300)fit = np.asarray(vibration.height_fundamental_frequency(heights))
fig, ax = plt.subplots()ax.fill_between(    heights,    fit * (1.0 - vibration.EMPIRICAL_FREQUENCY_TOLERANCE),    fit * (1.0 + vibration.EMPIRICAL_FREQUENCY_TOLERANCE),    alpha=0.2,    label=r"$\pm$50 %",)ax.loglog(heights, fit, label="$f = 46/h$")
# The three code forms over it, for a building four times as tall as it is# wide, which is what makes them comparable on one axis.for model in ("height", "height_width", "slenderness"):    values = [        vibration.fundamental_frequency(            model,            height_m=float(h),            **({} if model == "height" else {"width_m": float(h) / 4.0}),        )        for h in heights    ]    ax.loglog(heights, values, "--", label=model)
ax.set(xlabel="Building height $h$ [m]", ylabel="Fundamental frequency $f$ [Hz]")ax.grid(True, which="both", alpha=0.3)ax.legend()plt.show()
# One estimate, drawn on the same line with its band:res = vibration.estimate_fundamental_frequency(    "height_width", height_m=60.0, width_m=15.0)print(round(res.frequency_hz, 2), tuple(round(b, 2) for b in res.bounds_hz))# 0.66 (0.33, 0.99)res.plot()plt.show()
The predictors against each other. The height form sits on the measured fit because the middle of its coefficient range is the fit’s own coefficient. The right panel is the cost of the choice: on one building, picking a code rather than a formula moves the answer by a factor of two.
3. Damping, which nothing predicts
Section titled “3. Damping, which nothing predicts”D.4 is short and the shortness is the message. No proven method of predicting damping exists. What the annex reports is measurement: between 0,5 % and 2,1 % of critical on ten buildings where soil-structure interaction was negligible, with the two orthogonal translation modes of the same building often far apart. Damping is partly a function of construction procedure and workmanship, so anticipate large errors.
from phonometry import vibration
low, high = vibration.DAMPING_RATIO_RANGEprint(f"{100 * low:g} % to {100 * high:g} % of critical")   # 0.5 % to 2.1 %
The library publishes the range and no estimator, which is the honest shape of D.4: a number to sanity-check a measured decay against, not one to assume.
What this guide covers
Section titled “What this guide covers”Covered
The four empirical predictors of Annex D: the storey rule of D.2, the three code forms (D.1), (D.2) and (D.3) with the coefficient ranges D.2 prints for each, and the fit D.2 closes with, as frequencies or as periods.
The error those predictions carry: the ± 50 % band of D.2, published as a constant and as bounds around any prediction.
The damping range measured in D.4, as a range and not as an estimator, because the annex offers none.
Not covered
Nothing here measures a frequency. The main body of ISO 4866, which is the measurement this annex is the fallback for, is not implemented: no transducer requirements, no data acquisition, no modal extraction from a measured response.
The classifications are not here. Annex B classifies buildings, foundations and soils into the groups and classes that decide what tolerance a structure gets, and Annex A gives ranges of structural response; both are described in the standard and neither is implemented. Annex E, the vibrational interaction of a foundation with the soil, is likewise out.
No computer model. D.3 names the ESDU methods for core, shear and frame buildings, and says a method not calibrated against reliable experimental data should not be assumed more accurate than the empirical predictors. None of them is implemented here, and this page is not a substitute for one.
References
Section titled “References”- International Organization for Standardization. (2010). Mechanical vibration and shock — Vibration of fixed structures — Guidelines for the measurement of vibrations and evaluation of their effects on structures (ISO 4866:2010). Annex D: the storey rule and the three code forms of D.2 with their coefficient ranges, the f = 46/h fit D.2 closes with and the ± 50 % accuracy it admits, and the measured damping values of D.4. The building and foundation classification of Annex B and the response ranges of Annex A are described here and not implemented.