Importing
Five dashboards, all in English, all in Grafana’s shareable export format: the
datasource is a ${DS_...} placeholder and the __inputs block asks the
importer to choose their own.
| File | Panels | Store |
|---|---|---|
ghchronicle- | 154 | InfluxDB 3, queried with SQL |
ghchronicle- | 154 | Prometheus |
ghchronicle- | 154 | PostgreSQL or TimescaleDB, from the sink that connects or the SQL file |
ghchronicle- | 154 | Graphite, from the Graphite sink |
ghchronicle- | 154 | Elasticsearch or OpenSearch, from the Elasticsearch sink |
The five hold the same panels in the same order. What differs is how many of them the store behind each one can answer.
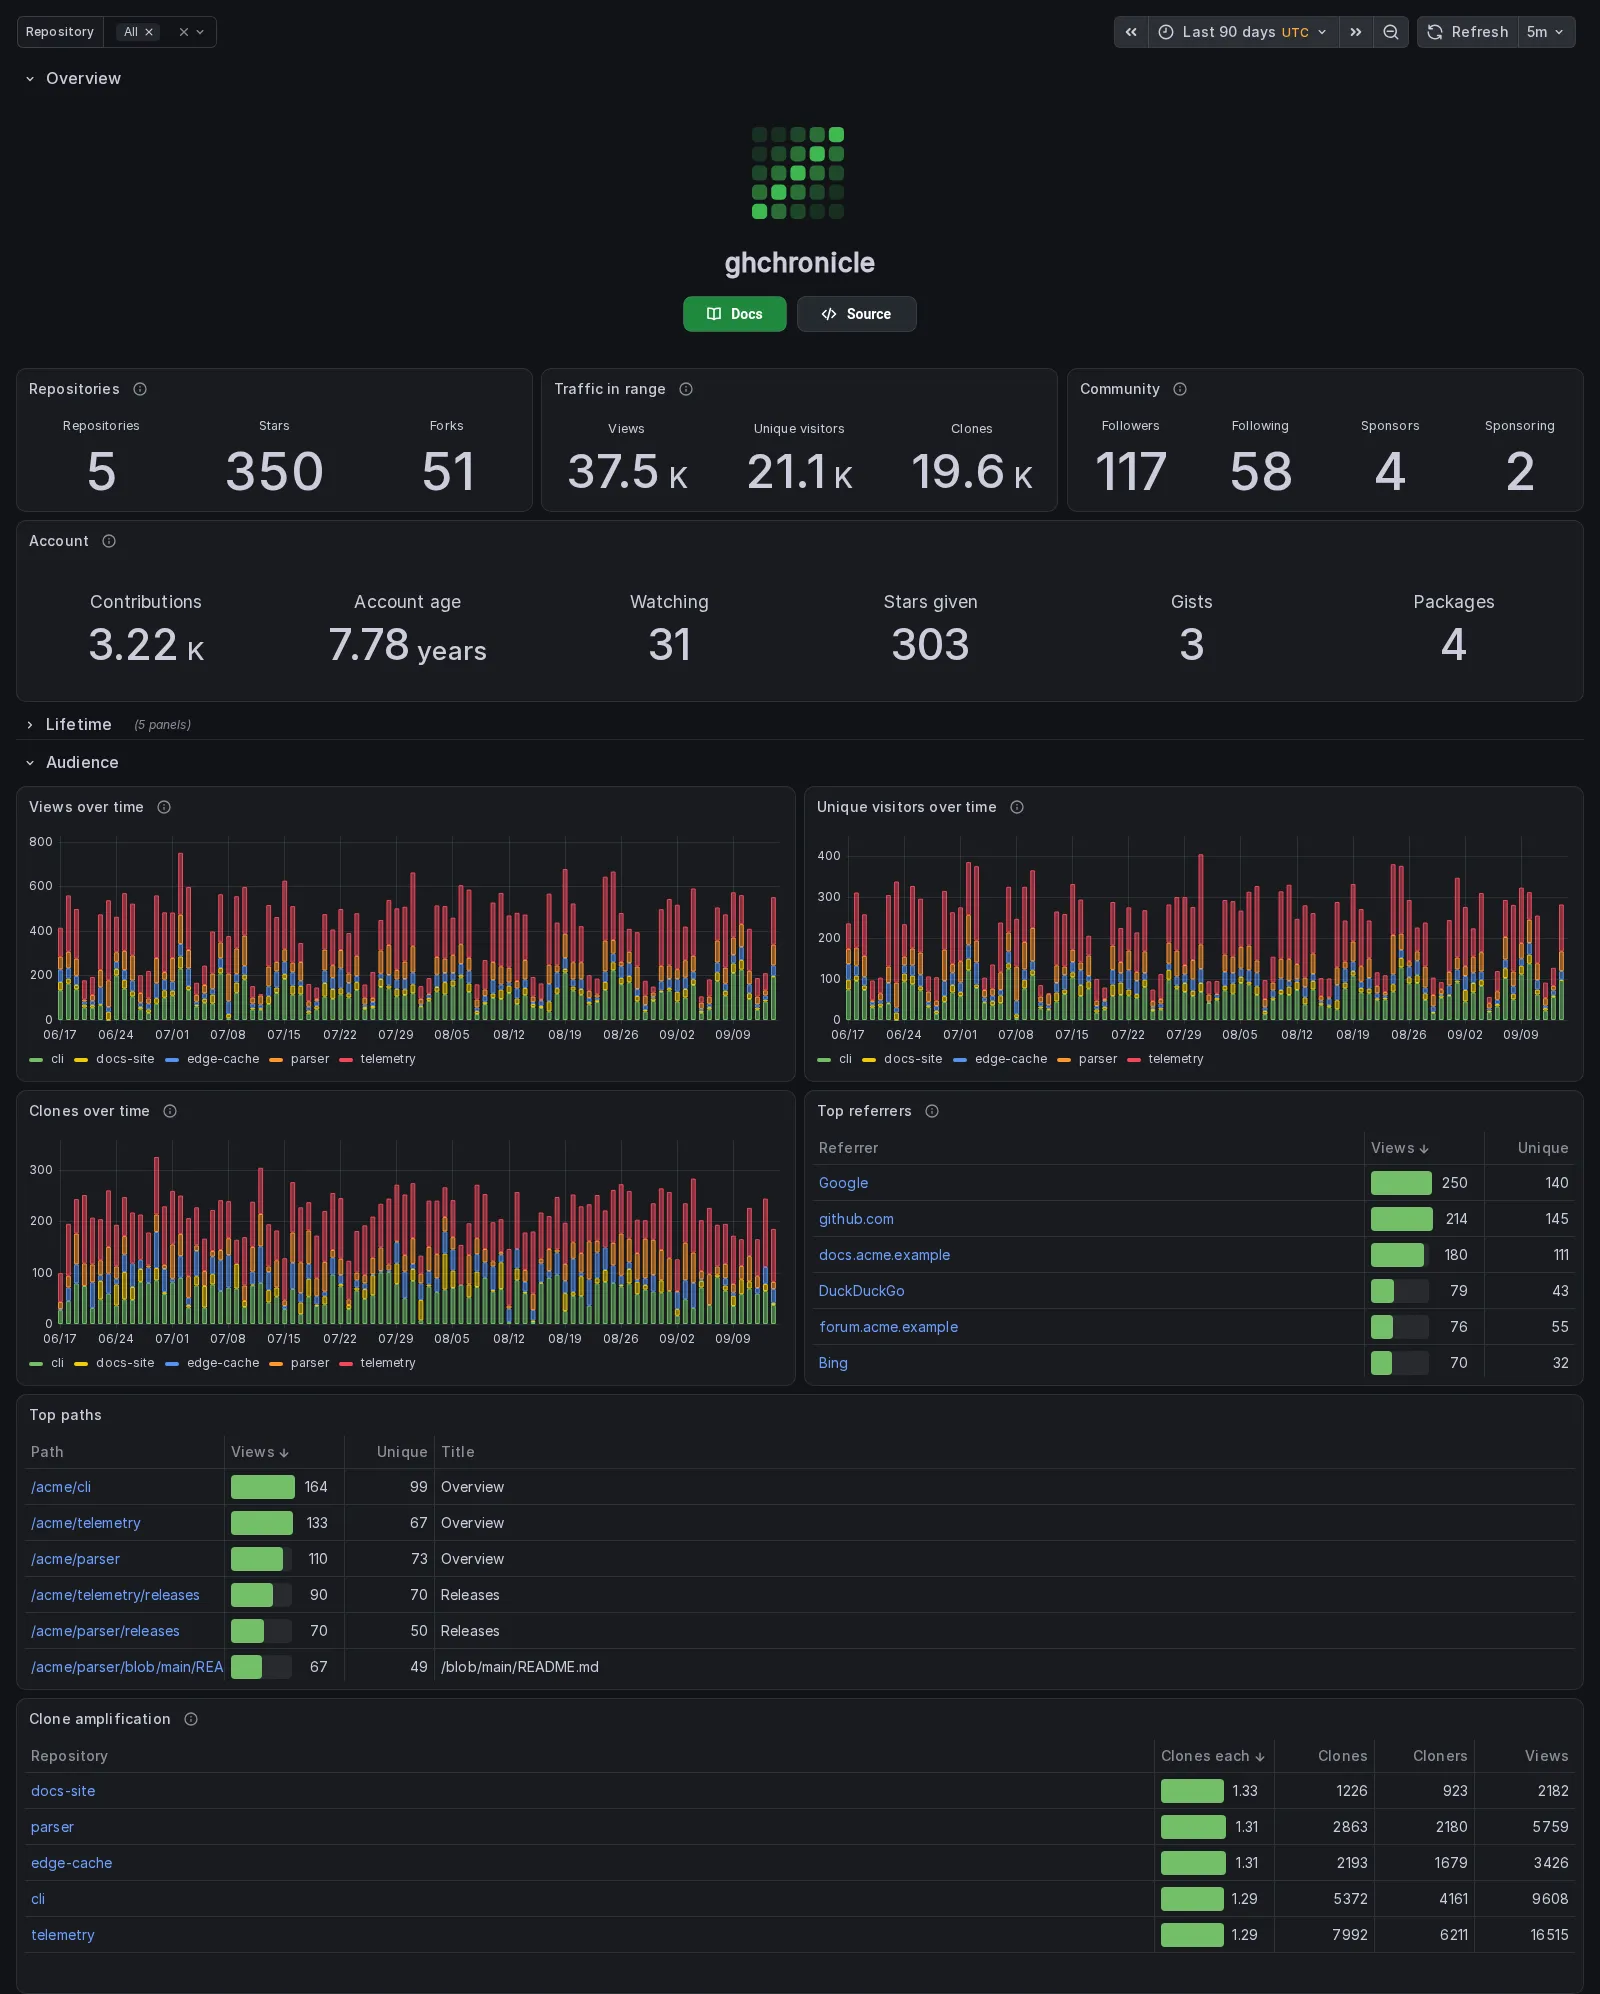
The account in that capture is the invented one every capture in this
documentation uses, acme and five repositories, described beside what the
panels show. Every section but the Overview
ships collapsed, which is why Lifetime is a header there.
Letting the binary do it
Section titled “Letting the binary do it”The dashboard is built from the same code the binary carries, so the binary can publish it. Given a Grafana, it reconciles the datasource out of the sink it already writes to, asks that datasource whether it can actually be reached, and publishes the dashboard for every store it writes to.
grafana: url: http://localhost:3000 token: ${GRAFANA_TOKEN}ghchronicle -config config.yaml -publish-dashboardIt asks GitHub nothing, so it needs no GitHub token, and it prints what it did to each datasource and each dashboard.
Three of the five sinks describe their own datasource with nothing else said, because what they write to is what Grafana queries: InfluxDB, Elasticsearch, and the PostgreSQL sink that connects, whose DSN carries the server, the database, the user and, when the DSN itself writes one, the password.
Two more need the address and nothing else, because they write somewhere that is not where a query goes: the Prometheus sink is scraped rather than written to, and the Graphite sink speaks the ingest port while Grafana asks the web API on another port. Give those the address and the datasource is made the same way:
grafana: datasource: url: http://prometheus:9090What cannot be described at all is the SQL sink, the one that writes statements to a file: it never connects, so no host, port, user or password exists anywhere in its config. That one, and any datasource you would rather manage yourself, is named instead:
grafana: datasource: uid: ae3x9k2A datasource named that way is adopted and left exactly as it is, since correcting one this did not make would overwrite settings nobody asked it to have.
publish_on_start: true does the same once when the collector starts, before
the first sweep. It is off by default, and it is what keeps a server from
quietly falling behind the binary feeding it: the dashboard is generated from
the code, so updating the binary updates the dashboard. A failure there warns
and the sweep goes on, because the metrics of an hour spent not running cannot
be recovered and a dashboard published on the next restart can.
What it makes, and under which names
Section titled “What it makes, and under which names”Nothing here is assigned by Grafana, so there is nothing to read back out of it and write into your config. Both uids are worked out from the store’s name, and the same run twice writes to the same two places:
| Store | Dashboard uid | Its datasource |
|---|---|---|
influxdb | ghchronicle-influxdb | made, from the sink |
elasticsearch | ghchronicle-elasticsearch | made, from the sink |
postgres | ghchronicle-postgres | made, from the dsn |
prometheus | ghchronicle-prometheus | made, once you give the address |
graphite | ghchronicle-graphite | made, once you give the address |
A datasource this makes takes the dashboard’s uid, so both are
ghchronicle-<store>, and one you name yourself keeps whatever uid it has.
A Loki datasource, when the sink’s address explains where to find one, is
ghchronicle-loki, unless Grafana already has a Loki datasource at that
address and the sink has no tenant_id: that one is adopted and left as it
is, since a Loki datasource with no tenant is its address and nothing else.
With a tenant it is always made, because the tenant travels in a secret
Grafana never hands back.
The datasource is created the first time and corrected afterwards, and only the fields this writes are compared, so a timeout or a description you set on it yourself is left alone. One carrying a credential is written on every run, because Grafana reports which secrets are set and never their values: a token you rotate in the config cannot be seen from the outside, and writing it is the only way to be sure the datasource is not still using the old one.
The dashboard is published with overwrite, so the second run updates the first
rather than adding another. That is what makes publish_on_start safe to leave
on.
A run also names what it finds under a uid it no longer writes to. Changing which store the collector feeds is the case that leaves one: the old store’s dashboard and datasource stay where they are, pointing at something nobody fills, and the new store’s uid is a different string, so nothing overwrites them. The note says which uid and which store, and stops there. Deleting a dashboard unasked is not something a collector should do, even one it made: it may be the copy still being read, or one edited since.
If the dashboard is already somewhere else
Section titled “If the dashboard is already somewhere else”Importing the JSON through the UI keeps the uid the file carries, so a dashboard imported that way is the one this writes over and there is nothing to do. It is only different if Grafana was asked to import it as new, or if the uid was changed by hand: then the generated uid is free, a publish makes a second dashboard beside the one being looked at, and the one open stops being the one updated. Name the existing one and it is written instead:
grafana: dashboard_uid: my-existing-dashboardTaking it all away again
Section titled “Taking it all away again”-uninstall removes what this put in place, and only that. It takes the list
of what to remove, and without -yes it removes nothing and prints what it
would, because the alternative is one typed command that empties a store.
ghchronicle -config config.yaml -uninstall all # says what would goghchronicle -config config.yaml -uninstall all -yes # and then goes| Target | What goes |
|---|---|
dashboard | The dashboards it published, and the datasources it created |
data | Every table in the store whose name starts with gh_ |
state | The state file, the dedupe ledger, the cache, the backfill and refill checkpoints and the lock file beside the state file |
all | The three above |
With -yes, data and state take the lock beside the state file first, and
refuse, naming the process, while the service or a -migrate -yes holds it:
what they remove is what that process goes on writing, and the lock file is
among the state files, so removed under a running service it would let the
next -migrate -yes run beside it.
A datasource named in grafana.datasource.uid or grafana.datasource.loki_uid
is never removed, and neither is a Loki datasource it adopted: each was
somebody else’s before this ran and stays theirs. A target it does not
recognise is refused whole, rather than the rest of the list being carried out
without it.
The tables are asked of the store rather than compiled in. A list inside the binary would be the measurements this version writes, and the ones worth removing are exactly the ones nobody writes any more: what an older version collected, or a family switched off since. Asking finds those.
Not every store can be emptied from here, and the ones that cannot say why rather than staying silent, which would read as nothing to remove. Graphite offers no delete, so its whisper files go by hand. The Prometheus sink is scraped rather than written to, so nothing was stored to remove. The SQL sink’s file is removed, but rows already loaded from it into a real database were loaded by you and have to go there: this sink emits statements and never connects.
Importing from the UI
Section titled “Importing from the UI”-
In Grafana, go to Dashboards, then New, then Import.
-
Upload the
ghchronicle-<store>.jsonfor the store you are using. -
Choose the datasource Grafana asks for.
The InfluxDB 3 datasource for the database the sink writes to, in SQL mode.
The Prometheus that scrapes ghchronicle’s exporter.
The PostgreSQL datasource for the database the
postgressink writes to, or the one the SQL sink’s statements were piped into. TimescaleDB is the same datasource with the TimescaleDB switch on; the queries do not change.The Graphite the sink writes to. The paths assume the default prefix,
github, and the functions need Graphite 1.1 or later.An Elasticsearch datasource whose index pattern is
ghchronicle-*and whose time field is@timestamp. One datasource serves every panel, because each target names its own index in the query. OpenSearch works through the same plugin.
Importing with the API
Section titled “Importing with the API”Name the input the file declares:
curl -X POST -H "Authorization: Bearer $TOKEN" -H "Content-Type: application/json" \ -d "{\"dashboard\": $(cat ghchronicle-influxdb.json), \"inputs\": [ {\"name\":\"DS_INFLUXDB\",\"type\":\"datasource\",\"pluginId\":\"influxdb\",\"value\":\"<uid>\"}], \"overwrite\": true}" \ "$GRAFANA/api/dashboards/import"The inputs are DS_INFLUXDB (influxdb), DS_PROMETHEUS (prometheus),
DS_POSTGRES (grafana-postgresql-datasource), DS_GRAPHITE (graphite) and
DS_ELASTICSEARCH (elasticsearch).
The uid
Section titled “The uid”Each file carries a fixed uid (ghchronicle-<store>). That is deliberate for
a repository import, where a stable uid means a stable URL and a re-import
updates in place rather than duplicating. Importing two of these into one
Grafana is fine, because the uids differ per store and cannot collide.
They are generated, never hand-edited
Section titled “They are generated, never hand-edited”One list of sections and panels produces all five, so a panel that is fixed is
fixed everywhere and a store that is added inherits the lot. What that means
for you is the part worth knowing: a dashboard edited in Grafana is yours until
the next publish overwrites it, so keep changes in a copy under a uid of your
own and name it in grafana.dashboard_uid.
How the generator works, and the checks that keep the committed files and the panels’ own queries in step, are in CONTRIBUTING.
Publishing to the Grafana directory
Section titled “Publishing to the Grafana directory”The files are already in the shape the directory requires: __inputs declares
the datasource the importer must choose, __requires names the Grafana version
and the plugin, and there is no id key, which the directory assigns on
publication.
Keep the listing names distinct, because five dashboards with the same title are indistinguishable in search results: “ghchronicle for InfluxDB”, “ghchronicle for Prometheus”, “ghchronicle for PostgreSQL and TimescaleDB”, “ghchronicle for Graphite”, “ghchronicle for Elasticsearch and OpenSearch”.
Publishing again against the same listing adds a revision rather than replacing it, so a regeneration that changes panels is a new revision of the same five listings, not five new listings.
That is what a reader needs to know. The step by step, with the listing names,
what each screenshot should show and what to do when a revision is rejected, is
a maintainer’s task and lives in
dashboards/PUBLISHING.md
in the repository.