Idle baseline
In short: on the reference RB5009 at idle, the four cores sit at 6–8 % busy,
time_squeeze is never zero (about 200 per 20 s), and the kernel log is silent.
Read every other case study against that shape: a steady stream of kernel events
at idle is the anomaly, and a nonzero squeeze on its own is not.
Measured on RB5009UG+S+ · 4 × 1.4 GHz Cortex-A72 · RouterOS 7.24.2 · Linux 5.6.3 · · agent at 10 Hz in an ephemeral privileged container
Recording
Section titled “Recording”Three 20-second buckets:
t busy% per-core busy% ctxt sirq squeeze temp MHz events 0 7.1 10.5 7.9 4.3 5.8 41793 325 296 36.2 1400 0 1 8.4 8.0 7.8 9.9 7.8 60518 251 223 36.2 1400 0 2 6.5 7.1 5.2 6.7 6.8 58259 199 179 36.3 1400 0The percentages were computed afterwards from the raw tick deltas the agent
ships; the agent never turns them into percentages. This reading has no chart:
it predates the history of the reference InfluxDB store, which begins on
2026-09-19. The recorded chart below is a later record of
the same router at rest.
What to look at
Section titled “What to look at”- 6–8 % busy across four cores is this router’s floor, not a problem. It is DNS, DHCP, WireGuard, the bridge and its own housekeeping.
time_squeezeis never zero (~200 per 20 s). A nonzero squeeze is normal; what matters is the change under load, which the packet flood shows. Alerting on “squeeze > 0” would page you forever.arch_timerandswitch0are always the top two interrupt sources.- Zero kernel events is the healthy state. Any steady stream of
eventsat idle deserves the treatment in the loop case study: that is how it started.
Background squeezes
Section titled “Background squeezes”The squeeze floor was measured again in the 24 h to 2026-09-16 07:00 UTC, on the same device, over 3 738 704 per-CPU samples:
- about 11.2 % of samples carry one squeeze as background;
- 1.2 % carry exactly two;
- 0.21 % carry exactly three.
On this router on 2026-09-15, a rule that flagged any squeeze fired 92 times in twenty minutes, and meant nothing.
So the collector’s burst flag is a deviation from the device’s own norm. It
flags a sample whose packet count was at or below its trailing median and that
has either:
- a dropped packet, or
- more squeezes than that CPU usually has: above its trailing 90th percentile and at least 3.
The trailing baselines span ten seconds of wall clock at any rate. Three flagged
samples on one CPU within 60 s raise the microburst detection; one flagged
sample stays a data point.
Recorded chart
Section titled “Recorded chart”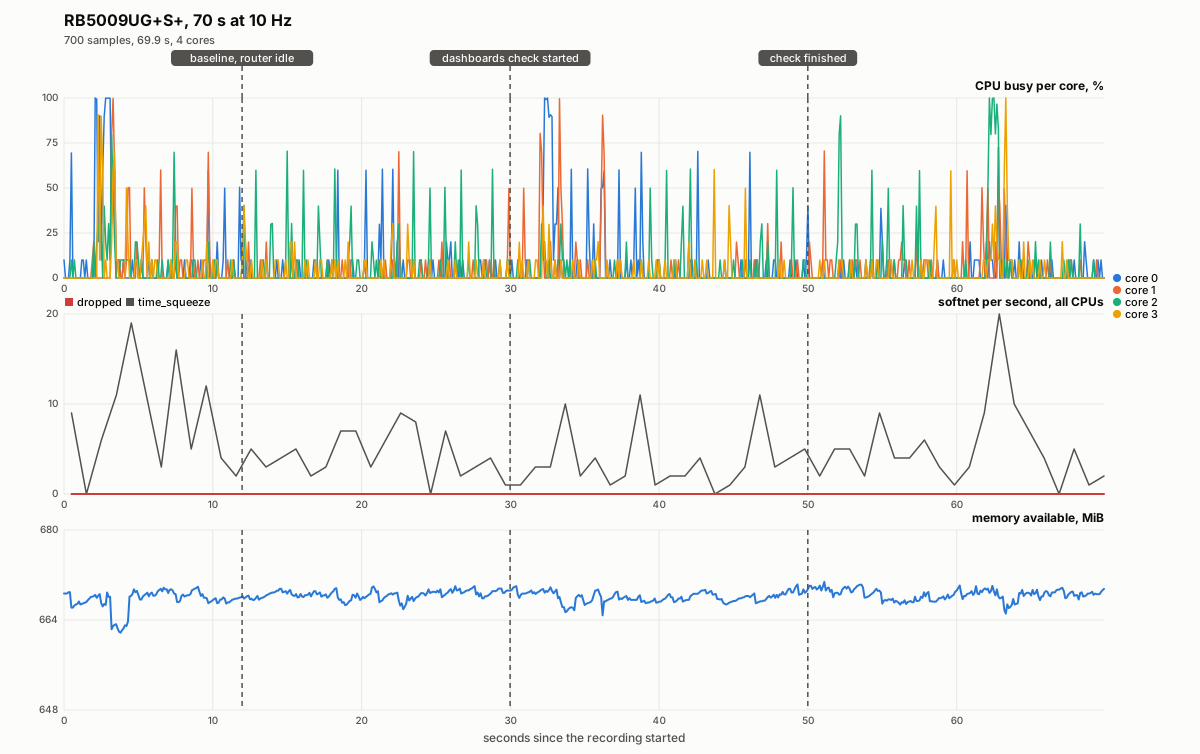
Open the chart at full size (SVG, 1200 × 754) to read its labels on a phone.
Measured on RB5009UG+S+ · 4 × 1.4 GHz Cortex-A72 · RouterOS 7.24.2 · · a 70 s record at 10 Hz, 700 samples over 69.9 s, the router otherwise at rest, three notes typed into record's terminal
This is a real recording of a router at rest, the shape everything else is read against. The three
dashed lines are the notes typed into record’s terminal during it; the chips carry them in full
because they fit, and a longer one is shortened rather than laid over the next.
- t = 12 s,
baseline, router idle. Nothing is happening, and the panels say so: every core averages under 10 % over the whole recording, and over the quiet stretch that follows this note the four together average 3.9 %. - t = 30 to 50 s, between
dashboards check startedandcheck finished. A browser loading the two Grafana dashboards against this router’s own collector. The four cores together average 5.0 % over that stretch, and the work arrives in two short bursts right after the note: core 0 at or above 50 % for 0.6 s from 32.3 s, and again for 0.3 s at 33.2 s. - The work is in short excursions. 76 of the 700 samples have a core at or above 50 %, in 46 separate stretches; 38 of those are one sample long, and the longest is 1.4 s, at the start of the recording and before the first note. The kernel’s scheduler puts each excursion on whichever core is free. One isolated sample — one core at 100 % for 100 ms — moves a four-core, one-second average by 2.5 %.
- softnet:
droppedflat at zero,time_squeezebetween 0 and about 20 per second. Nothing was lost in 70 s. The squeezes are this device’s background rather than an event; what the collector calls a microburst is a cluster of them — three flagged samples on one core inside 60 s — and never a single one. - memory available, 662 to 671 MiB. About 9 MiB of ordinary churn across the recording, with no step at either end of the dashboards check.
RouterOS’s own cpu-load, at 1 s, reports this minute as a flat few per cent. The recording shows
what the few per cent are made of: which core took each excursion, how long it lasted, and where
the notes fall against it.