Dashboards
Five Grafana dashboards, one per store Grafana can query (InfluxDB 3, Prometheus, PostgreSQL,
Graphite and Elasticsearch), generated from one panel list
in internal/dashboards/, with an alert-rule file beside three of them
(Alert rules). install does not put them in Grafana: it writes
only to the router.
Get them into Grafana
Section titled “Get them into Grafana”A dashboard reads the store the collector writes to (Run the collector), and gets into Grafana one of three ways:
- From the collector:
forward … --grafana <url>creates the datasource and publishes the dashboard at every start, anddashboards publishdoes the same once (details). - With the CLI:
dashboards import --store <store> --datasource-uid <uid>, against a datasource you already have (details). - By hand: upload the JSON in Grafana (details).
Set up in Grafana has the datasource for each store and the check that runs every panel.
Screenshots
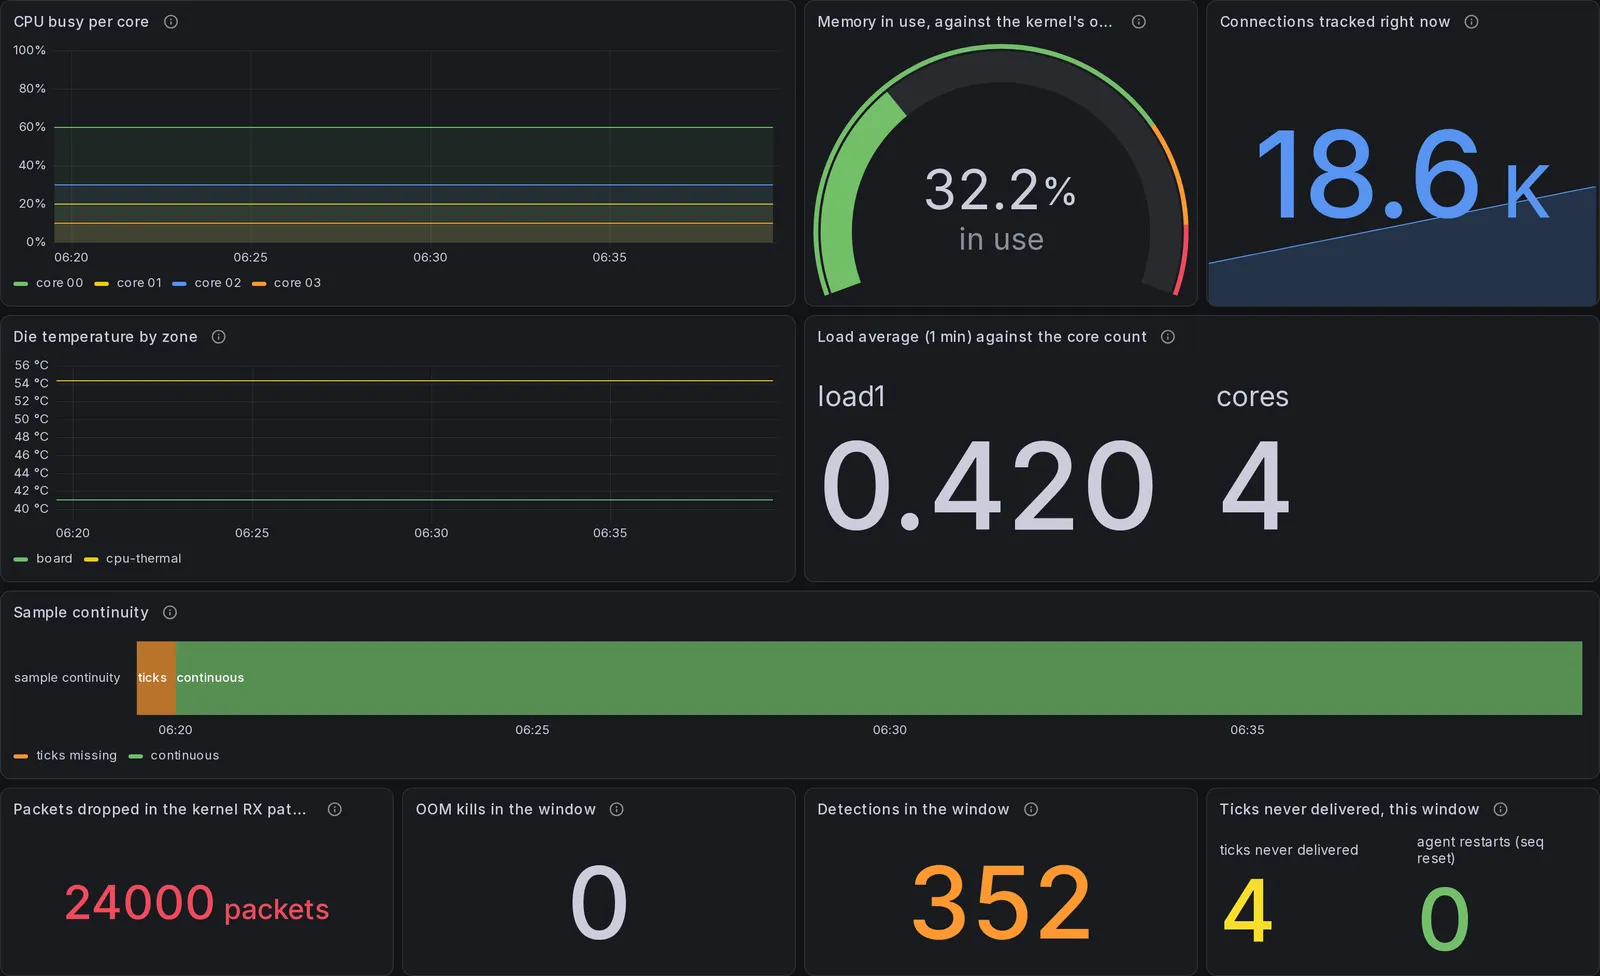
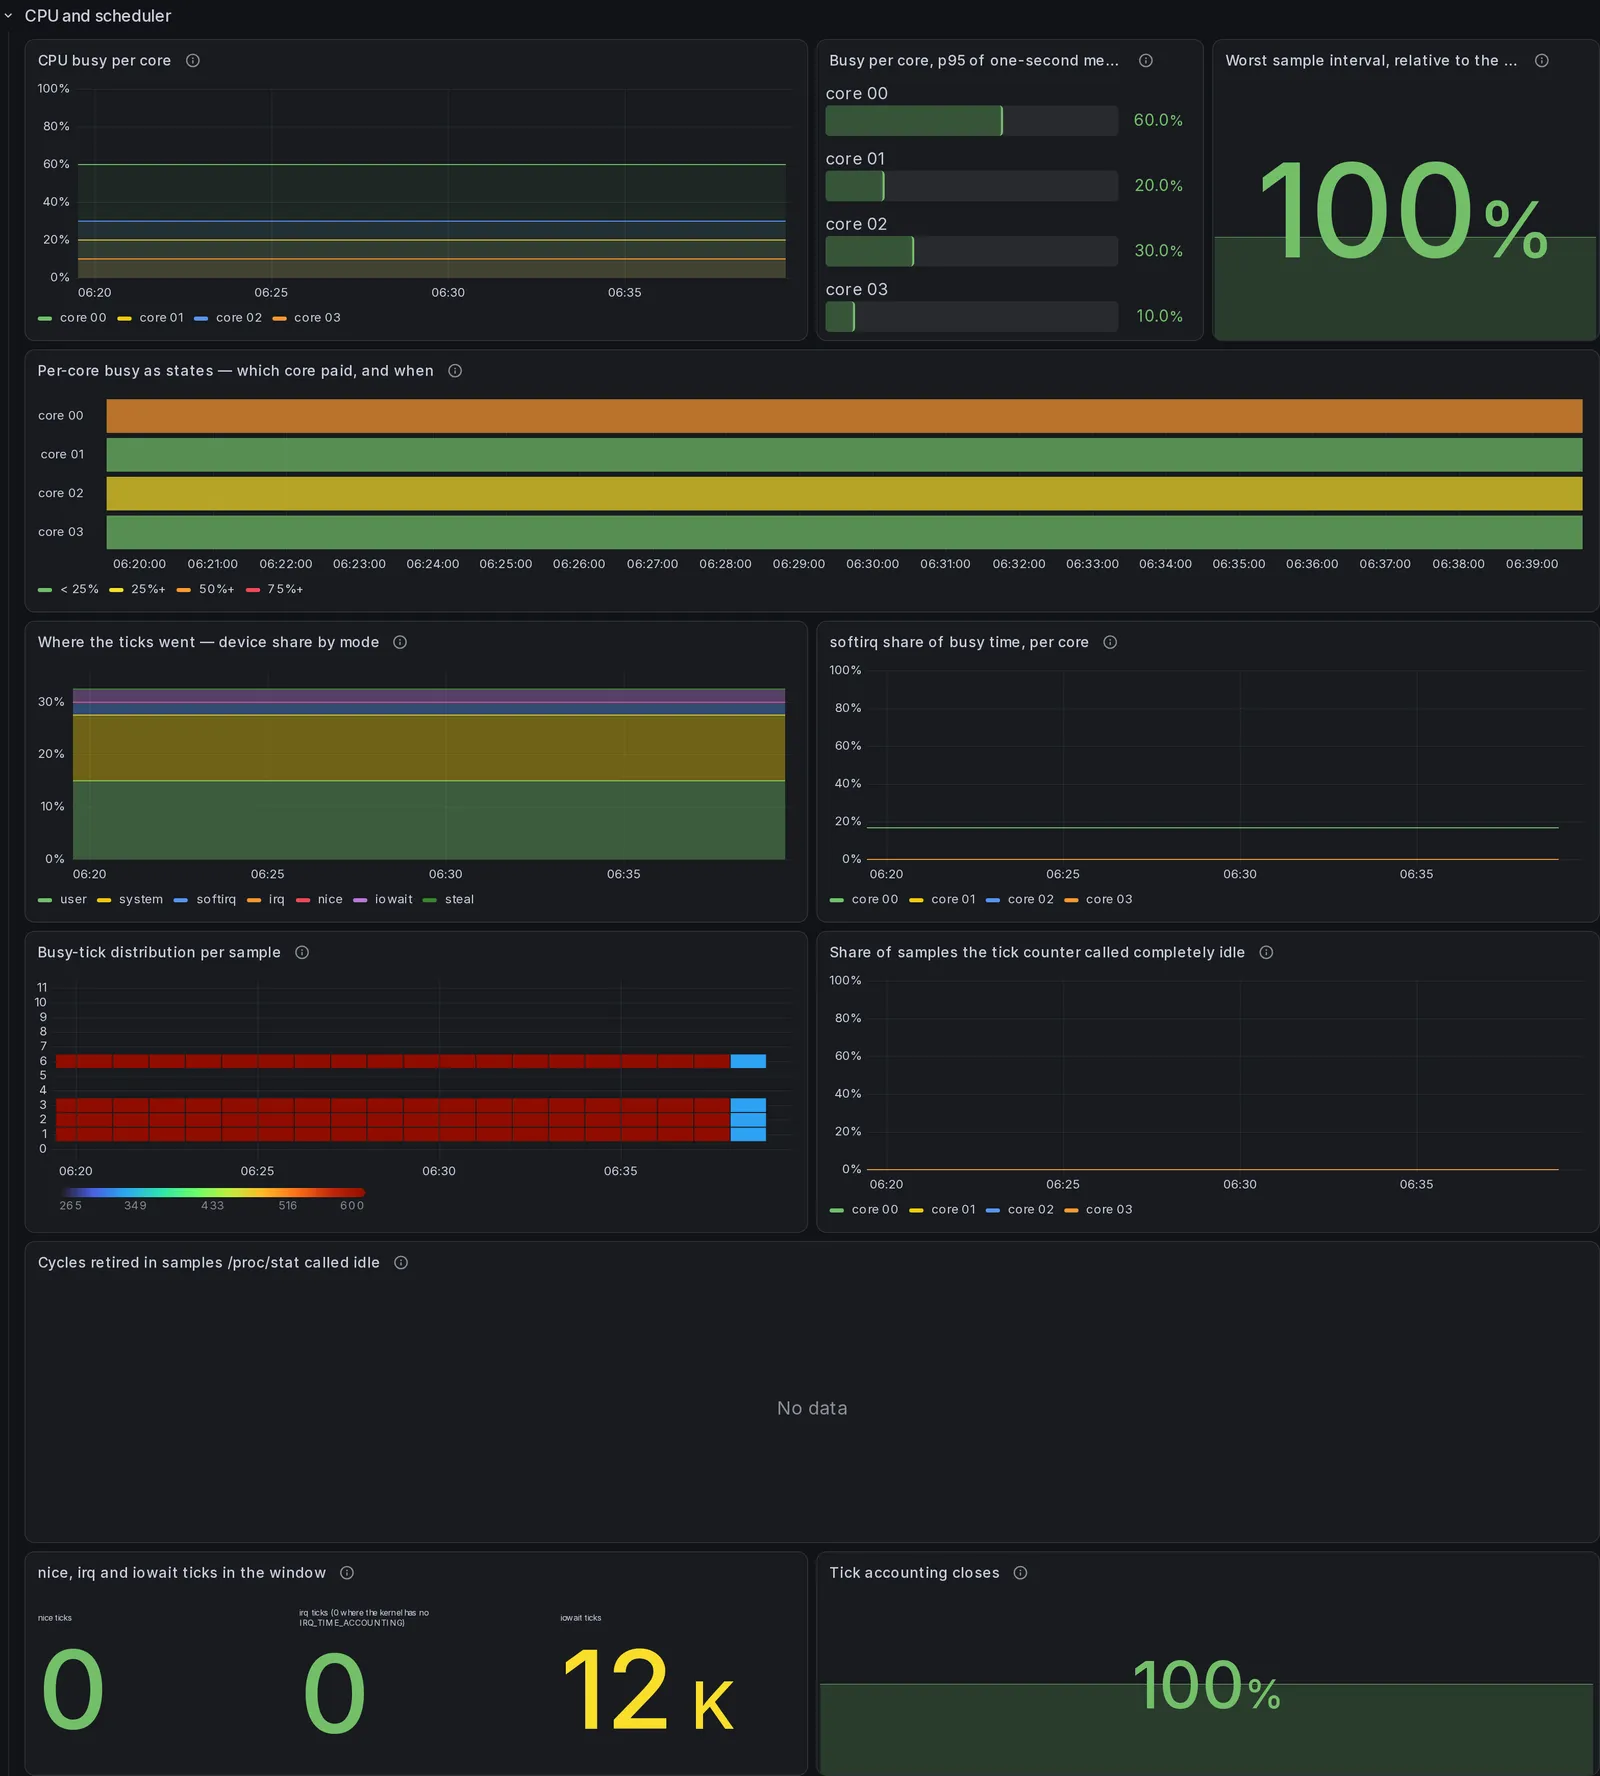
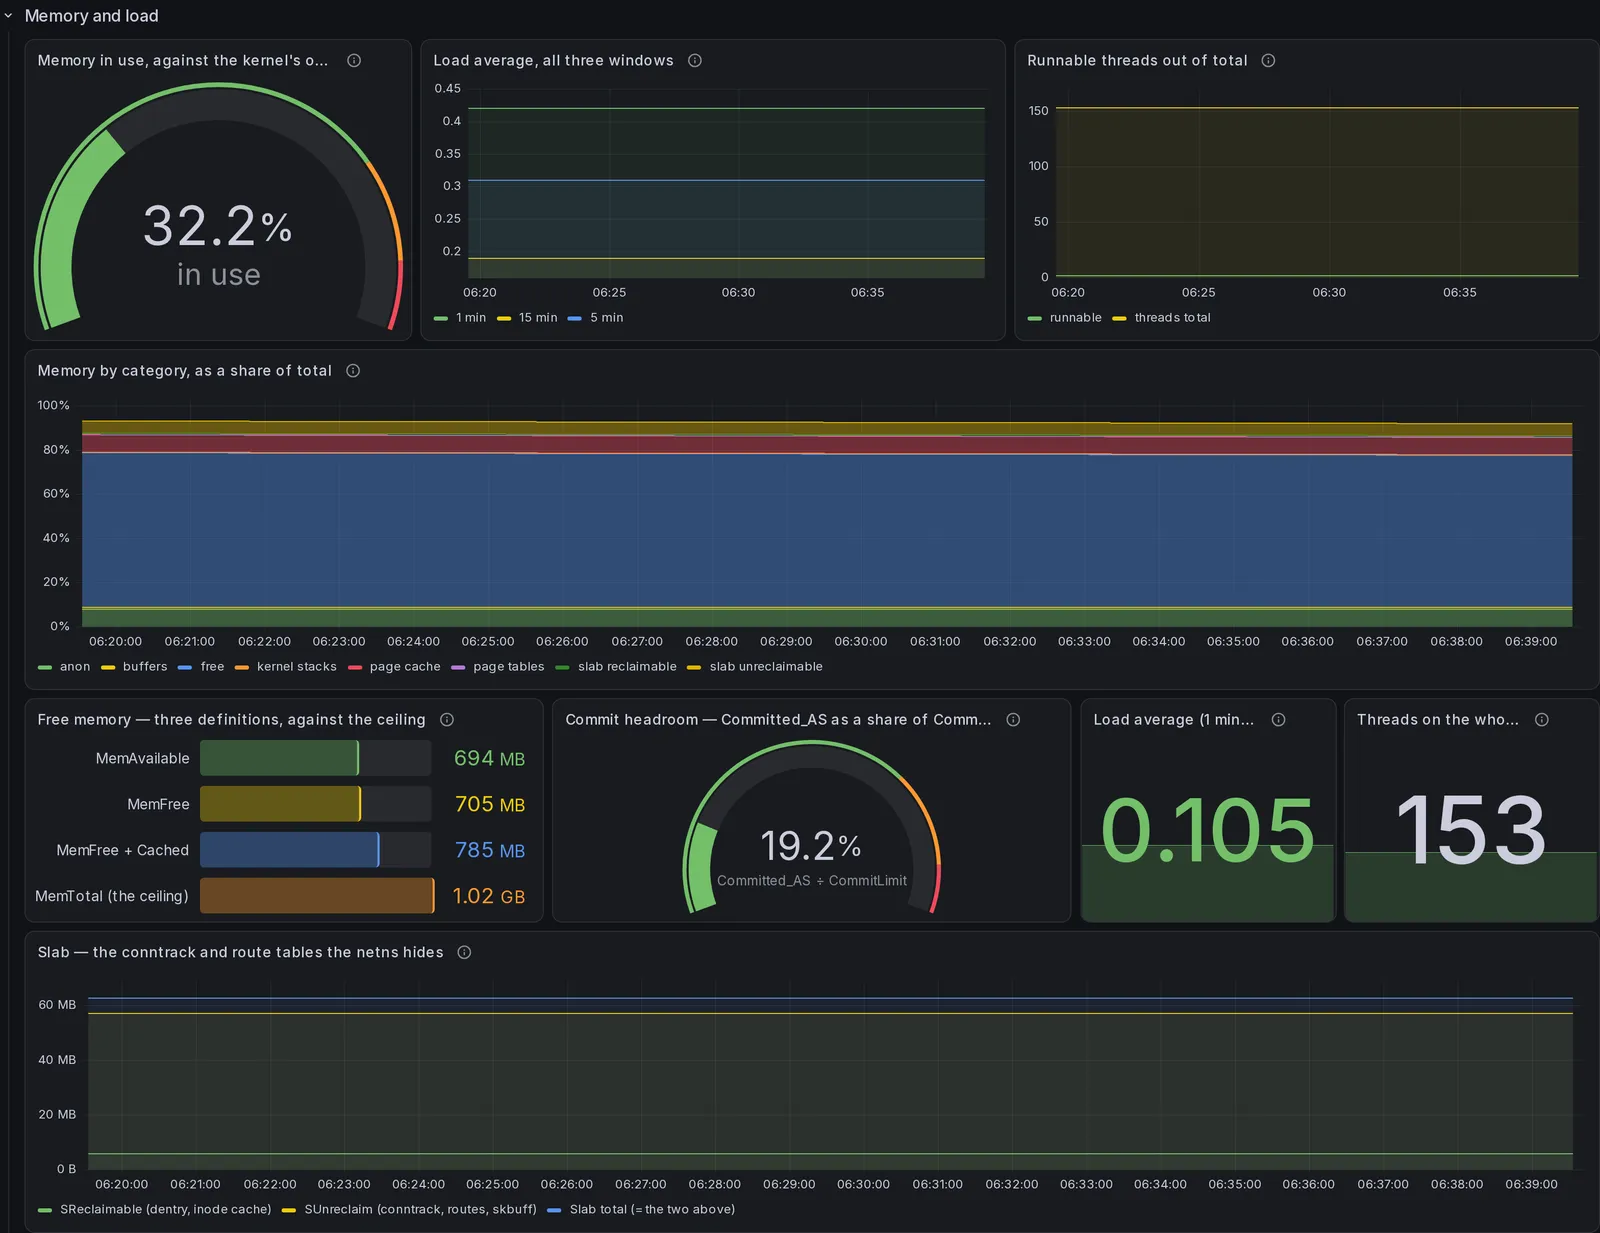
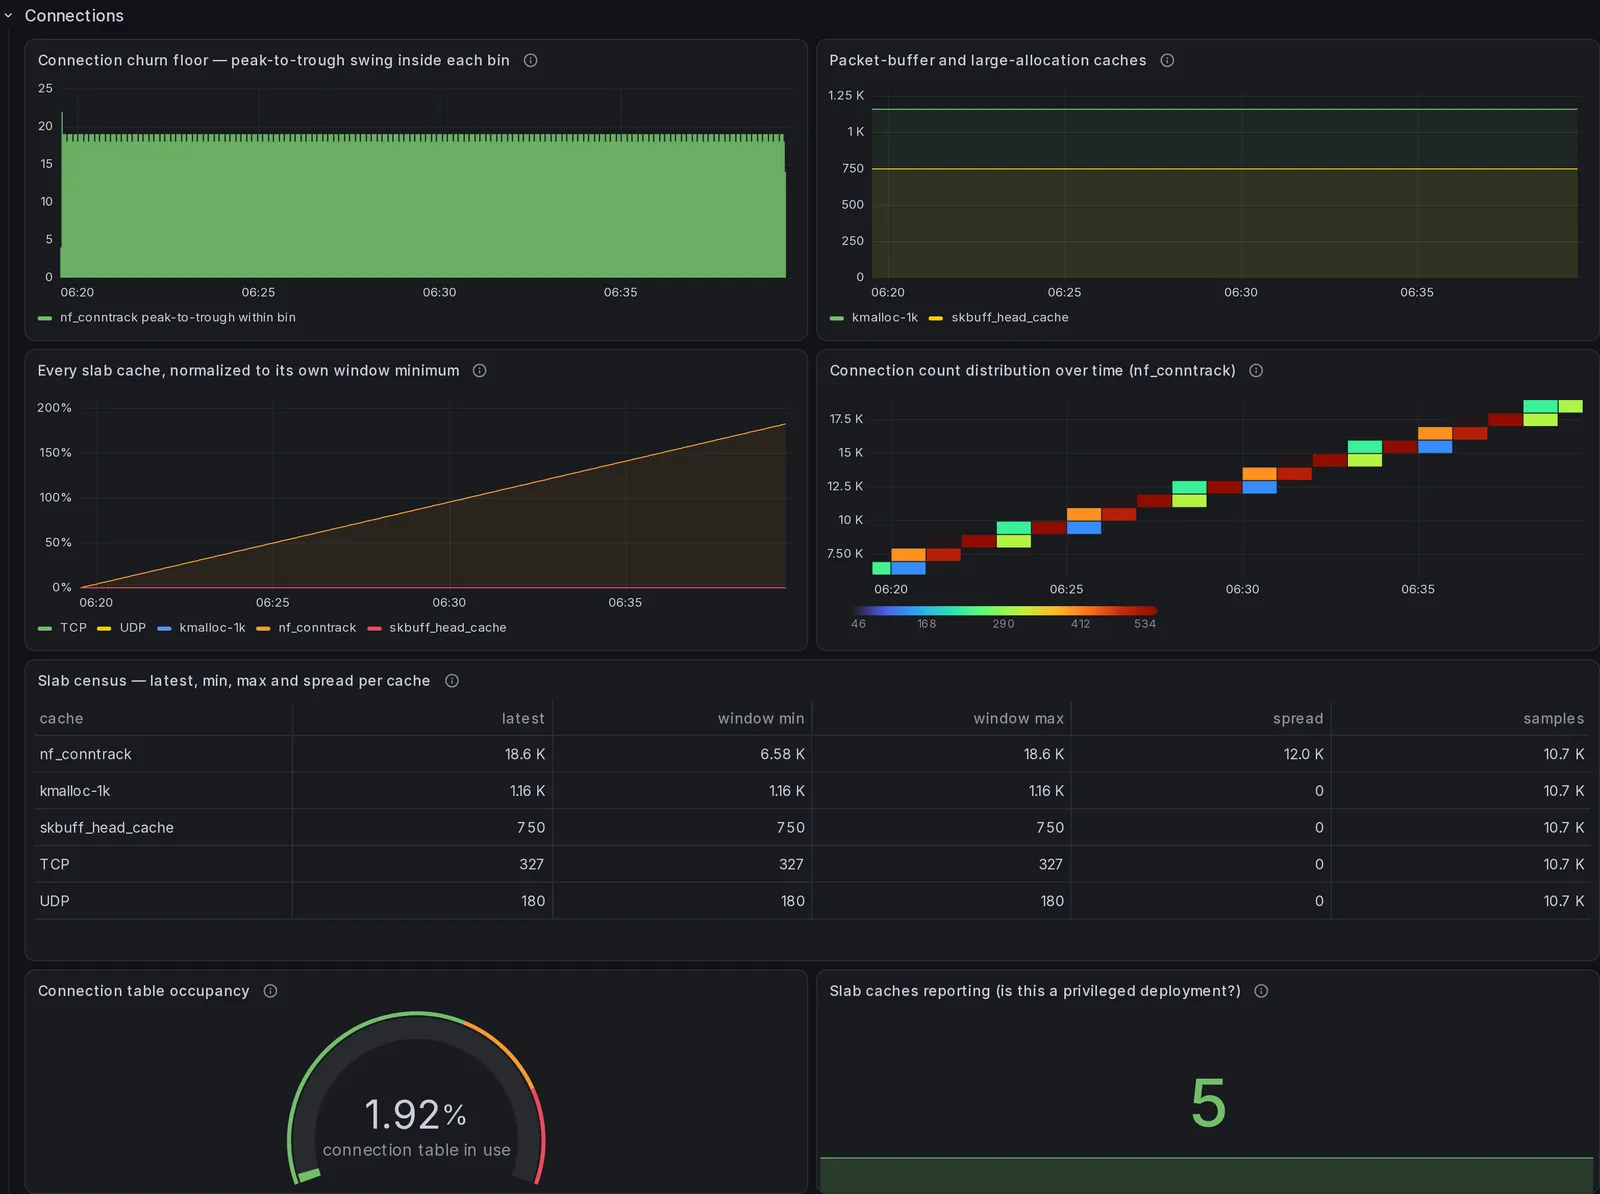
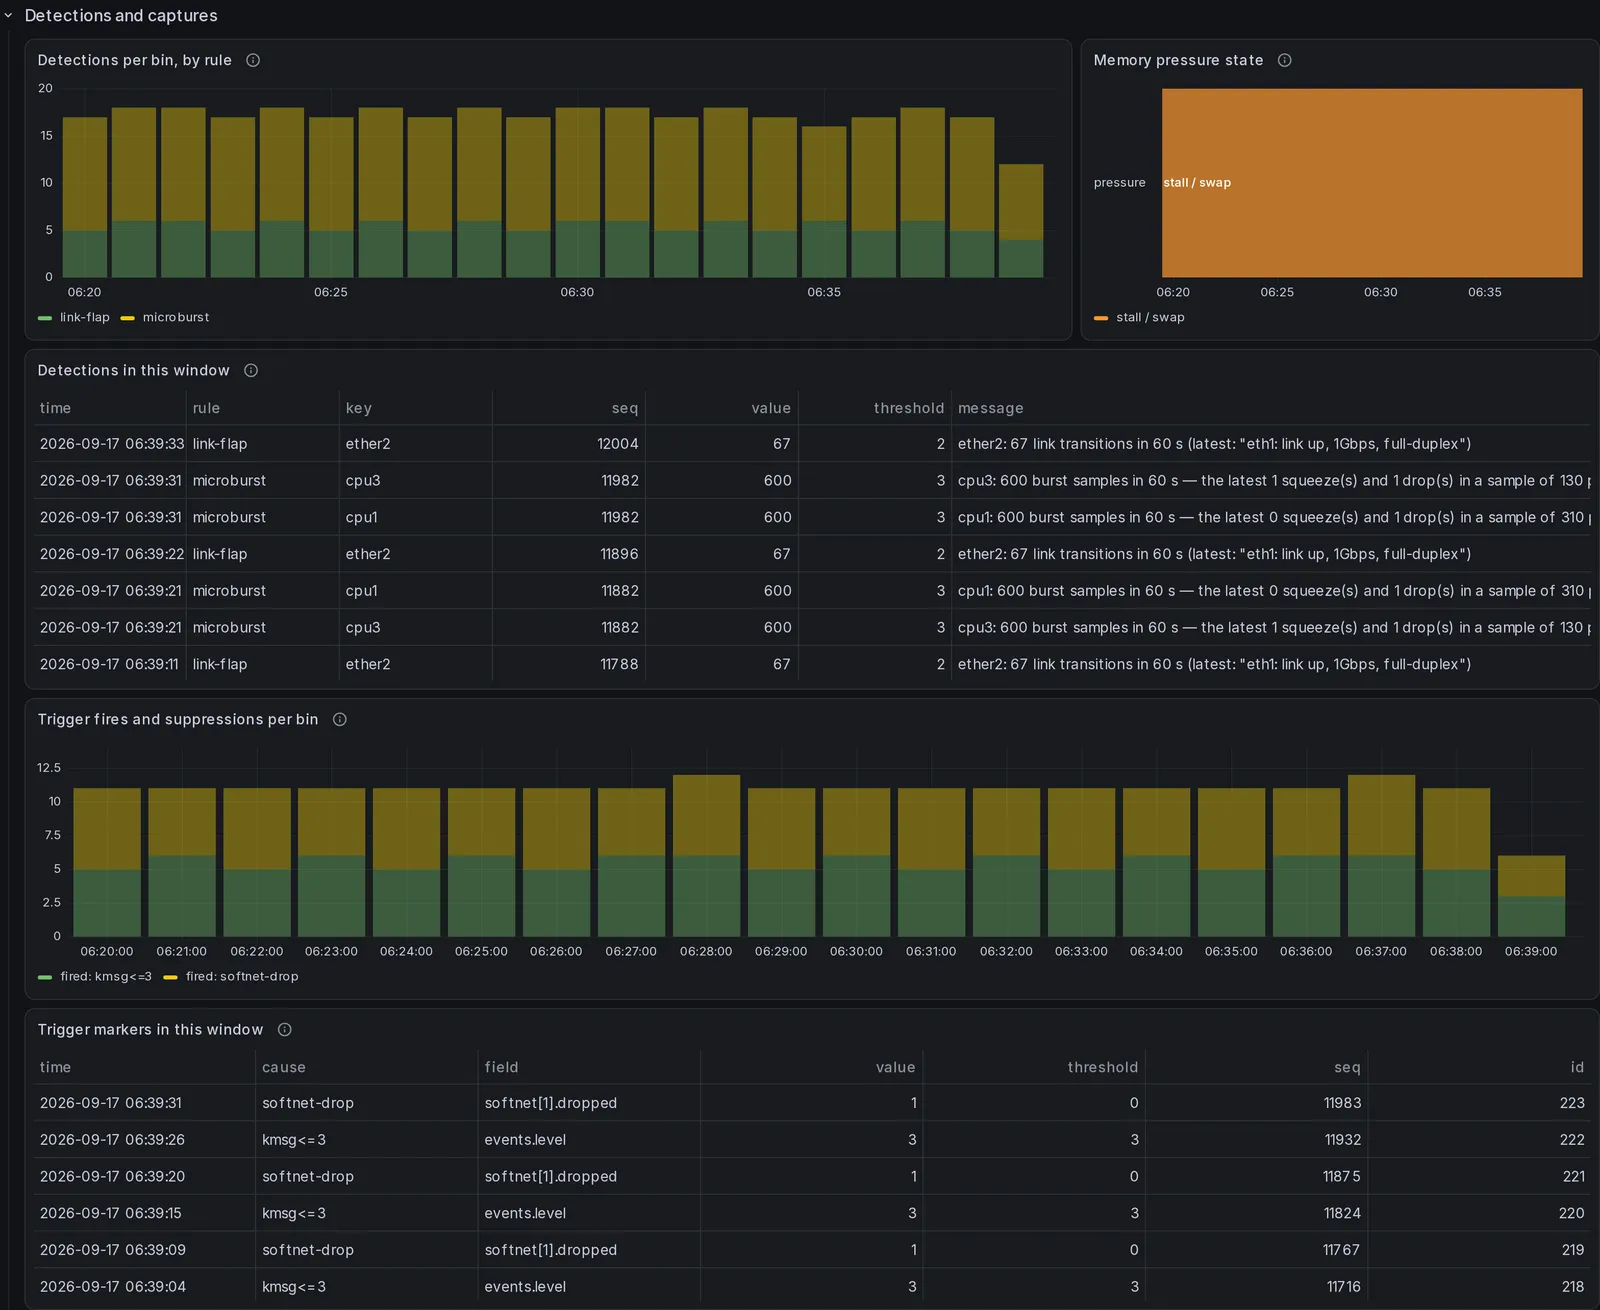
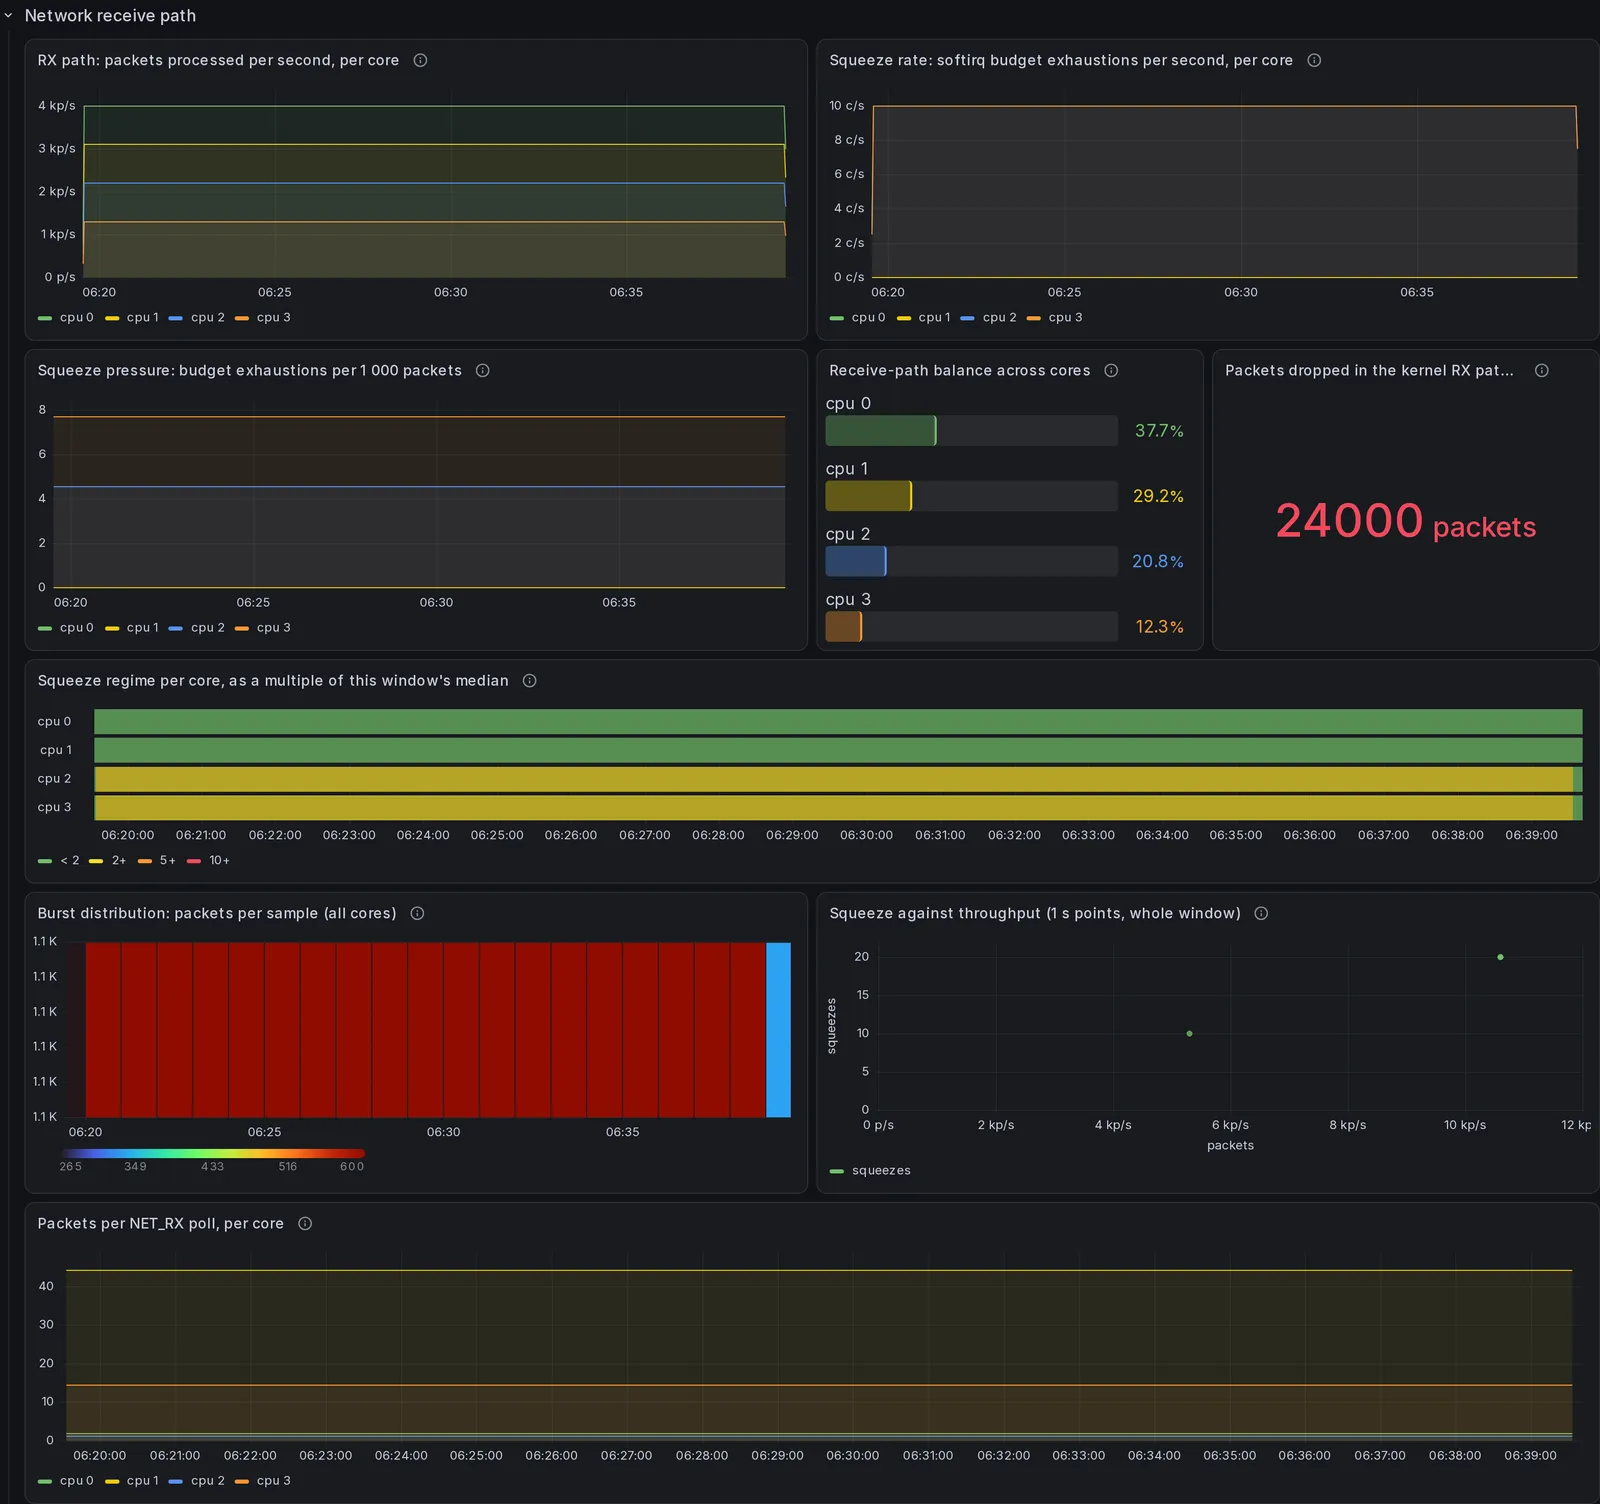
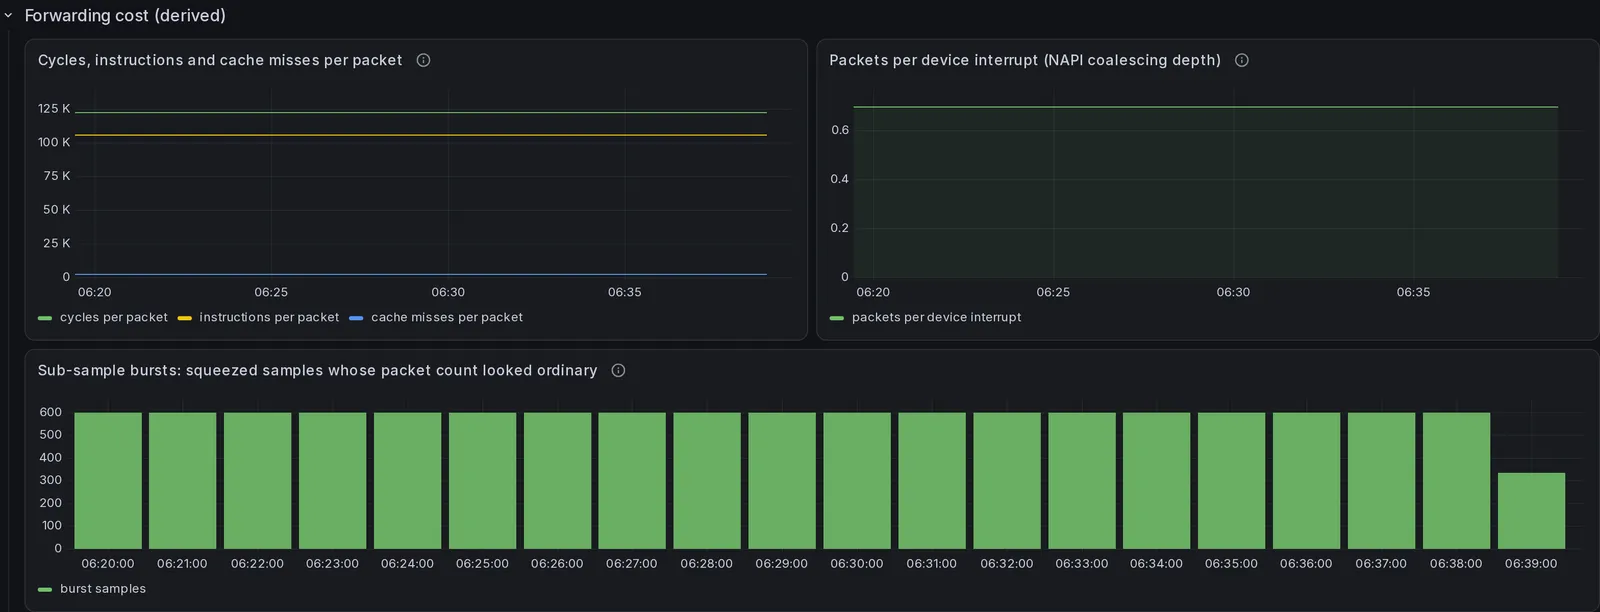
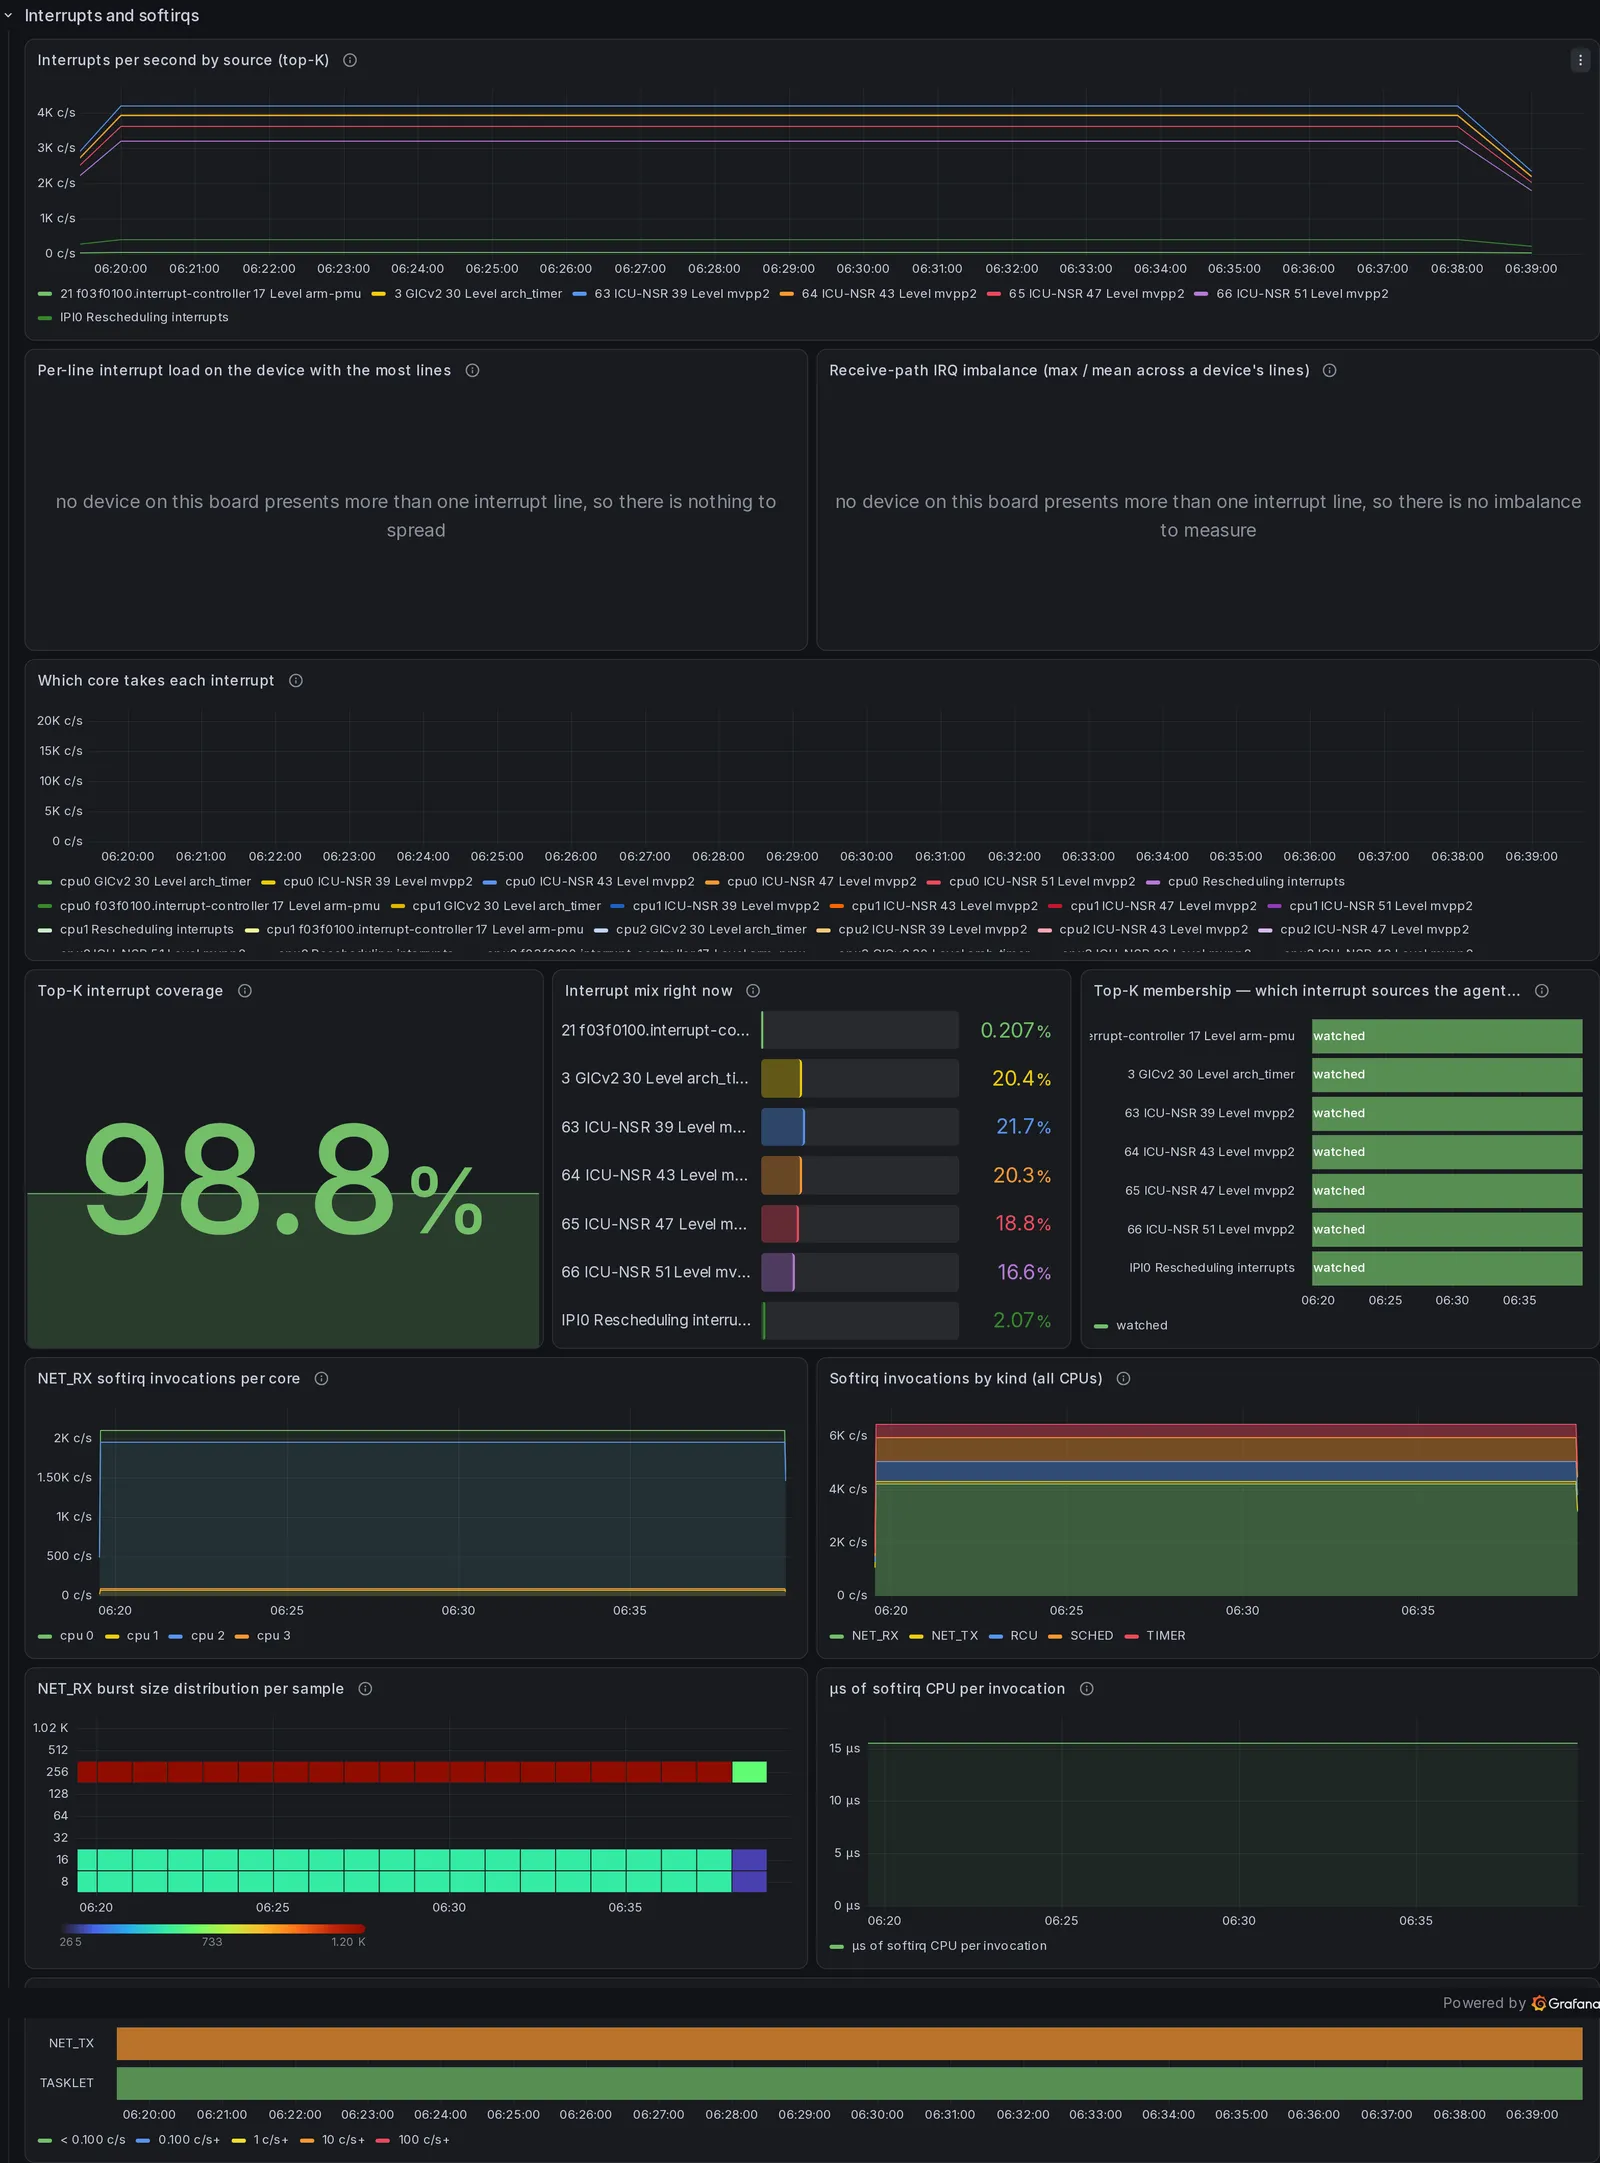
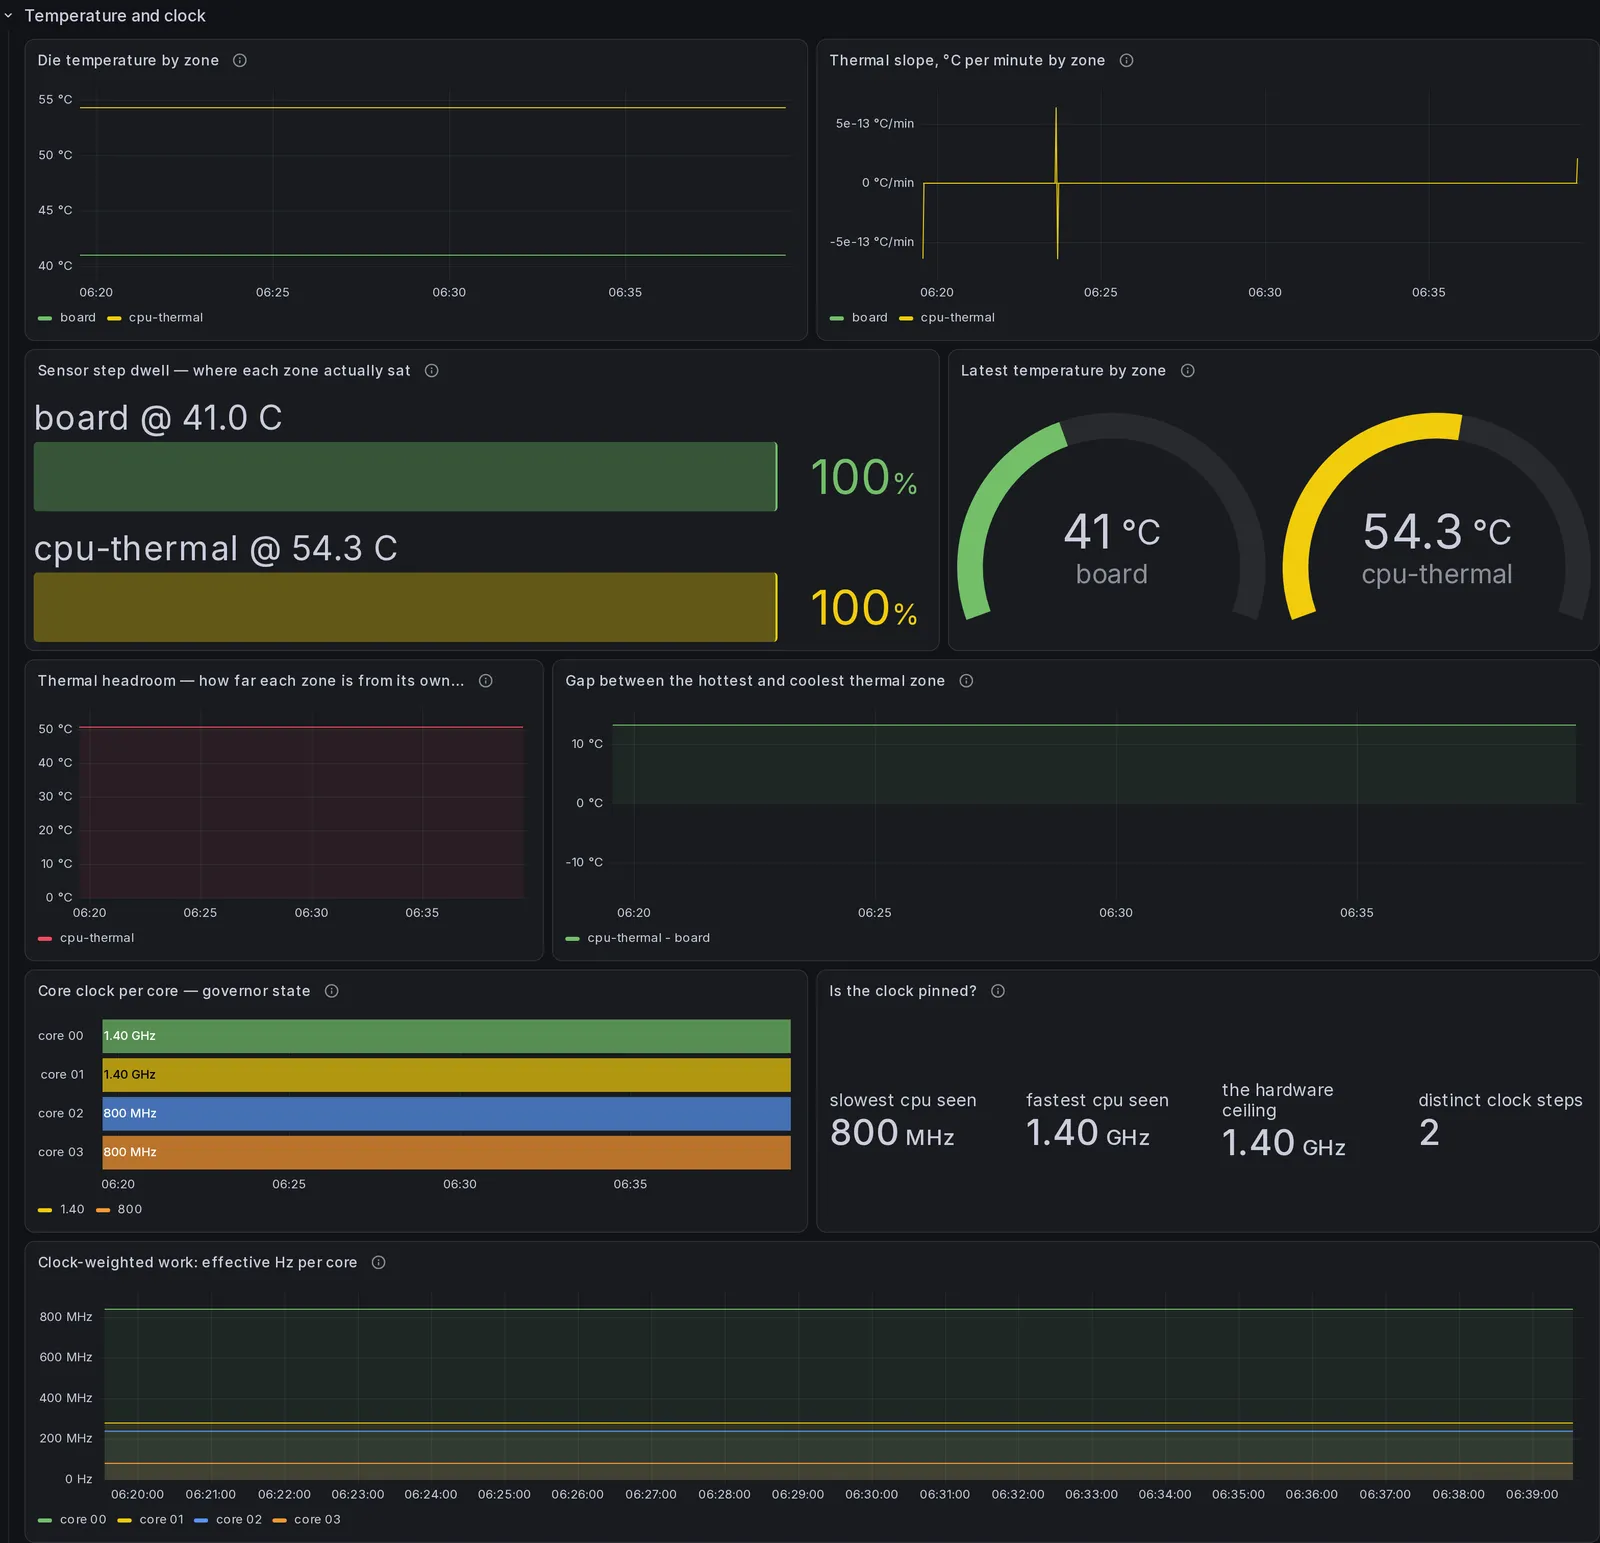
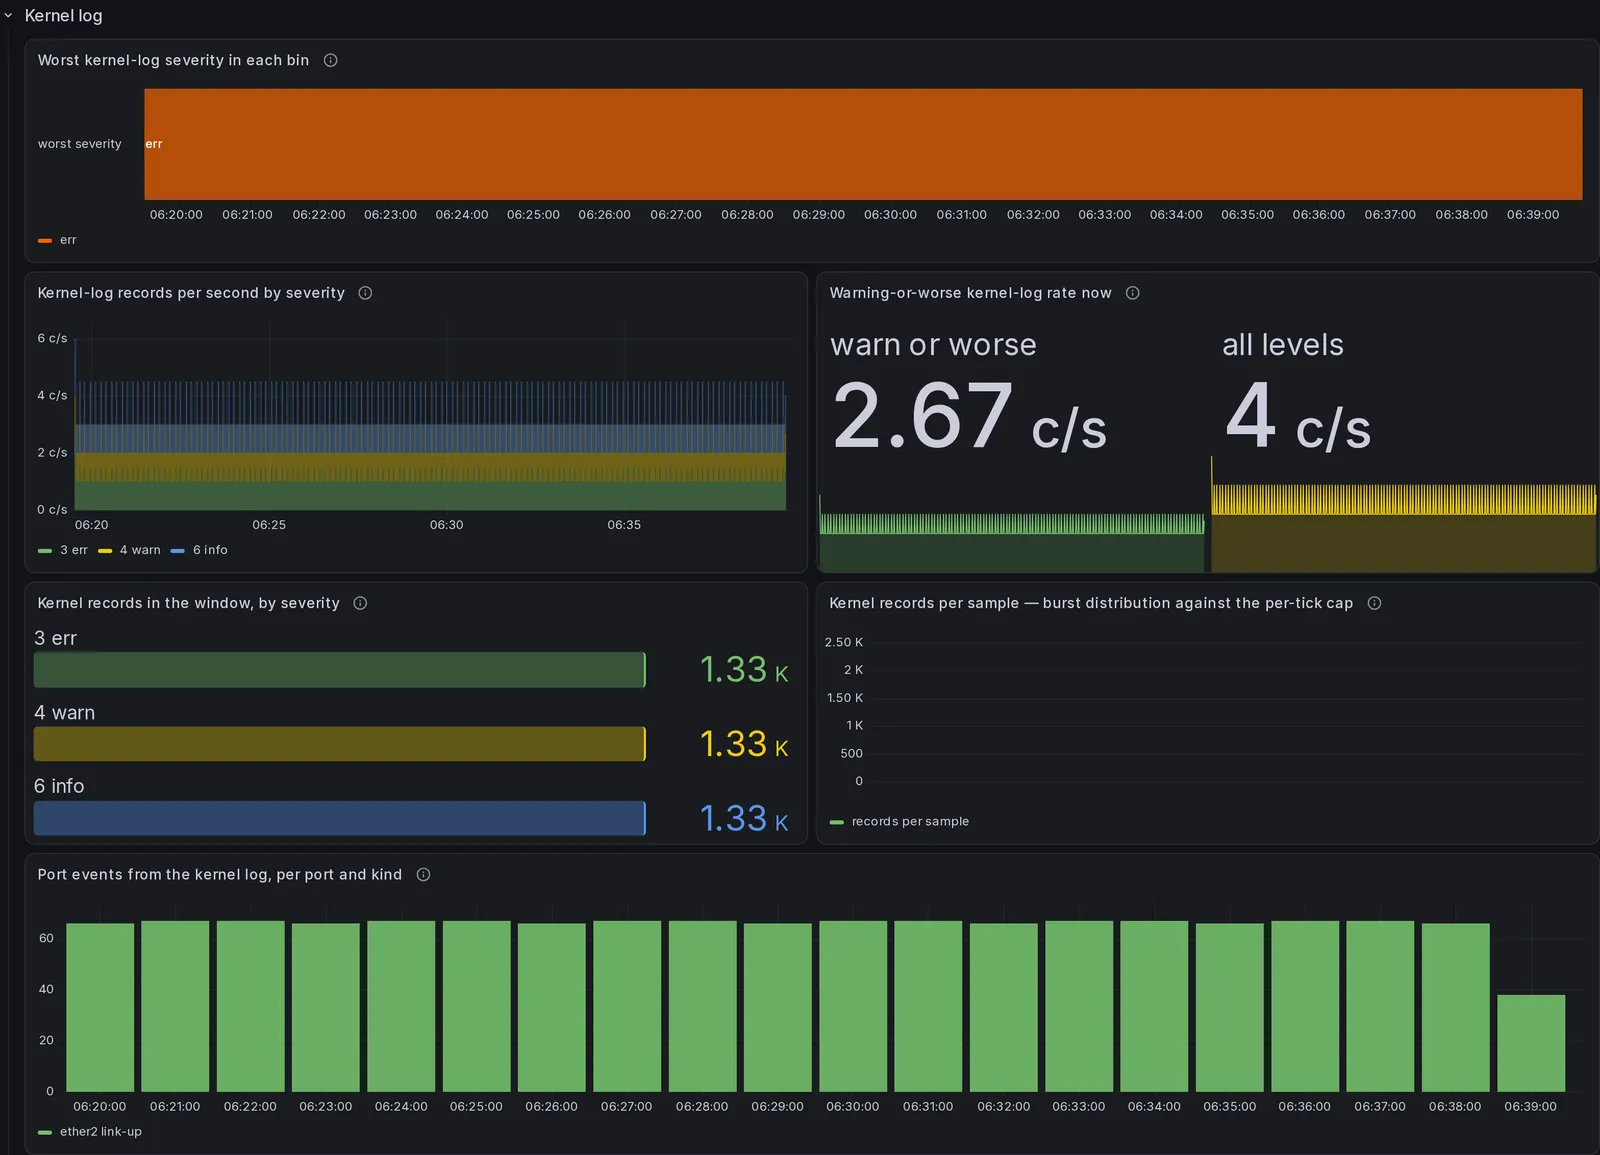
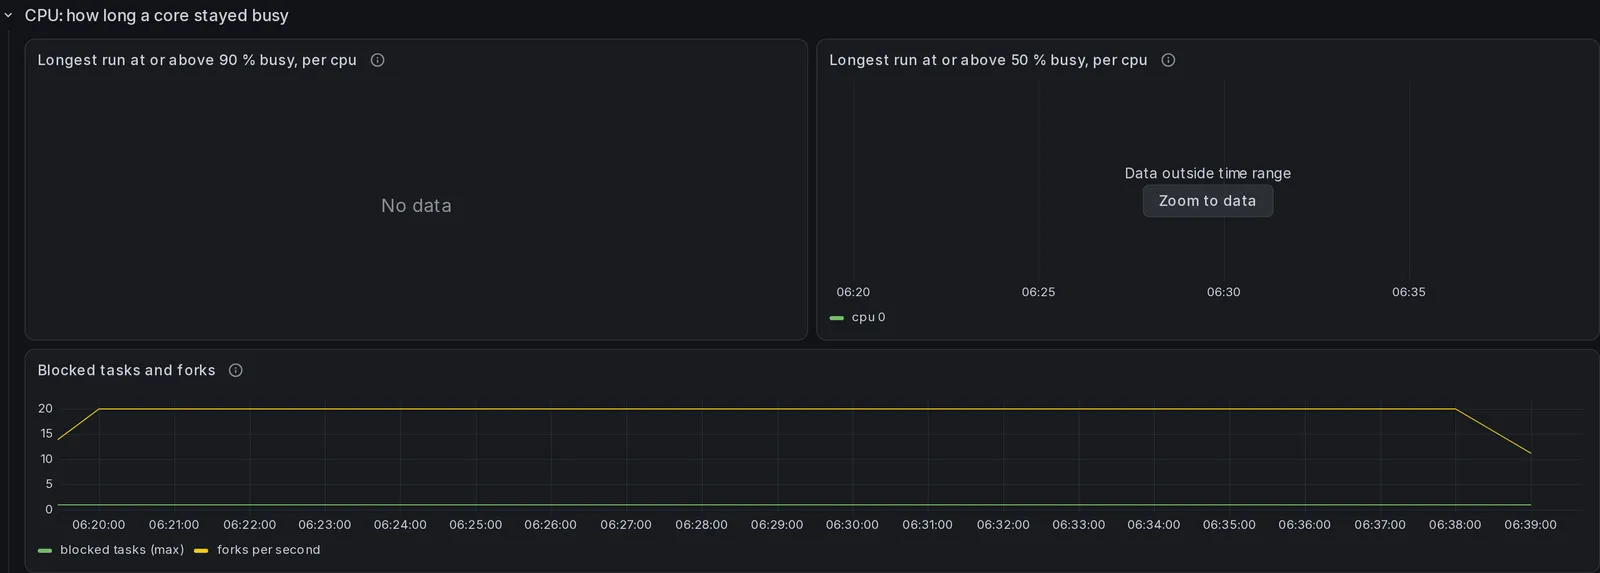
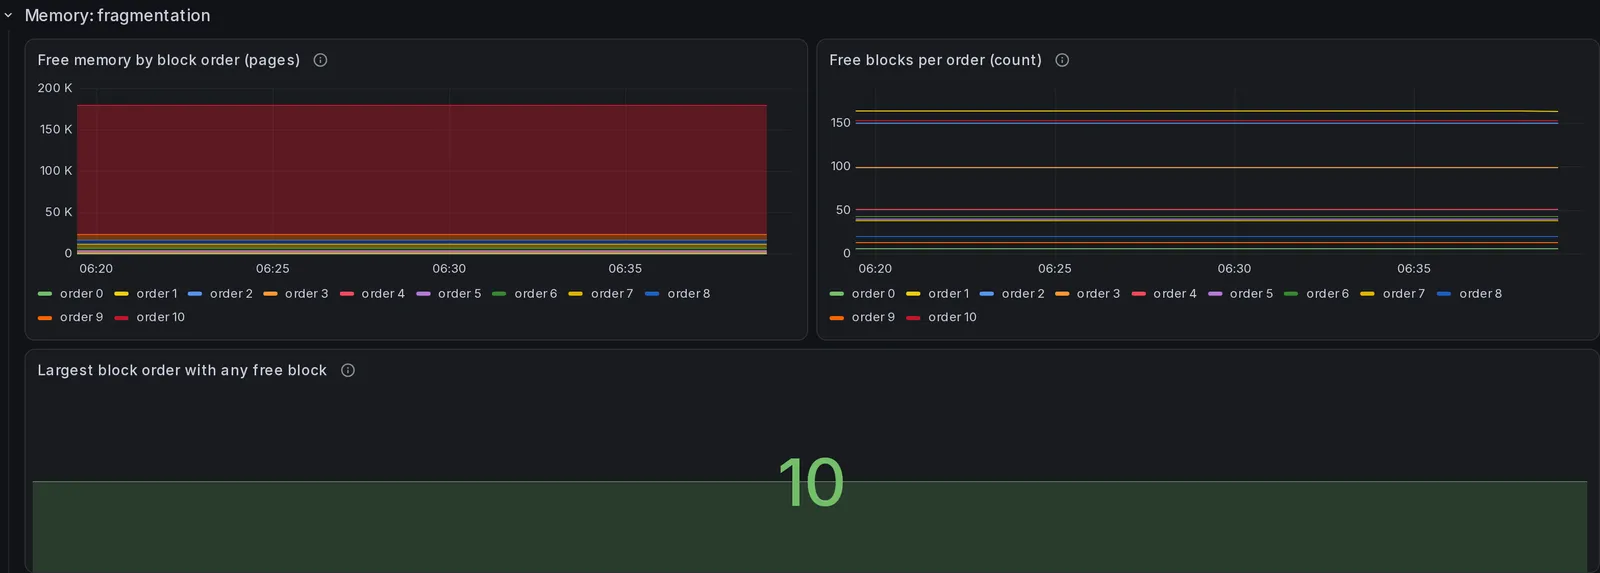
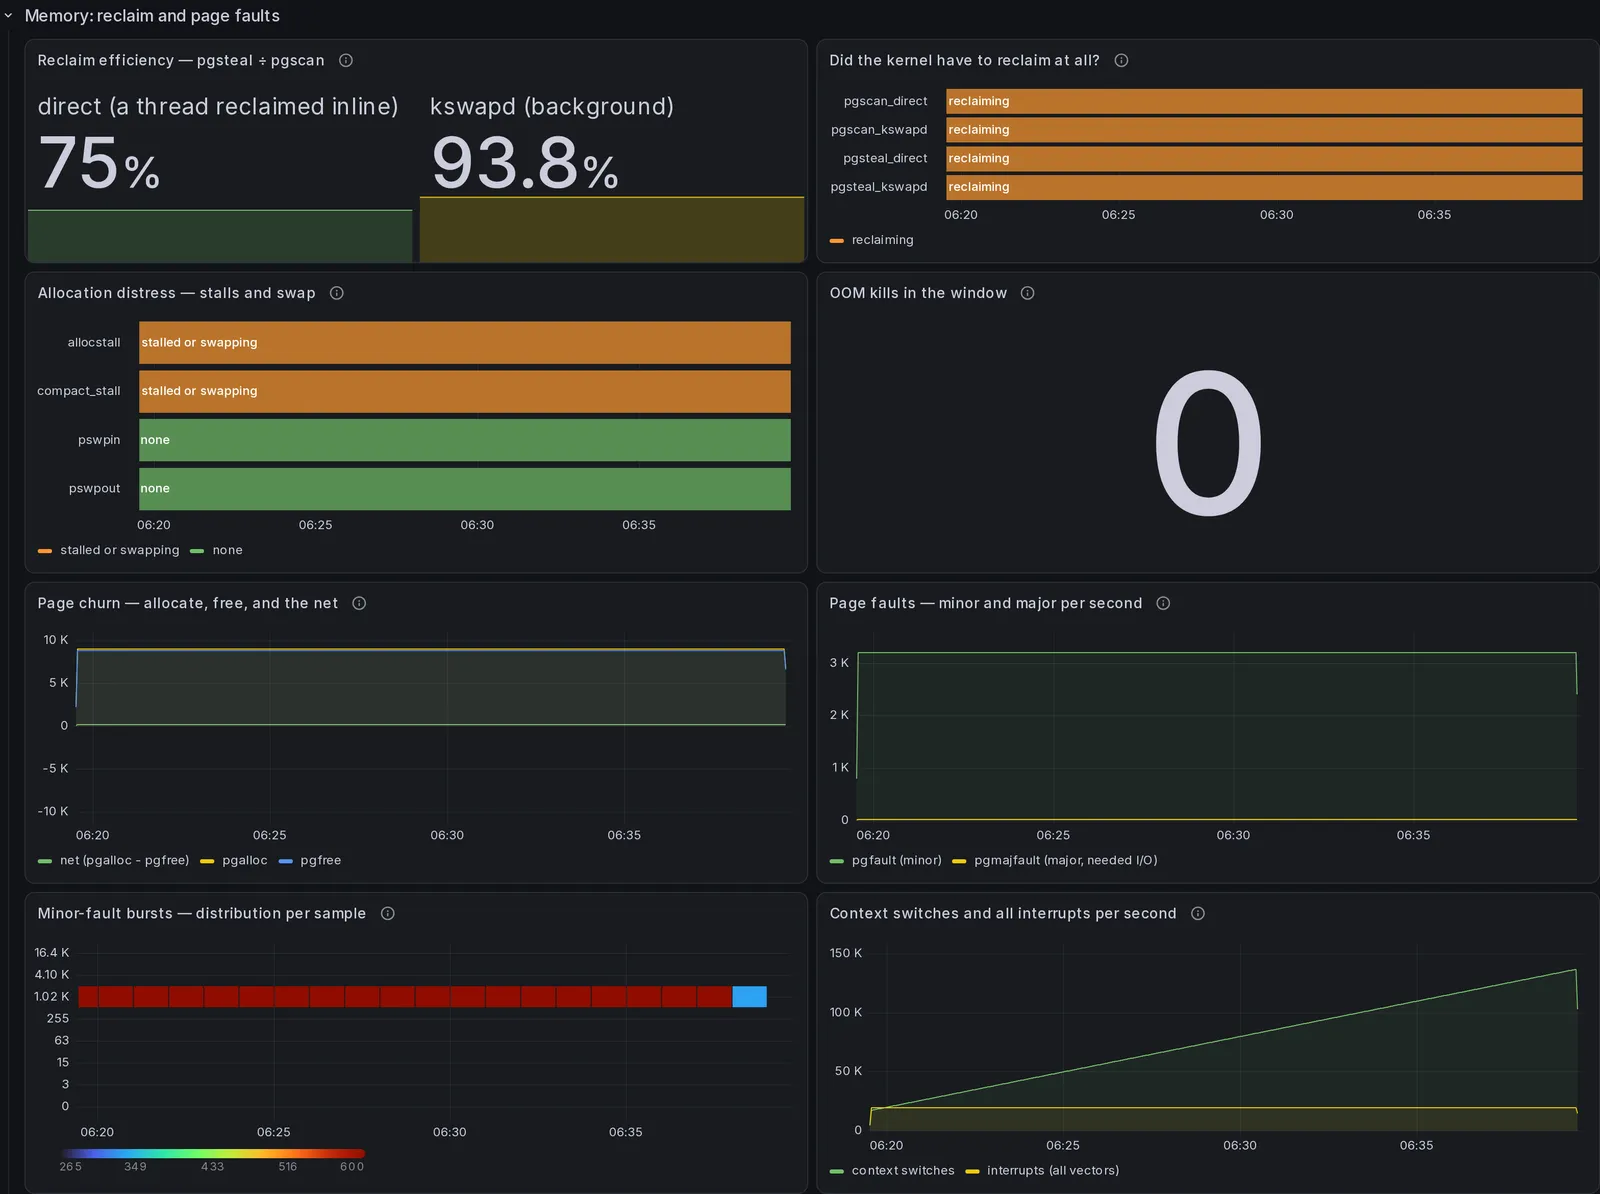
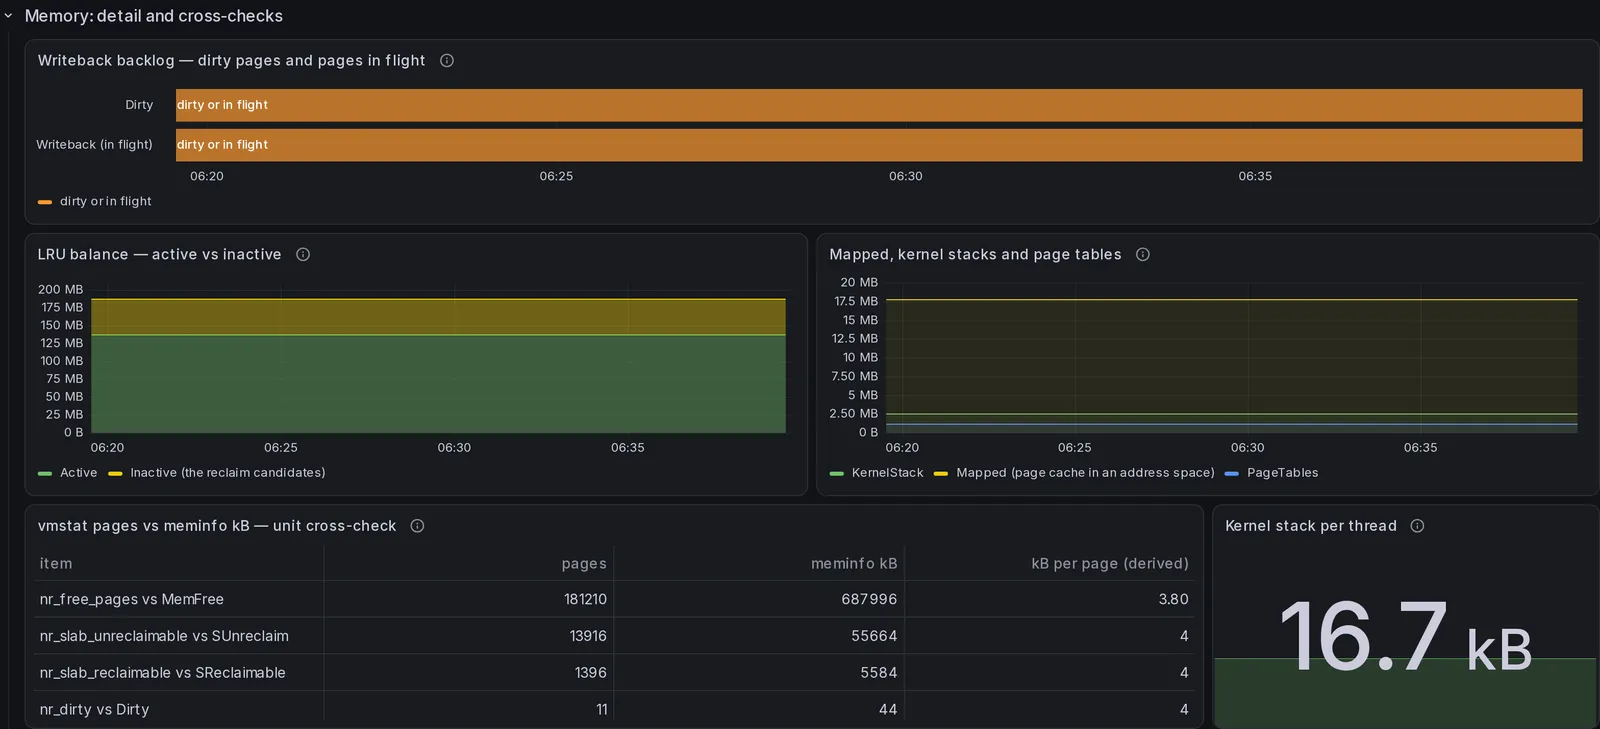
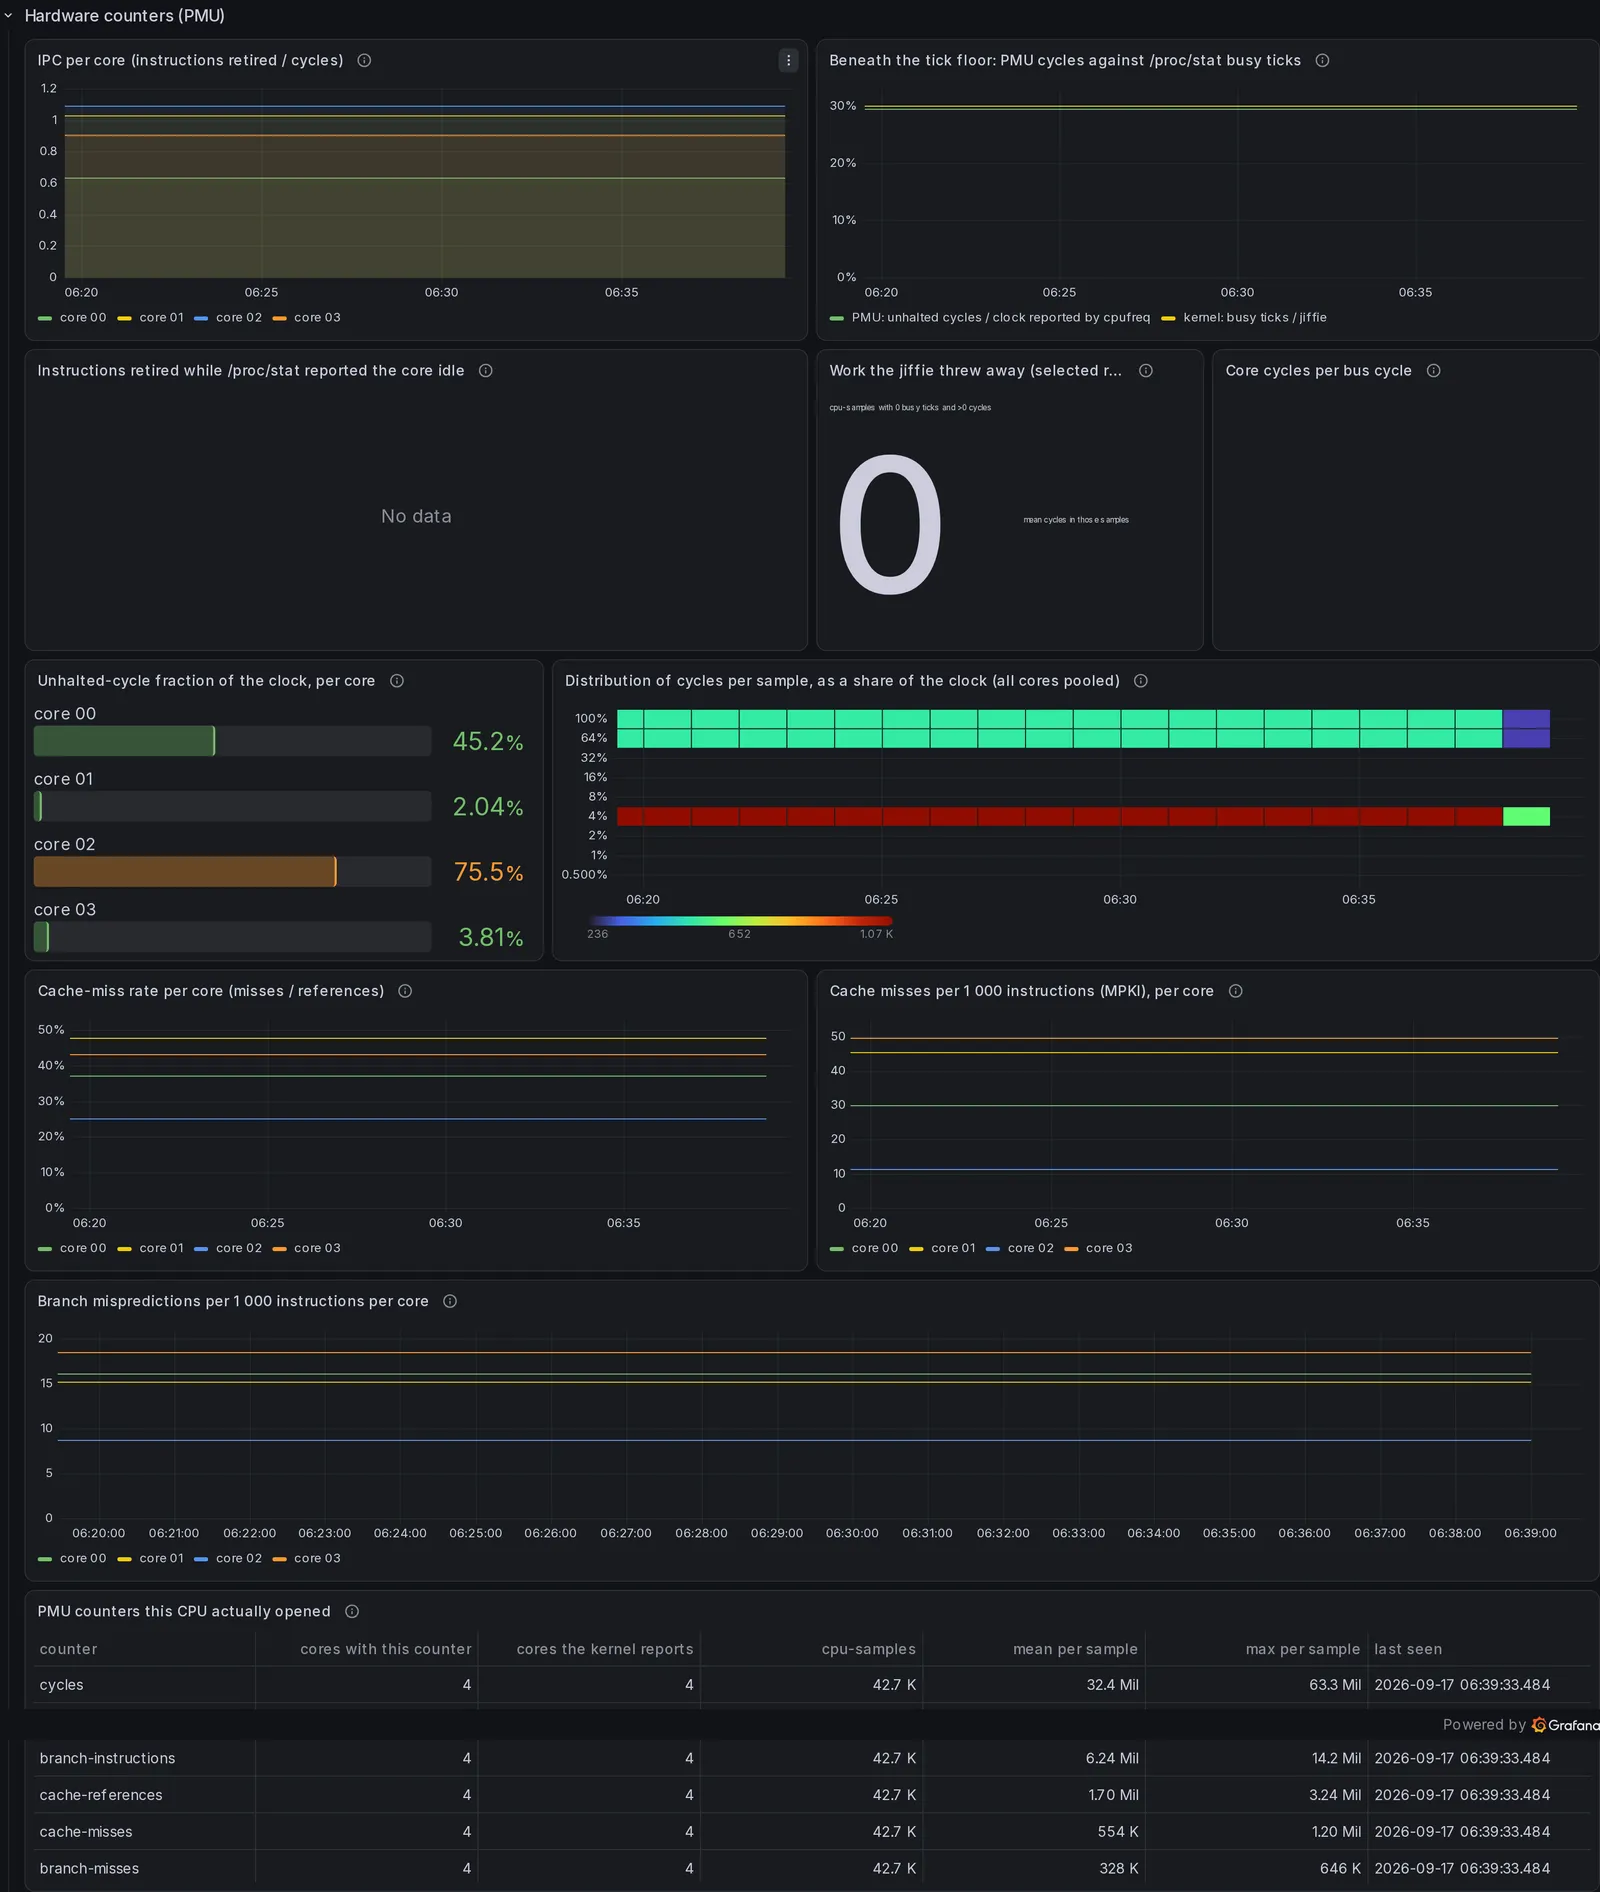
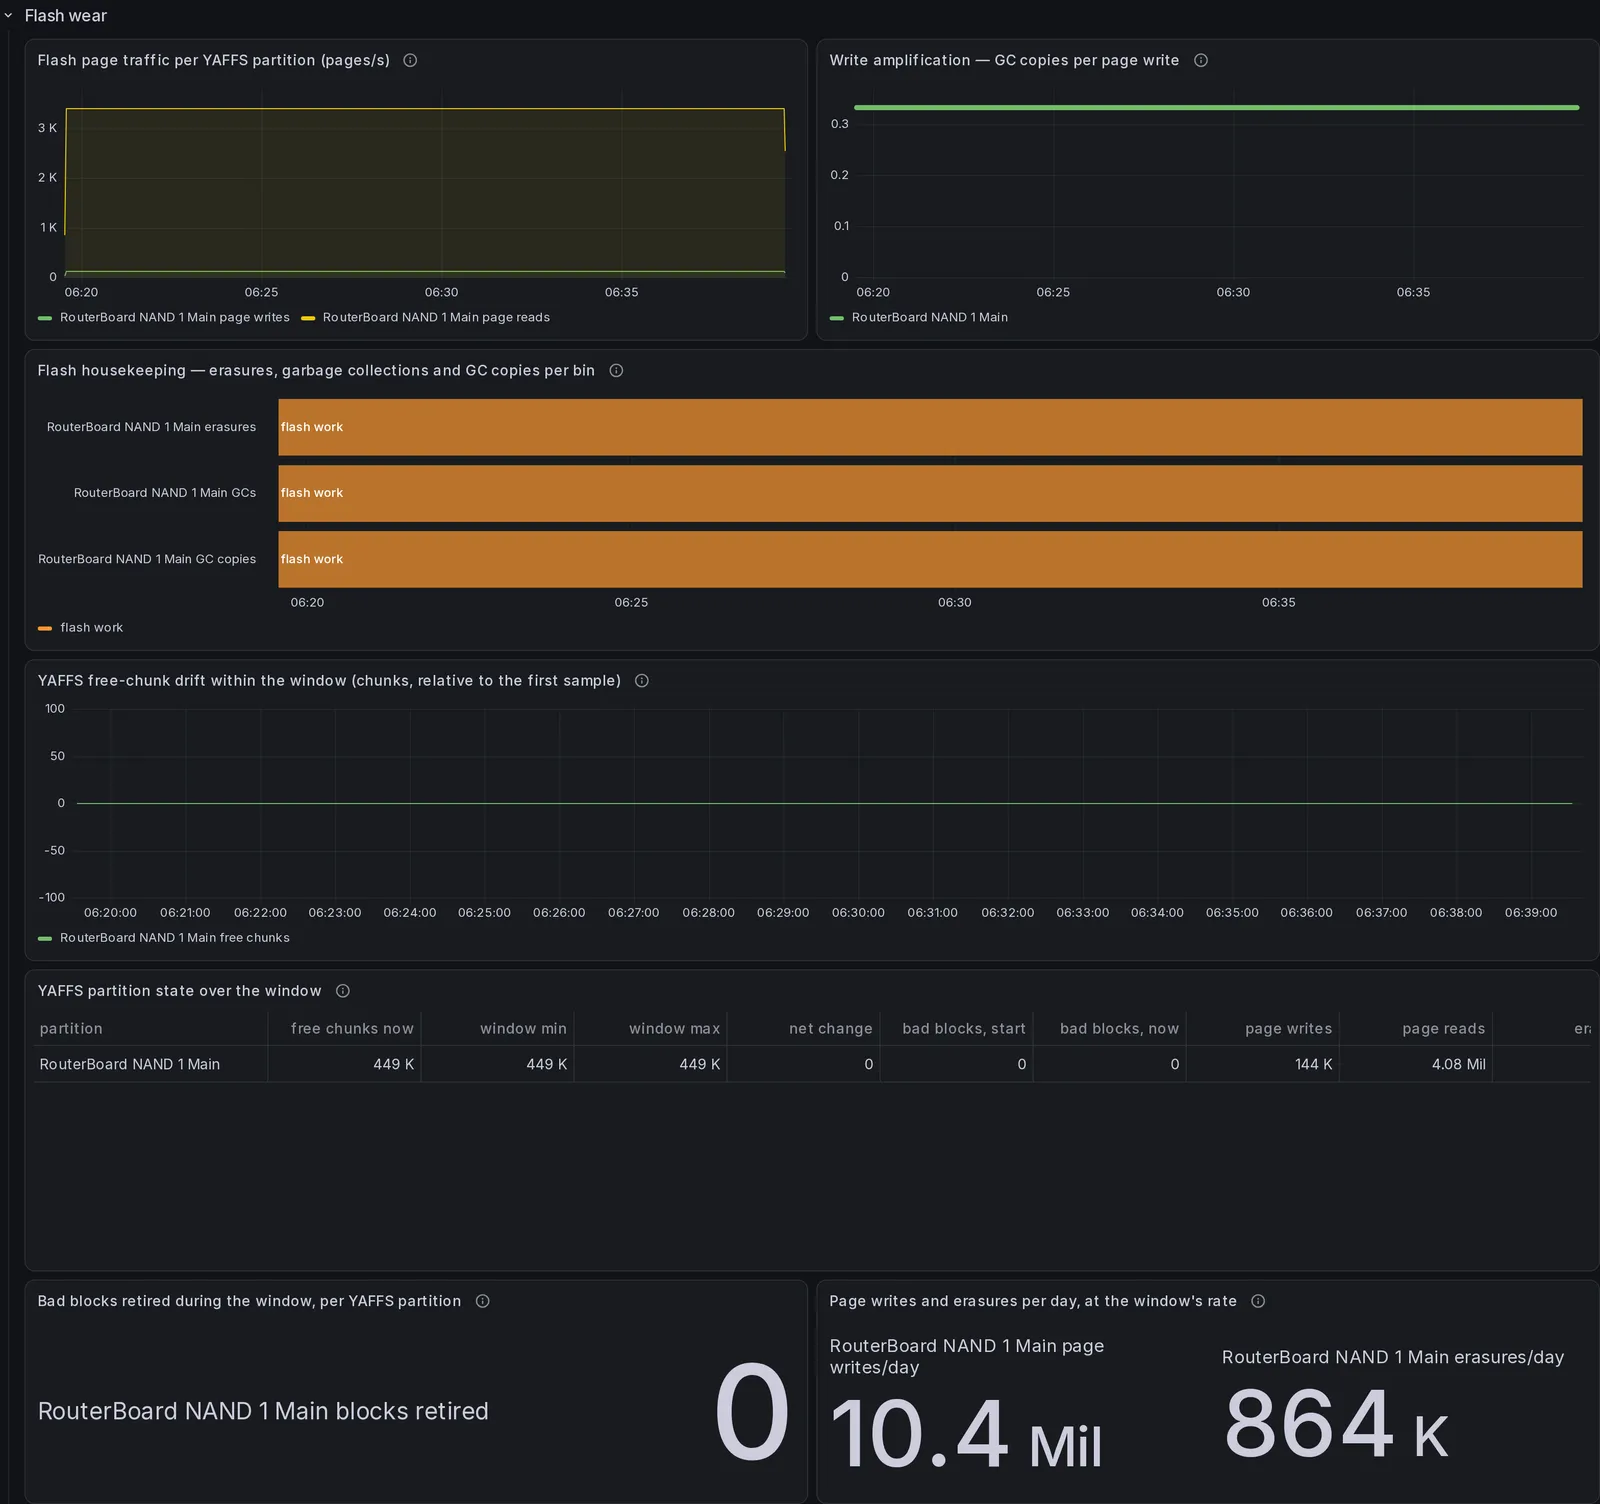
Section titled “Screenshots”One capture per section of the InfluxDB dashboard, in the order the dashboard puts them. Each is a link to the file at full size.
The captures show a demonstration database, not a router: the InfluxDB dashboard over a run of the
canned fake agent the end-to-end suites use, written into a container store by the fill step of
the suite in test/e2e/docker/ and photographed
by site/. The host is called rb5009 because the
fake agent imitates that board’s captured /proc, and the figures are whatever the fake publishes: read
them as the shape of the page, never as a measurement. A panel that is empty in a capture is one the
fake agent produces nothing for; on a real router with the API tier running, several of them fill
in, and two whole sections that the store probe moved into “not available” come back.
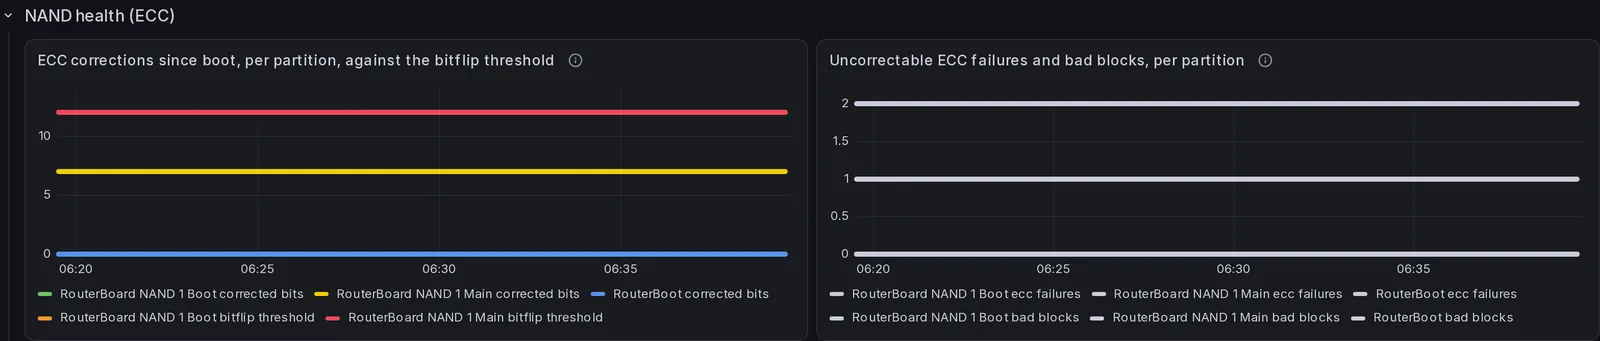
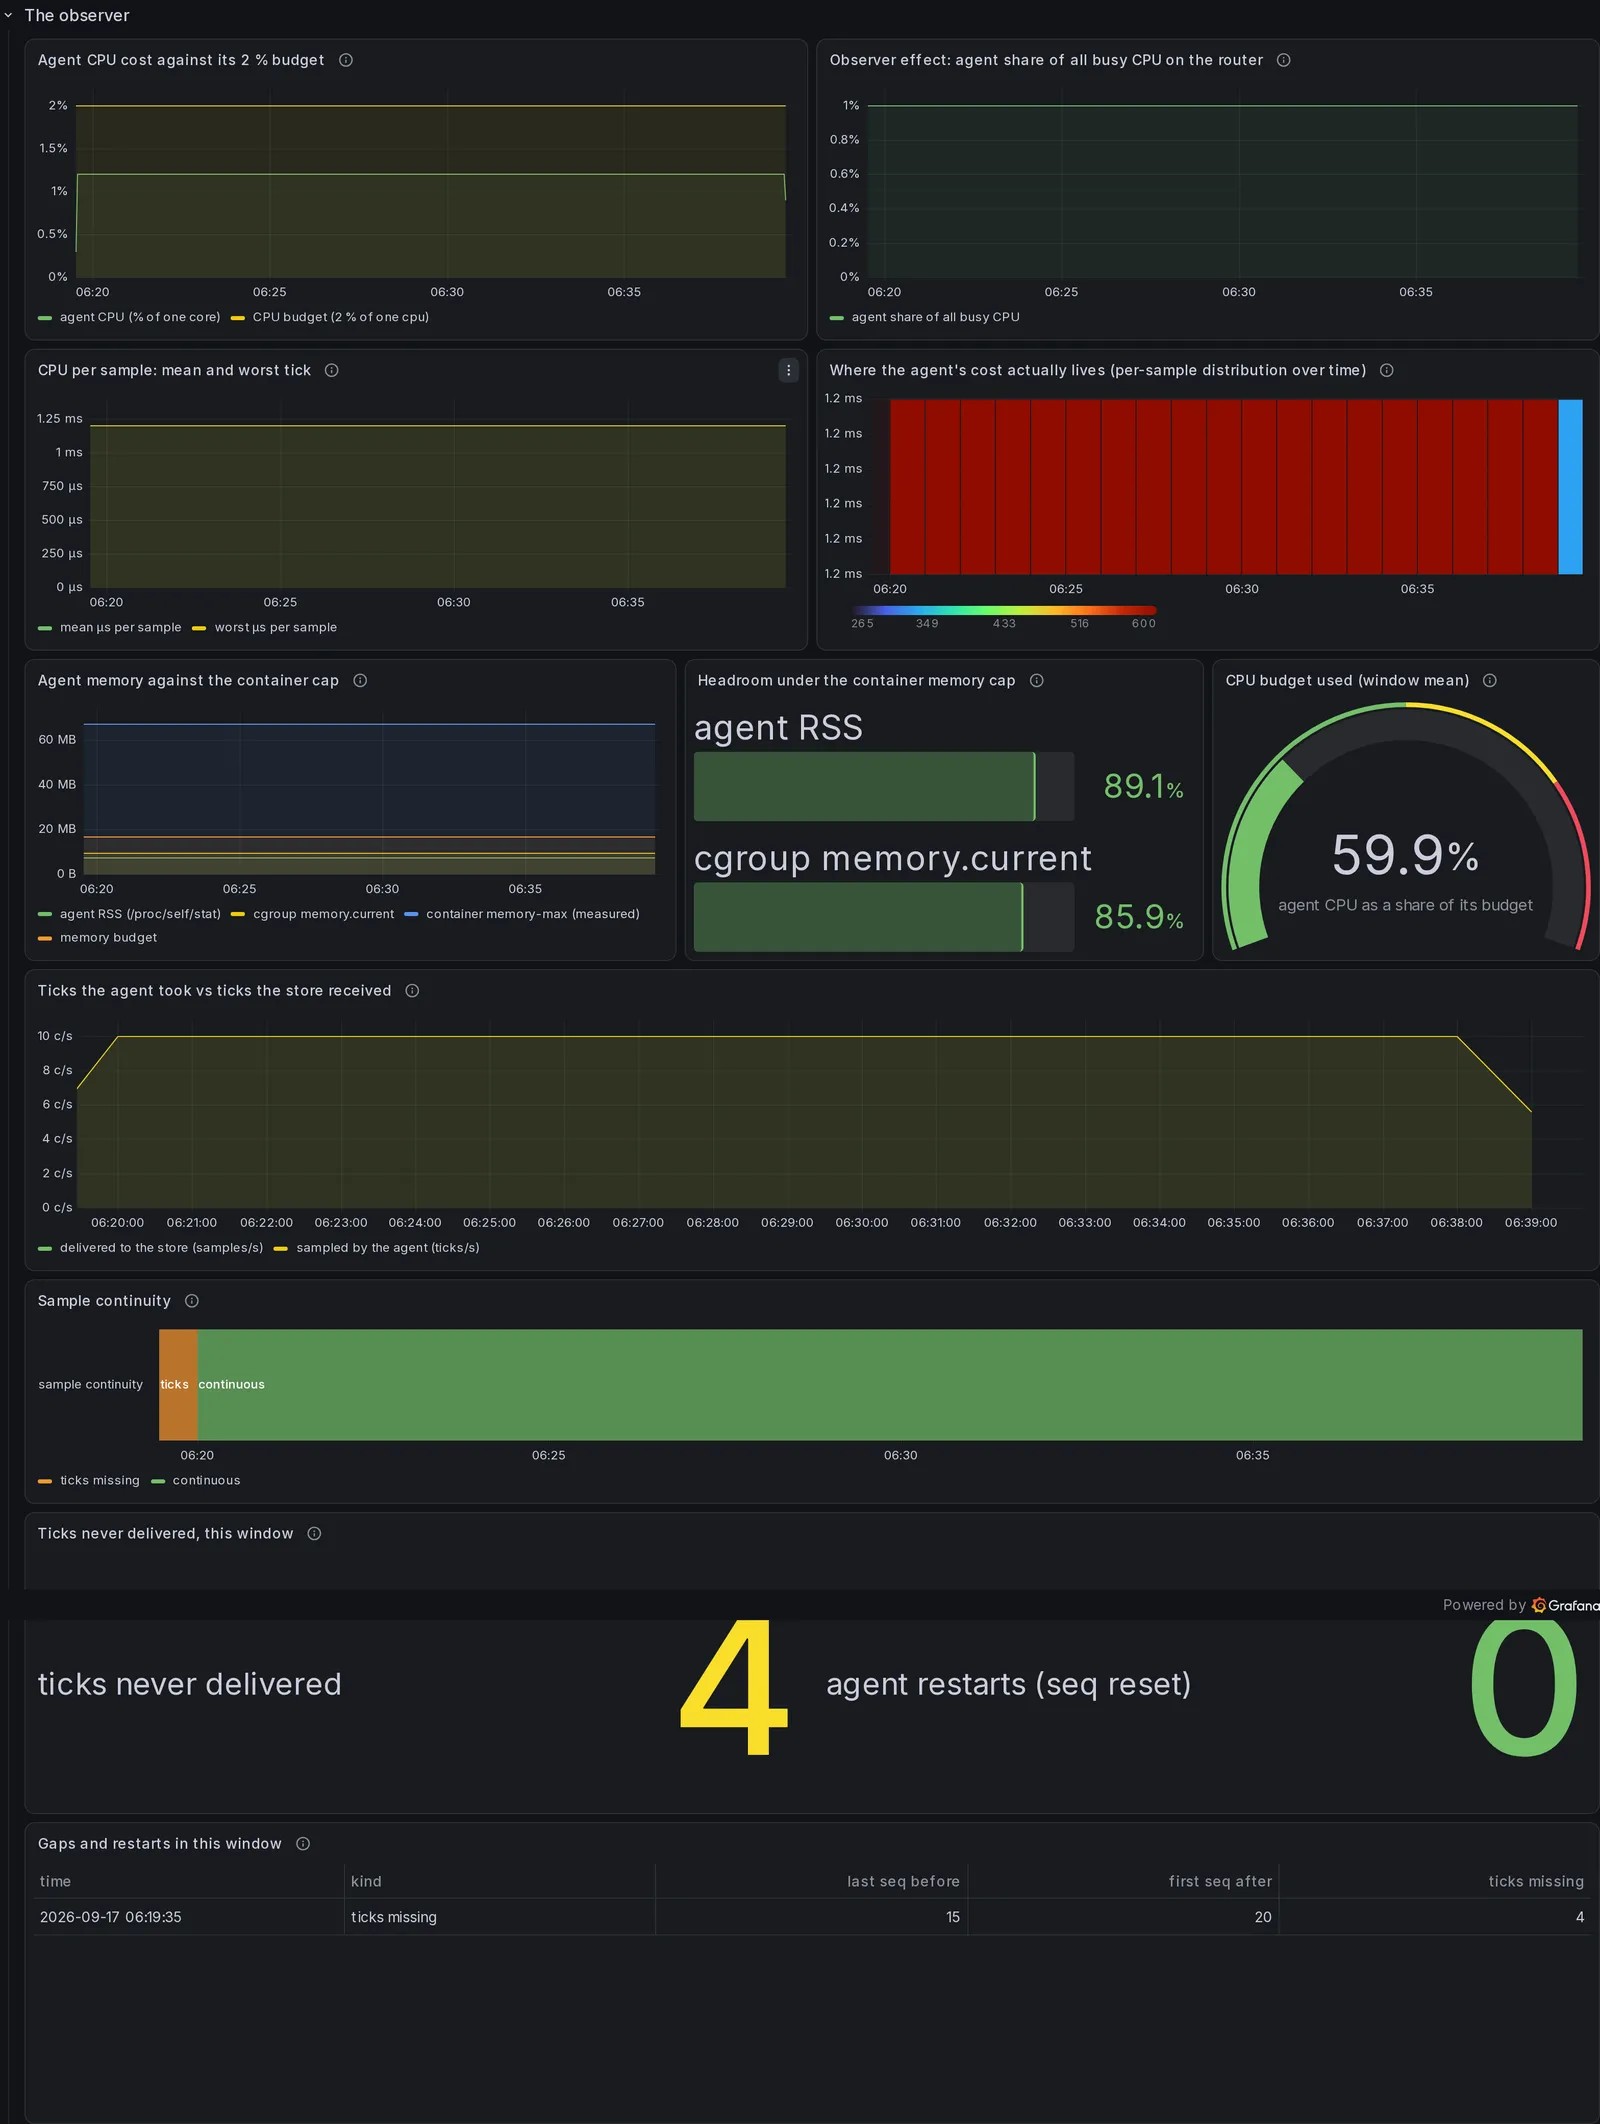

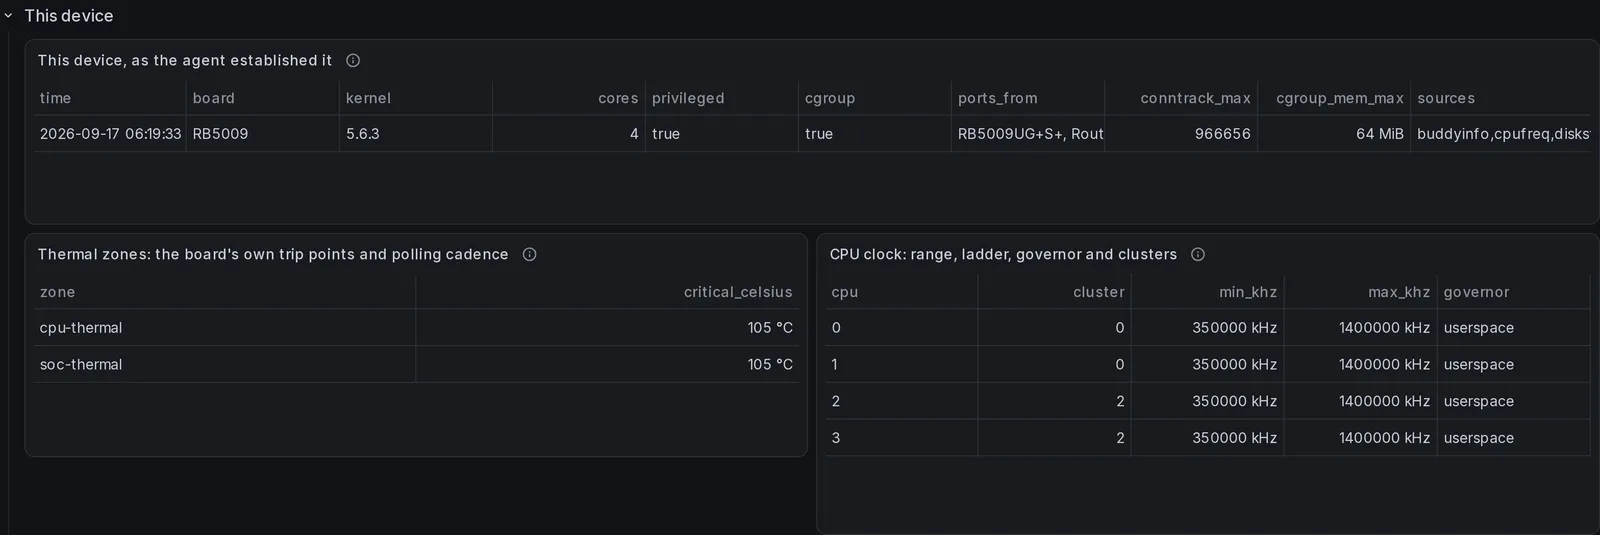
Panels per store
Section titled “Panels per store”Every panel is declared once, with its SQL and its PromQL side by side, so a panel added to one store is added to the other. Where a panel has no query for one store, the generator drops it from that store’s dashboard rather than shipping it to read “No data” forever. A section all of whose panels are dropped emits no row at all.
That is why the counts differ, and they differ in both directions. Most of the thermal and clock
family, the flash wear section, the slab census and several memory panels have SQL and no PromQL,
so they exist only on InfluxDB. Three things exist only on Prometheus, because none of them is
written to InfluxDB: the trigger suppressions, the busy run still in progress and the age of each
held reading, all exposition families on the collector’s /metrics. The sampler’s timing
histograms and the capture budget are on the collector’s /metrics too, but also have an InfluxDB
form. Each panel below that is on one store only says which.
| Section (Grafana row) | InfluxDB 3 | Prometheus | PostgreSQL | Graphite | Elasticsearch |
|---|---|---|---|---|---|
| Overview | 13 | 13 | 12 | 10 | 6 |
| CPU and scheduler | 11 | 9 | 11 | 1 | no row |
| Memory and load | 9 | 9 | 9 | 7 | 5 |
| Connections | 9 | 3 | 9 | 1 | 1 |
| Interface traffic | 14 | 12 | 10 | 2 | no row |
| Detections and captures | 6 | 4 | 6 | no row | no row |
| Network receive path | 9 | 7 | 9 | 3 | 3 |
| Forwarding cost (derived) | 4 | 4 | 4 | no row | no row |
| Interrupts and softirqs | 12 | 10 | 12 | 2 | 2 |
| Temperature and clock | 10 | 2 | 10 | 2 | 2 |
| Kernel log | 7 | 6 | no row | no row | no row |
| CPU: how long a core stayed busy | 3 | 4 | 3 | no row | no row |
| Memory: fragmentation | 3 | 1 | no row | no row | no row |
| Memory: reclaim and page faults | 8 | 6 | 8 | 2 | 1 |
| Memory: detail and cross-checks | 5 | 3 | 5 | 1 | 1 |
| Hardware counters (PMU) | 11 | 7 | 11 | no row | no row |
| Flash wear | 7 | no row | 7 | 1 | 1 |
| NAND health (ECC) | 2 | 2 | 2 | no row | no row |
| RouterOS API cross-checks — CPU and memory | 9 | 9 | 9 | 1 | no row |
| The observer | 11 | 9 | 10 | 3 | 3 |
| The observer: sampler timing and self events | 6 | 7 | 6 | no row | no row |
| This device | 3 | 3 | 3 | no row | no row |
| Not available on this device | 5 | 5 | 5 | 3 | 3 |
| Total | 177 | 135 | 161 | 39 | 28 |
Scroll sideways to see every column
The counts are those of the committed files, which carry the compiled defaults.
dashboards import, dashboards publish and forward --grafana ask the datasource what it holds
first and can move panels into or out of the last row, and check checks the dashboard import
would store; see Not available on this device below.
Section order
Section titled “Section order”The sections are ordered by how often they are opened, not by taxonomy:
- the four questions an operator arrives with: how busy the router is, how much memory is left, how many connections it holds and how much traffic is moving;
- what the collector and the agent flagged;
- the families that explain the first four when one looks wrong;
- the deep tiers a reader opens deliberately;
- what mikroscope costs the router it is measuring.
Every section but the Overview ships collapsed. Grafana keeps a collapsed row’s panels inside the row object and runs none of their queries until someone expands it, so the first render asks the store for the Overview’s thirteen panels (twelve on PostgreSQL) and not for all 177.
The defaults are a 3-hour range (now-3h) and a 5-minute refresh. A 15-minute window shows empty
panels while the agent is stopped, and unreadable noise from 100 ms samples while it runs. The slow
refresh is for an expanded section: the slab census and the PMU and per-sample cost heatmaps
return one row per sample, and maxDataPoints does not apply to raw SQL. Set your own range and
refresh for a live investigation.
Overview
Section titled “Overview”Overview is the only section expanded by default. It shows whether the router is healthy now, and first whether its numbers can be trusted.
- Aggregates only. No panel is a heatmap or a join across measurements, and every panel returns an aggregate. Three tiles (“Reboots in the window”, “Sample continuity” and “Ticks never delivered, this window”) compute theirs with a window function over the window’s raw samples.
- Copies. Most panels are copies of panels in a later section, because a Grafana panel belongs to exactly one row. The copies share their SQL. On Prometheus, the Overview’s “OOM kills in the window” and the Observer’s “Ticks never delivered, this window” differ from their counterparts: the Observer’s carries a third query, the sampler’s slipped ticks.
- Only here. “Connections tracked right now”, “Load average (1 min) against the core count”, “Reboots in the window”, “Detections in the window” and “Port errors in the window”. On Prometheus, “OOM kills in the window” too: the Reclaim section’s copy has no PromQL and is dropped.
- CPU busy per core, Memory in use, against the kernel’s own total (
(MemTotal − MemAvailable) / MemTotalover time, with dashed lines at 75 % and 90 %) and Connections tracked right now (thenf_conntrackslab’s active objects; blank on an unprivileged container, and the tile says so). - Interface throughput — rx above, tx below (API tier; blank with
--api-mode off, and the tile names the flag), Die temperature by zone and Load average (1 min) against the core count, where the core count is measured from the store rather than assumed. - Sample continuity, full width: each bin, never narrower than a minute, classified as continuous, ticks missing or agent restarted from the first difference of the sample sequence number. On Prometheus, which has no sequence number, the lane approximates this from the collector’s gap counter and resets of the agent’s sample counter, and its description says so. Every other panel on the dashboard should be read against this lane.
- Packets dropped in the kernel RX path (window total), OOM kills in the window, Reboots in the window and Detections in the window — each zero on a healthy device and colored on its own thresholds.
- Port errors in the window (every typed MAC error on every port, summed; API tier, blank with
--api-mode off) and Ticks never delivered, this window, which also counts agent restarts.
The Overview is 31 grid units tall on InfluxDB, Prometheus and PostgreSQL, row header included (21 on Graphite, 14 on Elasticsearch). Below about 768 px wide, Grafana stacks each 24-column row into one column, so on a phone the Overview runs to several screens (rendered heights).
Everyday sections
Section titled “Everyday sections”CPU and scheduler
Section titled “CPU and scheduler”/proc/stat ticks and the sampler’s own cadence. Every per-core series comes from the data
(GROUP BY cpu, by (cpu)), so a 2-core and an 8-core board each draw their own lines.
- CPU busy per core
- Busy per core, p95 of one-second means
- Worst sample interval, relative to the window's median
- Per-core busy as states — which core paid, and when
- Where the ticks went — device share by mode
- softirq share of busy time, per core
- Busy-tick distribution per sample
- Share of samples the tick counter called completely idle
- Cycles retired in samples /proc/stat called idle — InfluxDB only
- nice, irq and iowait ticks in the window
- Tick accounting closes — InfluxDB only
Memory and load
Section titled “Memory and load”The levels from /proc/meminfo and /proc/loadavg, averaged or maxed over a bin and never summed.
Every “percent of RAM” divides by the kernel’s own emitted total.
- Memory in use, against the kernel's own total
- Load average, all three windows
- Runnable threads out of total
- Memory by category, as a share of total
- Free memory — three definitions, against the ceiling
- Commit headroom — Committed_AS as a share of CommitLimit
- Load average (1 min) per core
- Threads on the whole router
- Slab — the conntrack and route tables the netns hides
Connections
Section titled “Connections”The router’s connection table from the global slab allocator (/proc/slabinfo, privileged only),
next to the API tier’s count where it is polled. An empty section here means an unprivileged agent,
not an idle router; the “Slab caches reporting” tile exists to say which.
- Connection table, two ways — slab objects against the RouterOS API count
- Connection churn floor — peak-to-trough swing inside each bin — InfluxDB only
- Packet-buffer and large-allocation caches — InfluxDB only
- Every slab cache, normalized to its own window minimum — InfluxDB only
- Connection count distribution over time (nf_conntrack) — InfluxDB only
- Slab census — latest, min, max and spread per cache — InfluxDB only
- Connection table occupancy
- Connections as RouterOS counts them (API poll)
- Slab caches reporting (is this a privileged deployment?) — InfluxDB only
Interface traffic
Section titled “Interface traffic”/interface/, the MAC’s per-port counters and /system/health from the RouterOS
API — the only per-interface counters mikroscope has, because the container’s /proc/net/dev
describes its own veth — beside the configuration the API tier reads at start and every
--labels-every: what each interface is. The rates arrive already per second and are never summed,
and neither are the per-port counters, because RouterOS counts a different thing on each type. A
switch port counts its wire, hardware-forwarded frames included; the bridge counts its CPU side; a
VLAN or a PPPoE counts what the CPU sent and received. A switch port and the bridge are therefore
different planes, and neither is a subset of the other (measured).
The rate panels’ interface set is whatever --interfaces selected, so an interface missing from
one may be idle, unconfigured or not selected, and the three look the same.
- Interface throughput — rx above, tx below
- Interface packet rate — rx above, tx below
- Mean packet size per interface
- CPU cost of forwarding: cpu-load against the busiest interface's packet rate — InfluxDB only
- Port errors per bin — typed, from the MAC counters
- Where a port's receive bytes went — switched in hardware, CPU fast path, CPU slow path — InfluxDB only
- Link flaps — link-downs per interface, per bin
- Frame size mix over the window, per Ethernet port
- Egress queue drops — the router's own transmit queue
- Packets the interface itself dropped — rx and tx
- What each interface is: type, role, bridge and label
- Interface inventory and window summary
- /system/health sensors, as RouterOS reads them
- API tier coverage — which sources delivered, and when
“What each interface is: type, role, bridge and label” is the table to read before two interface
series are compared: one row per interface the router has — RouterOS type, interface lists, the
bridge it is a port of, its comment, its default name and its MTU — from three configuration reads,
never per poll. “Frame size mix over the window, per Ethernet port” is one row per port and carries
no total: each tx-rx-* counter holds both directions of its own port, so a frame switched from
ether1 to ether8 is counted on both, and a sum over ports counts every switched frame twice.
“Interface inventory and window summary” carries no error columns, because monitor-traffic
returns no error rate (verified); the MAC’s typed error counters
have their own panel.
Events
Section titled “Events”Detections and captures
Section titled “Detections and captures”Events, not levels: what the collector’s derive stage and the agent’s
triggered capture said about the window. Empty is the healthy state,
and the event panels are marked known-empty so that check does not fail on it.
- Detections per bin, by rule
- Memory pressure state
- Detections in this window — InfluxDB only
- Trigger fires and suppressions per bin
- Captures held on the agent, and the budget they pin
- Trigger markers in this window — InfluxDB only
In “Trigger fires and suppressions per bin”, the suppressions are on Prometheus only: the collector renders them into its exposition and no store carries a field for them.
Detection annotations
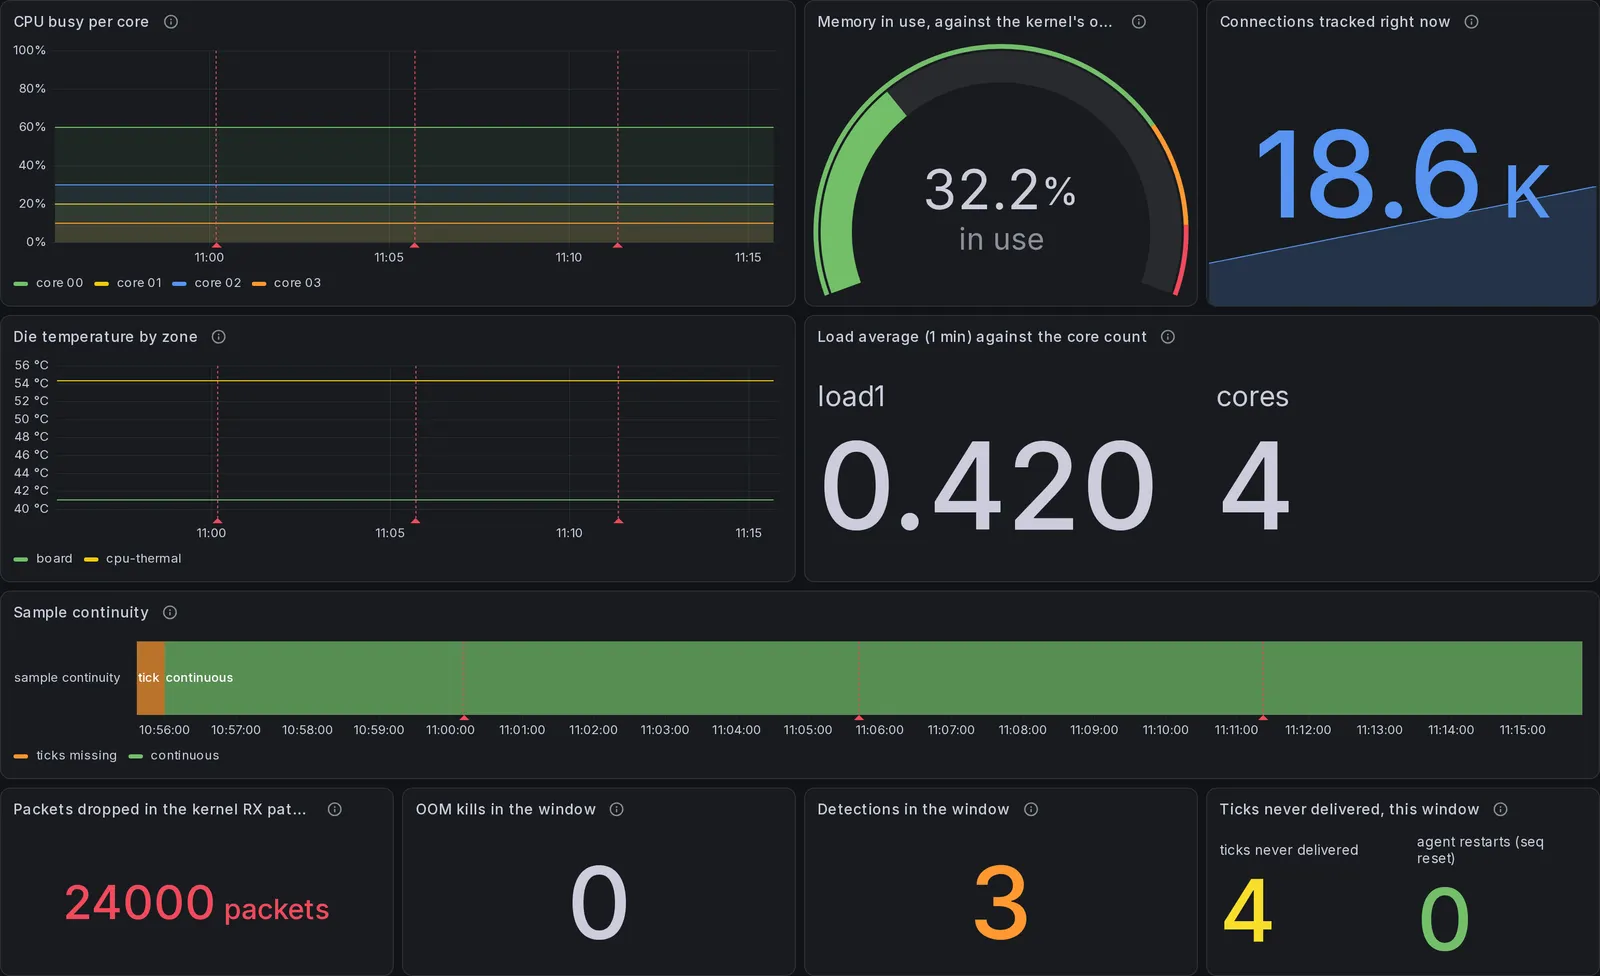
Section titled “Detection annotations”A dashboard with detections in its window draws a vertical red dashed line, with a small triangle at the foot of the axis, across every panel at the instant of each one. They are annotations, not data: not a gap in the record, not a slipped tick, not a break in the series. They let you read whatever panel you are on next to what the collector flagged at that moment — a memory-stall regime on one core, a microburst on one queue, a link that flapped — without scrolling to the Detections section.
Two layers ship with every dashboard:
| Layer | Colour | Default | What each marker is |
|---|---|---|---|
| detections | red | on; off after an InfluxDB probe that finds no mikroscope_detection |
one row of mikroscope_detection: rule: message, from the collector’s derive stage |
| triggers | orange | off | one capture marker from the agent: the condition that fired, the field and the value |
Scroll sideways to see every column
Hovering a marker shows the message the row carries, so the line answers what as well as when.
A rule that fires per key (a core, a port, a thermal zone) opens its message with that key, so the
marker reads, for example, microburst: cpu0: …. The SQL does not read the key column: the
InfluxDB sink writes it only when a detection has one, and six rules never do, so a store whose
detections are all of those has no such column and a query naming it fails. The triggers layer is
off by default so that a quiet dashboard stays quiet; turn it on when you are working with
triggered captures.
Before the first detection. An InfluxDB store has no mikroscope_detection table until the
collector writes its first detection, and InfluxDB 3 refuses a query that names a missing table;
no form of the query avoids that (forms tried).
dashboards import, dashboards publish and forward --grafana ask the store first, and when the
table is not there they ship the detections layer switched off, with its query kept, so you can
switch it on later. The committed
files and a manual import have nobody
to ask, so the layer stays on: its query fails on every load and refresh without showing anything
on the dashboard, and Grafana logs an error-level Partial data response error line each time
(observed). The markers appear on their own once the first
detection creates the table. On Prometheus the counter is simply absent and the query returns an
empty result, so the layer stays on after a probe too. The PostgreSQL sink creates every table
before its first insert, so there the query returns no rows until the first detection
(checked in the container suite). On one Grafana version
tested, the InfluxDB layer’s query is never sent, with or without the table, and no marker is drawn
(known issue).
Turning them off. Both layers are checkboxes in the submenu row under the dashboard title — the same row a dashboard’s variables sit in, which on the InfluxDB, Prometheus and PostgreSQL dashboards holds nothing else. Click the layer’s name to hide its markers. That is a view setting: it lasts for the session, and saving the dashboard keeps it. Nothing about the underlying rows changes, and the Detections section still counts them.
Each store draws the layers from what its sink writes, in its own query language:
- InfluxDB and PostgreSQL: one
mikroscope_detectionormikroscope_triggerrow per marker, with its message. - Prometheus:
increase(…[1m]) > 0at a 1-minute step, so a marker there is the minute, not the instant. - Elasticsearch: a Lucene filter,
kind:detection AND host.(orkeyword:$host kind:trigger), over the event documents. A detection’s text is itsmessageand its tag therule; a trigger document has no message, so its text is thefieldthat crossed and its tag thecause. - Graphite:
aliasByNode($prefix.(or$host. detection.*, 3) .trigger.*), the one point per event the sink writes. Grafana draws a marker at every non-null point and titles it with the series name, which is the rule or the cause. There is no message, because Graphite holds only numbers, and the marker is at the time of the point Grafana gets back: Grafana asks for at most 100 points, so several events close together can come back as one.
The Elasticsearch and Graphite layers are checked by the unit tests against what each sink writes (not run in Grafana): the import check walks panels only.
The section captures further up are taken with both layers off, because the canned fake agent that fills the demonstration database fires a detection every few seconds and twenty minutes of that photographs as a solid red wash. This is the same overview with the detections layer on, over a demonstration store carrying three of them — the density a real deployment produces, and the tile at the bottom right counts the same three:
Diagnostic sections
Section titled “Diagnostic sections”Network receive path
Section titled “Network receive path”/proc/net/softnet_stat, which is global even inside the container’s network namespace. No
absolute packet-rate band survives here: the squeeze regime is banded as a multiple of the window’s
own median.
- RX path: packets processed per second, per core
- Squeeze rate: softirq budget exhaustions per second, per core
- Squeeze pressure: budget exhaustions per 1 000 packets
- Receive-path balance across cores
- Packets dropped in the kernel RX path (window total)
- Squeeze regime per core, as a multiple of this window's median
- Burst distribution: packets per sample (all cores) — InfluxDB only
- Squeeze against throughput (1 s points, whole window) — InfluxDB only
- Packets per NET_RX poll, per core
Forwarding cost (derived)
Section titled “Forwarding cost (derived)”The per-packet ratios and the fast-path share the collector derives across subsystems — PMU against softnet, softnet against interrupts, RouterOS port counters against each other.
The fast-path share is the share of the traffic an interface hands the CPU, not a share of the wire:
fp-rx-byte over driver-rx-byte on a switch port, over rx-byte on a software interface, with
hardware-switched frames in neither number. That split is the “Where a port’s receive bytes went”
panel’s, from the raw counters. The tx line is usually absent: fp-tx-byte can stay 0 on every
interface after hundreds of GB transmitted (observed), so the
collector withholds the tx share while the cumulative counter is 0 rather than draw a 0 % it did
not measure. Per bin the share is bytes-weighted — the bin’s fast-path bytes over the bin’s bytes —
because an interface moving a few packets per poll swings 0–100 % from poll to poll. The Prometheus
form is the collector’s per-poll gauge and keeps that noise.
- Cycles, instructions and cache misses per packet
- Packets per device interrupt (NAPI coalescing depth)
- Fast-path share of the traffic each interface hands the CPU
- Sub-sample bursts: squeezed samples whose packet count looked ordinary
Interrupts and softirqs
Section titled “Interrupts and softirqs”/proc/interrupts and /proc/softirqs deltas. The device name is recovered from the raw
/proc/interrupts text in the query, not matched against a driver name.
- Interrupts per second by source (top-K)
- Per-line interrupt load on the device with the most lines
- Receive-path IRQ imbalance (max / mean across a device's lines)
- Which core takes each interrupt
- Top-K interrupt coverage
- Interrupt mix right now
- Top-K membership — which interrupt sources the agent was watching — InfluxDB only
- NET_RX softirq invocations per core
- Softirq invocations by kind (all CPUs)
- NET_RX burst size distribution per sample — InfluxDB only
- µs of softirq CPU per invocation
- NET_TX and TASKLET softirq invocations per second
Temperature and clock
Section titled “Temperature and clock”/sys/class/thermal and cpufreq. Every thermal threshold is measured from the zone’s own critical
trip point, read from the board: the headroom panel’s thresholds sit at 10 °C and 5 °C of remaining
margin below it. No panel carries a temperature the board did not publish.
- Die temperature by zone
- Temperature by source — kernel zones, and the RouterOS sensor when it is polled — InfluxDB only
- Thermal slope, °C per minute by zone
- Sensor step dwell — where each zone actually sat — InfluxDB only
- Latest temperature by zone — InfluxDB only
- Thermal headroom — how far each zone is from its own critical trip — InfluxDB only
- Gap between the hottest and coolest thermal zone — InfluxDB only
- Core clock per core — governor state — InfluxDB only
- Is the clock pinned? — InfluxDB only
- Clock-weighted work: effective Hz per core — InfluxDB only
Kernel log
Section titled “Kernel log”/dev/kmsg, privileged only. The log is not absent when it is empty, it is silent, and silence is
the healthy state.
- Worst kernel-log severity in each bin
- Kernel-log records per second by severity
- Warning-or-worse kernel-log rate now
- Kernel records in the window, by severity
- Kernel records per sample — burst distribution against the per-tick cap — InfluxDB only
- Port events from the kernel log, per port and kind
- Port events in the window, per port
Two of them read the kernel records that name a network port:
- Port events from the kernel log, per port and kind counts them per bin, one series per port and kind.
- Port events in the window, per port is the census beside it: one row per port, with the label, the role and a column per kind.
How a port record is built and read:
- Kind. Each record carries one: link-up, link-down,
stp-<state>, own-address (the bridge receiving a frame with its own MAC as the source, the layer-2 loop signature) or other. The agent classifies it as it reads/dev/kmsg; the collector classifies records from an agent that does not. - Name and labels. The collector replaces the board’s default port name with the interface’s current RouterOS name and attaches its comment and interface lists from the API tier’s inventory. Without the API tier the record keeps the default name and gets no label.
- Cost and blind spot. This per-port view comes free with the container: the kernel log costs the router nothing and dates each transition to the microsecond, where the RouterOS per-port counters need an API read every poll. It is blind to anything the kernel never hears of, the hardware-switched frames included.
- STP sequence. A link-up is followed by stp-blocking, stp-learning and stp-forwarding on its bridge port: four records, not four faults.
- Known-empty. Both panels are marked known-empty, because a quiet set of ports is the healthy state.
- Prometheus. The Prometheus form reads the collector’s
/metrics, where every port record carries akindbecause the collector classifies whatever reaches it unclassified.
On InfluxDB the mikroscope_kmsg table is created by the first kernel record written, and its
kind column by the first port record written with one. On a router whose kernel has not spoken
since the collector started, the table does not exist and InfluxDB 3 refuses the query when it plans
it; the collapsed section keeps that query from running until someone opens it. The code calls this
a mitigation, not a fix. A probed publish, dashboards import or the collector’s, routes those
panels into the not-available row instead.
Deep-dive sections
Section titled “Deep-dive sections”CPU: how long a core stayed busy
Section titled “CPU: how long a core stayed busy”Contiguity, which no per-sample histogram can recover: a 2 s plateau and twenty scattered spikes
bin the same. On InfluxDB the run lengths are a query over the raw samples; on Prometheus they are
the upper edge of the largest populated bucket of mikroscope_, clamped at
60 s, so 60 reads as “longer than a minute”, not as a measurement.
- Longest run at or above 90 % busy, per cpu
- Longest run at or above 50 % busy, per cpu
- Busy run in progress right now — Prometheus only
- Blocked tasks and forks
Memory: fragmentation
Section titled “Memory: fragmentation”/proc/buddyinfo, the one memory number /proc/meminfo cannot give.
- Free memory by block order (pages) — InfluxDB only
- Free blocks per order (count)
- Largest block order with any free block — InfluxDB only
Memory: reclaim and page faults
Section titled “Memory: reclaim and page faults”The /proc/vmstat deltas, summed or rated over a bin and never averaged — a separate section from
the levels so the two kinds of reducer cannot be mixed.
- Reclaim efficiency — pgsteal ÷ pgscan
- Did the kernel have to reclaim at all?
- Allocation distress — stalls and swap
- OOM kills in the window — InfluxDB only
- Page churn — allocate, free, and the net
- Page faults — minor and major per second
- Minor-fault bursts — distribution per sample — InfluxDB only
- Context switches and all interrupts per second
Memory: detail and cross-checks
Section titled “Memory: detail and cross-checks”Writeback, the LRU, the small levels, and two panels that validate the instrument itself. These are read once per new device, not during an incident.
- Writeback backlog — dirty pages and pages in flight
- LRU balance — active vs inactive
- Mapped, kernel stacks and page tables
- vmstat pages vs meminfo kB — unit cross-check — InfluxDB only
- Kernel stack per thread — InfluxDB only
Hardware counters (PMU)
Section titled “Hardware counters (PMU)”perf_event_open from the privileged container. Every panel divides two raw counts; the
clock-normalized ones divide by the frequency the kernel reported for that core in that sample.
- IPC per core (instructions retired / cycles)
- Beneath the tick floor: PMU cycles against /proc/stat busy ticks — InfluxDB only
- Instructions retired while /proc/stat reported the core idle — InfluxDB only
- Work the jiffie threw away (selected range) — InfluxDB only
- Core cycles per bus cycle
- Unhalted-cycle fraction of the clock, per core
- Distribution of cycles per sample, as a share of the clock (all cores pooled) — InfluxDB only
- Cache-miss rate per core (misses / references)
- Cache misses per 1 000 instructions (MPKI), per core
- Branch mispredictions per 1 000 instructions per core
- PMU counters this CPU actually opened
Flash wear
Section titled “Flash wear”/proc/yaffs, the only NAND wear signal on a RouterBOARD. InfluxDB only: the section has no row on
the Prometheus dashboard. No panel can show a share of the partition, because the agent does not
parse the partition’s block range, so there is no denominator for one.
- Flash page traffic per YAFFS partition (pages/s)
- Write amplification — GC copies per page write
- Flash housekeeping — erasures, garbage collections and GC copies per bin
- YAFFS free-chunk drift within the window (chunks, relative to the first sample)
- YAFFS partition state over the window
- Bad blocks retired during the window, per YAFFS partition
- Page writes and erasures per day, at the window's rate
NAND health (ECC)
Section titled “NAND health (ECC)”The MTD ECC counters under /sys/class/mtd, privileged only — the flash’s leading indicator, where
the YAFFS bad-block count is the post-mortem.
- ECC corrections since boot, per partition, against the bitflip threshold
- Uncorrectable ECC failures and bad blocks, per partition
RouterOS API cross-checks — CPU and memory
Section titled “RouterOS API cross-checks — CPU and memory”/system/resource and /system/resource/cpu: the independent tier the kernel figures are checked
against. RouterOS recomputes these once per second, so every field is 1 Hz at best and
integer-quantized; no panel here claims a sub-second reading.
- RouterOS cpu-load vs kernel busy — do the two tiers agree?
- Cross-tier residual: cpu-load − kernel busy, distribution
- Per-core load, RouterOS's own accounting
- Per-core mean over the window: RouterOS load next to kernel busy
- Per-core IRQ time as RouterOS accounts it, against kernel softirq+system
- Per-core disk time (RouterOS) — max over the window
- RAM used, as RouterOS accounts it
- Free memory: RouterOS free-memory vs the kernel's two answers
- RouterOS uptime
Observer sections
Section titled “Observer sections”The observer
Section titled “The observer”What mikroscope costs the router it is measuring, and whether it was running. On InfluxDB, continuity is derived from the sequence number of every sample (Prometheus approximates it, as in the Overview), which can reveal missing ticks and restarts that the collector’s gap record does not show (example).
- Agent CPU cost against its 2 % budget
- Observer effect: agent share of all busy CPU on the router
- CPU per sample: mean and worst tick
- Where the agent's cost actually lives (per-sample distribution over time) — InfluxDB only
- Agent memory against the container cap
- Headroom under the container memory cap
- CPU budget used (window mean)
- Ticks the agent took vs ticks the store received
- Sample continuity
- Ticks never delivered, this window
- Gaps and restarts in this window — InfluxDB only
The observer: sampler timing and self events
Section titled “The observer: sampler timing and self events”The sampler’s own smear — how late it woke and how long the read took — and the cgroup events the
agent records about itself. The timings ride in each sample’s self block as wake_ns and
read_ns, so all three heatmaps exist on the InfluxDB and PostgreSQL dashboards as well as on
Prometheus.
- Tick interval distribution, relative to the nominal period
- Wake latency: how late the sampler ran after its ticker
- Read duration: how long every source took to read
- Counter resets the agent saw
- The container's own throttling and OOM kills
- How each level source is read
- Age of each held reading — Prometheus only
This device
Section titled “This device”The device-info stream: what the agent established about the board at start with no RouterOS API — identity, ceilings, the frequency ladder.
- This device, as the agent established it
- Thermal zones: the board's own trip points and polling cadence
- CPU clock: range, ladder, governor and clusters
Not available on this device
Section titled “Not available on this device”The last row is titled “Not available on this device — measurements this kernel or board does not produce (open to read why)” and is collapsed. A panel whose measurement the store does not hold is moved out of its own section into this row, where its description says what it is waiting for.
In the committed files — the compiled defaults, which are what plain gen writes and what a manual
upload into Grafana gets — the row holds five panels: the PSI panel and the four block-device
panels. On Graphite and Elasticsearch it holds three: the queue-depth and busy-percent panels have
no query in either store’s language, so those two dashboards leave them out.
- Pressure stall (PSI), where the kernel exposes it
- Block-device queue depth (requests in flight)
- Block-device requests per second (reads and writes completed)
- Block-device busy percent (io_s / wall time)
- Block-device throughput (sectors → bytes per second)
The PSI panel needs a kernel with /proc/pressure. The block-device panels need a block device
that moves: the agent drops a block device whose reads, writes and in-flight count are all zero in a
tick, so on a router whose listed devices all stay at zero no sink ever creates the table. The
compiled defaults put both here because the device they were built against produces neither
(which device).
On InfluxDB every query in this row ships switched off (hidden, in Grafana’s query editor), so
opening the row runs nothing and each panel shows a short note instead of data
(rendered). If your store does hold the measurement,
switch the panel’s queries back on in its editor, or publish the dashboard again with
dashboards import, dashboards publish or a restart of a collector run with --grafana
(InfluxDB and Prometheus; the other three cannot be probed), which asks the store and moves the
panel back into its own section.
On the other four stores the row keeps its queries on, because there a missing measurement is
not an error. The PostgreSQL sink creates every table, mikroscope_psi and mikroscope_disk
included, before its first insert, so the queries return no rows; Prometheus answers an absent
metric with an empty result, and Graphite a path that matches nothing with an empty body.
Elasticsearch answers with a line at zero: a sum over documents that lack the field is 0 in every
bucket, even when another router in the same index has mapped the field
(checked in the container suite). A zero there is a value, not
an empty result, and it cannot tell a router that lacks the measurement from one whose values add
up to zero: the row’s title, not the line, is what says the measurement is not produced. The
queries stay on so that a router that does produce the measurement fills the panel with no edit; on
PostgreSQL, Graphite and Elasticsearch no probe could switch them back on. After a probe, on any
store, a panel the probe found missing ships with its queries switched off, as on InfluxDB.
Two sections are declared for these panels, Pressure stall (PSI) and Block devices, and ship
no row while every panel in them is absent. On a kernel built with PSI, or a board with USB or eMMC
storage that moves, import, or the collector at its next start, finds the measurement and the
section appears in its place, queries on, with no edit to the generator. That takes a store import can probe, InfluxDB or Prometheus;
the other three cannot be probed and keep the compiled row. import also works the other way: on a
store that lacks a measurement the compiled defaults expect — or a field added after that store was
first written — the panel moves into this row with its queries switched off, so it shows its
explanation and not a red error badge. How the probe decides is on
Set up in Grafana.
Ratios, gaps and units
Section titled “Ratios, gaps and units”- Ratios are never the agent’s. The agent ships raw counters only, never percentages.
A ratio on these dashboards is computed either in the panel’s own query or by the collector’s
derive stage (the Forwarding cost section and the
mikroscope_derived*families). The API tier’s interface rates are the exception: they arrive from RouterOS already computed. - Short holes are not drawn. A line is broken where two neighbouring points are more than 5 minutes apart. The threshold has to exceed the widest bin a reader selects — at a 2-day range a 12-column panel’s bin is about 4 minutes — so a hole shorter than 5 minutes is still drawn as an interpolated line. Read holes from Sample continuity, not from the shape of a line.
- Stat numbers are a fixed size. A stat tile draws its value at 32 px and its title at 16 px instead of Grafana’s automatic size, which fills the panel: on a phone, where every panel is full width, the automatic size turns each stat tile into a large block of the screen.
- No device is compiled in. No title, query or threshold names a device, its core count, its interfaces or its memory size; the only fixed numbers are mikroscope’s own budget targets (2 % of one core, 16 MiB). A panel description that quotes a measured figure names the device and the date it was measured on, and yours will differ.
Directorydashboards/
- mikroscope-influxdb.json 177 panels, InfluxDB 3 (SQL)
- mikroscope-prometheus.json 135 panels, Prometheus
- mikroscope-postgres.json 161 panels, PostgreSQL / TimescaleDB
- mikroscope-graphite.json 39 panels, Graphite
- mikroscope-elasticsearch.json 28 panels, Elasticsearch
- mikroscope-alerts-influxdb.yaml 14 rules
- mikroscope-alerts-prometheus.yaml 15 rules
- mikroscope-alerts-postgres.yaml 10 rules
mikroscope dashboards gen # writes the eight files into ./dashboards, made if missingmikroscope dashboards gen --out /tmp/dash # or into another directory- Format. Grafana’s shareable export format: the datasource is a
${DS_MIKROSCOPE}placeholder declared in__inputs, there is noid, and theuidis fixed,mikroscope-<store>, one per dashboard, so a re-import updates the same dashboard in place instead of creating a second one. A test asserts that two generations of the InfluxDB dashboard are identical. - Grafana version.
__requiresdeclares Grafana 11.0.0. The panel options are written to the schema Grafana 13.2.1 expects: the xychart’s mark, for one, moved between Grafana 11 and 13. The versions the dashboards have been checked on are on Tested on. - InfluxDB 3. The queries are SQL, and every one is bounded by
$__timeFilter, because InfluxDB 3 Core refuses unbounded scans. Where a column is namedclusterthe SQL quotes it, becauseclusteris a reserved word in DataFusion. - Prometheus. The queries read a Prometheus that scrapes the collector’s
/metrics, and that alone: the kernel tier recomputed from the samples, the collector’s own derived and detection families, and what only the sampler can produce, which reaches the collector as data because the agent serves no exposition of its own. Prometheus 3 renders a histogram’s zero bucket boundary asle="0.0", so a query reading that bucket matchesle=~"0|0.0". The scrape job is on Set up in Grafana.