Source: https://jmrplens.github.io/phonometry/reference/theory/rooms-buildings/
This page collects the theory behind rooms and buildings: impulse-response measurement and the room-acoustic parameters, background-noise criteria, airborne and impact insulation with their single-number ratings and uncertainty, and flanking and absorption prediction. It is part of the [theory reference](/phonometry/reference/theory/); surface scattering and acoustic material characterisation live on [Materials and Surfaces](/phonometry/reference/theory/materials-surfaces/).
## Room noise criteria (ANSI S12.2)
ANSI/ASA S12.2-2019 rates steady background noise in rooms against families of octave-band curves (16 Hz – 8 kHz). The **NC rating** follows the two-step procedure of clause 5.2.2 on the Table 1 curves (NC-15 to NC-70): the speech interference level $\mathrm{SIL} = \tfrac14(L_{500}+L_{1000}+L_{2000}+L_{4000})$ (clause 3.2) selects the NC-(SIL) curve, and if no band exceeds it the spectrum is designated NC-(SIL); otherwise the tangency method (clause 5.2.3) applies: each measured band is interpolated against the tabulated curve values, the rating is the highest per-band index and the band that sets it is the governing band; the interpolation makes the rating continuous (an NC-42.5 is reported as such, not snapped to a curve). Spectra above NC-70 or below NC-15 fall outside the family and are flagged (>NC-70 with the band of maximum exceedance, or 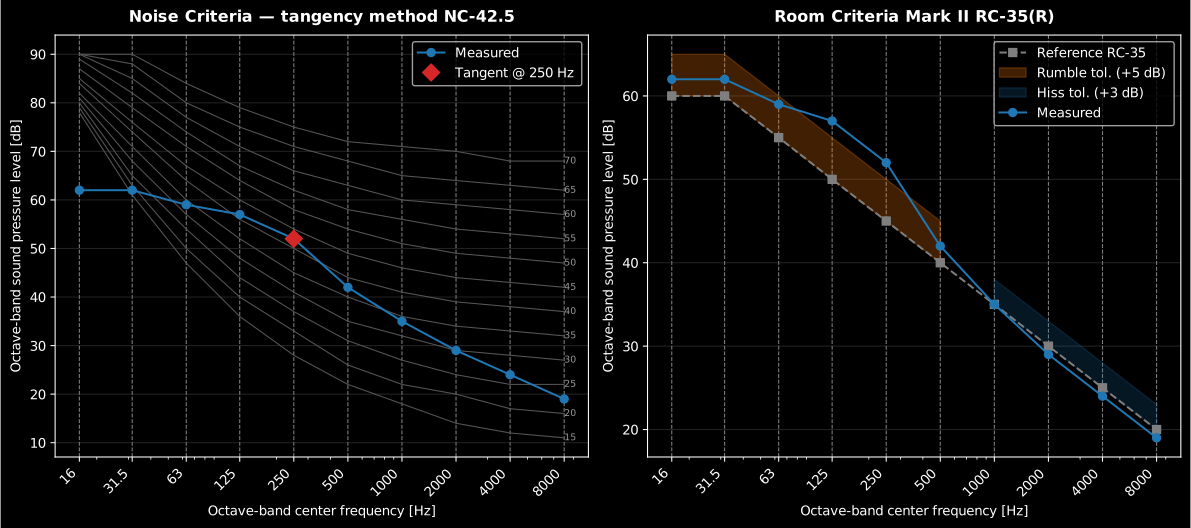 *The same spectrum rated both ways: NC tangency at the governing band (left) and the RC Mark II reference with the rumble excess (right).*
## Room and building acoustics (ISO 18233, ISO 3382, ISO 16283, ISO 10140, EN 12354, ISO 12999, ISO 717, ISO 354)
### Deterministic-excitation impulse response (ISO 18233)
A room/transmission path is modelled as **linear time-invariant**, so its impulse response $h(t)$ carries everything. ISO 18233 replaces the classical noise-burst decay with a deterministic excitation that is **deconvolved** into $h(t)$, gaining 20–30 dB of effective signal-to-noise ratio. The exponential sine sweep (ESS, Annex B) has instantaneous frequency $f(t) = f_1 (f_2/f_1)^{t/T}$, so its phase is the closed-form integral of $2 \pi f(t)$:
$$
\varphi(t) = \frac{2 \pi f_1 T}{\ln(f_2/f_1)} \left[ \left( \frac{f_2}{f_1} \right)^{t/T} - 1 \right] .
$$
A constant time-per-octave makes the ESS spectrum pink (−3 dB/octave). Deconvolution is done by **linear** (non-circular, zero-padded) spectral division $H = Y\ \overline{X} / (|X|^2 + \varepsilon)$, the Tikhonov term $\varepsilon$ (a fraction of $\max |X|^2$) preventing noise blow-up at the band edges. Since a low-to-high sweep places harmonic-distortion products at negative arrival times, they fall in the wrapped tail and are removed by keeping the causal part (Farina). The MLS method (Annex A) instead exploits that the circular autocorrelation of a maximum-length sequence of length $2^N-1$ is a periodic delta, so $h = \operatorname{xcorr}_{\text{circ}}(\text{recorded}, \text{mls}) / 2^N$; synchronous averaging of $n$ periods adds $10 \log_{10} n$ dB.
### Schroeder backward integration (ISO 3382-1, 5.3.3)
The band decay curve is the **backward-integrated** squared IR (Schroeder):
$$
E(t) = \int_t^{\infty} p^2(\tau)\ d\tau = \int_0^{\infty} p^2\ d\tau - \int_0^t p^2\ d\tau , \qquad L(t) = 10 \log_{10} \frac{E(t)}{E(0)}\ \text{dB},
$$
i.e. a reversed cumulative sum in discrete time. Backward integration cancels the random fluctuation of a single squared IR: for a purely exponential energy decay $p^2(t) = e^{-a t}$ it gives $E(t) = e^{-a t}/a$, an exactly straight line $L(t) = -(10 a / \ln 10)\ t$. Background noise flattens $E(t)$, so integration is truncated at the crossing $t_1$ of the fitted decay line with the noise level and the missing tail is compensated by an exponential with the fitted rate; without that term the finite integral systematically **underestimates** $T$.
*The same spectrum rated both ways: NC tangency at the governing band (left) and the RC Mark II reference with the rumble excess (right).*
## Room and building acoustics (ISO 18233, ISO 3382, ISO 16283, ISO 10140, EN 12354, ISO 12999, ISO 717, ISO 354)
### Deterministic-excitation impulse response (ISO 18233)
A room/transmission path is modelled as **linear time-invariant**, so its impulse response $h(t)$ carries everything. ISO 18233 replaces the classical noise-burst decay with a deterministic excitation that is **deconvolved** into $h(t)$, gaining 20–30 dB of effective signal-to-noise ratio. The exponential sine sweep (ESS, Annex B) has instantaneous frequency $f(t) = f_1 (f_2/f_1)^{t/T}$, so its phase is the closed-form integral of $2 \pi f(t)$:
$$
\varphi(t) = \frac{2 \pi f_1 T}{\ln(f_2/f_1)} \left[ \left( \frac{f_2}{f_1} \right)^{t/T} - 1 \right] .
$$
A constant time-per-octave makes the ESS spectrum pink (−3 dB/octave). Deconvolution is done by **linear** (non-circular, zero-padded) spectral division $H = Y\ \overline{X} / (|X|^2 + \varepsilon)$, the Tikhonov term $\varepsilon$ (a fraction of $\max |X|^2$) preventing noise blow-up at the band edges. Since a low-to-high sweep places harmonic-distortion products at negative arrival times, they fall in the wrapped tail and are removed by keeping the causal part (Farina). The MLS method (Annex A) instead exploits that the circular autocorrelation of a maximum-length sequence of length $2^N-1$ is a periodic delta, so $h = \operatorname{xcorr}_{\text{circ}}(\text{recorded}, \text{mls}) / 2^N$; synchronous averaging of $n$ periods adds $10 \log_{10} n$ dB.
### Schroeder backward integration (ISO 3382-1, 5.3.3)
The band decay curve is the **backward-integrated** squared IR (Schroeder):
$$
E(t) = \int_t^{\infty} p^2(\tau)\ d\tau = \int_0^{\infty} p^2\ d\tau - \int_0^t p^2\ d\tau , \qquad L(t) = 10 \log_{10} \frac{E(t)}{E(0)}\ \text{dB},
$$
i.e. a reversed cumulative sum in discrete time. Backward integration cancels the random fluctuation of a single squared IR: for a purely exponential energy decay $p^2(t) = e^{-a t}$ it gives $E(t) = e^{-a t}/a$, an exactly straight line $L(t) = -(10 a / \ln 10)\ t$. Background noise flattens $E(t)$, so integration is truncated at the crossing $t_1$ of the fitted decay line with the noise level and the missing tail is compensated by an exponential with the fitted rate; without that term the finite integral systematically **underestimates** $T$.
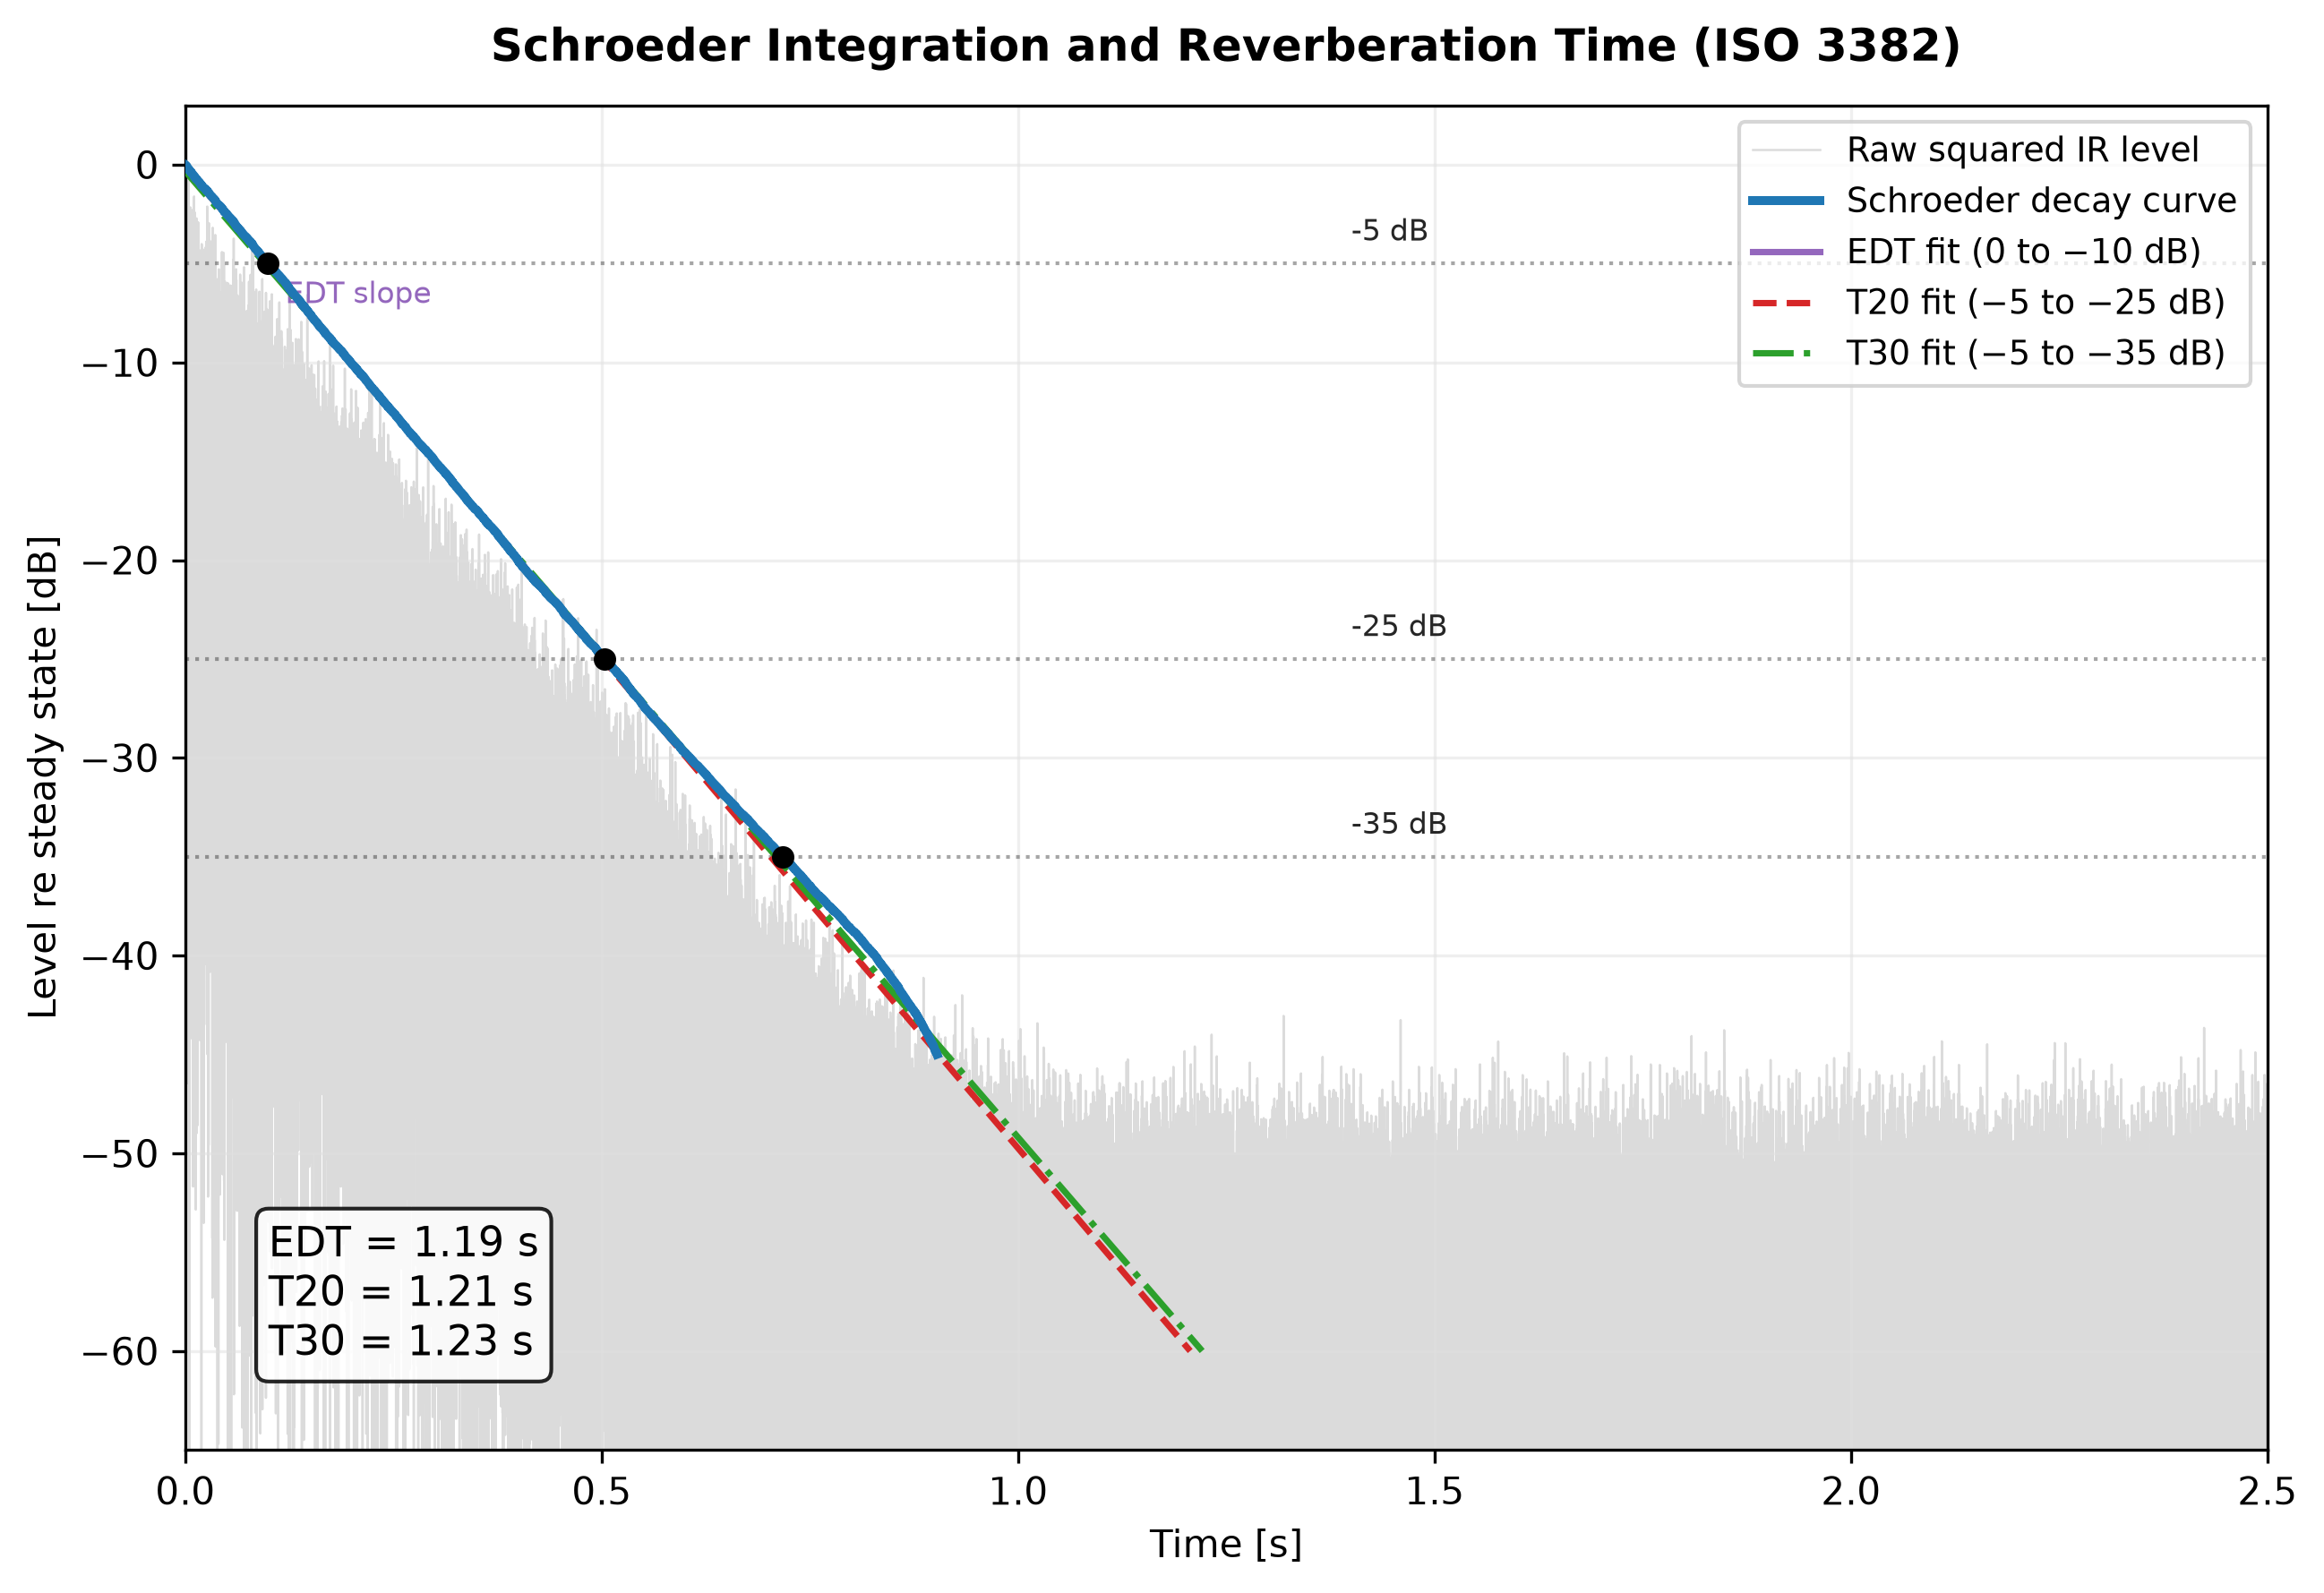
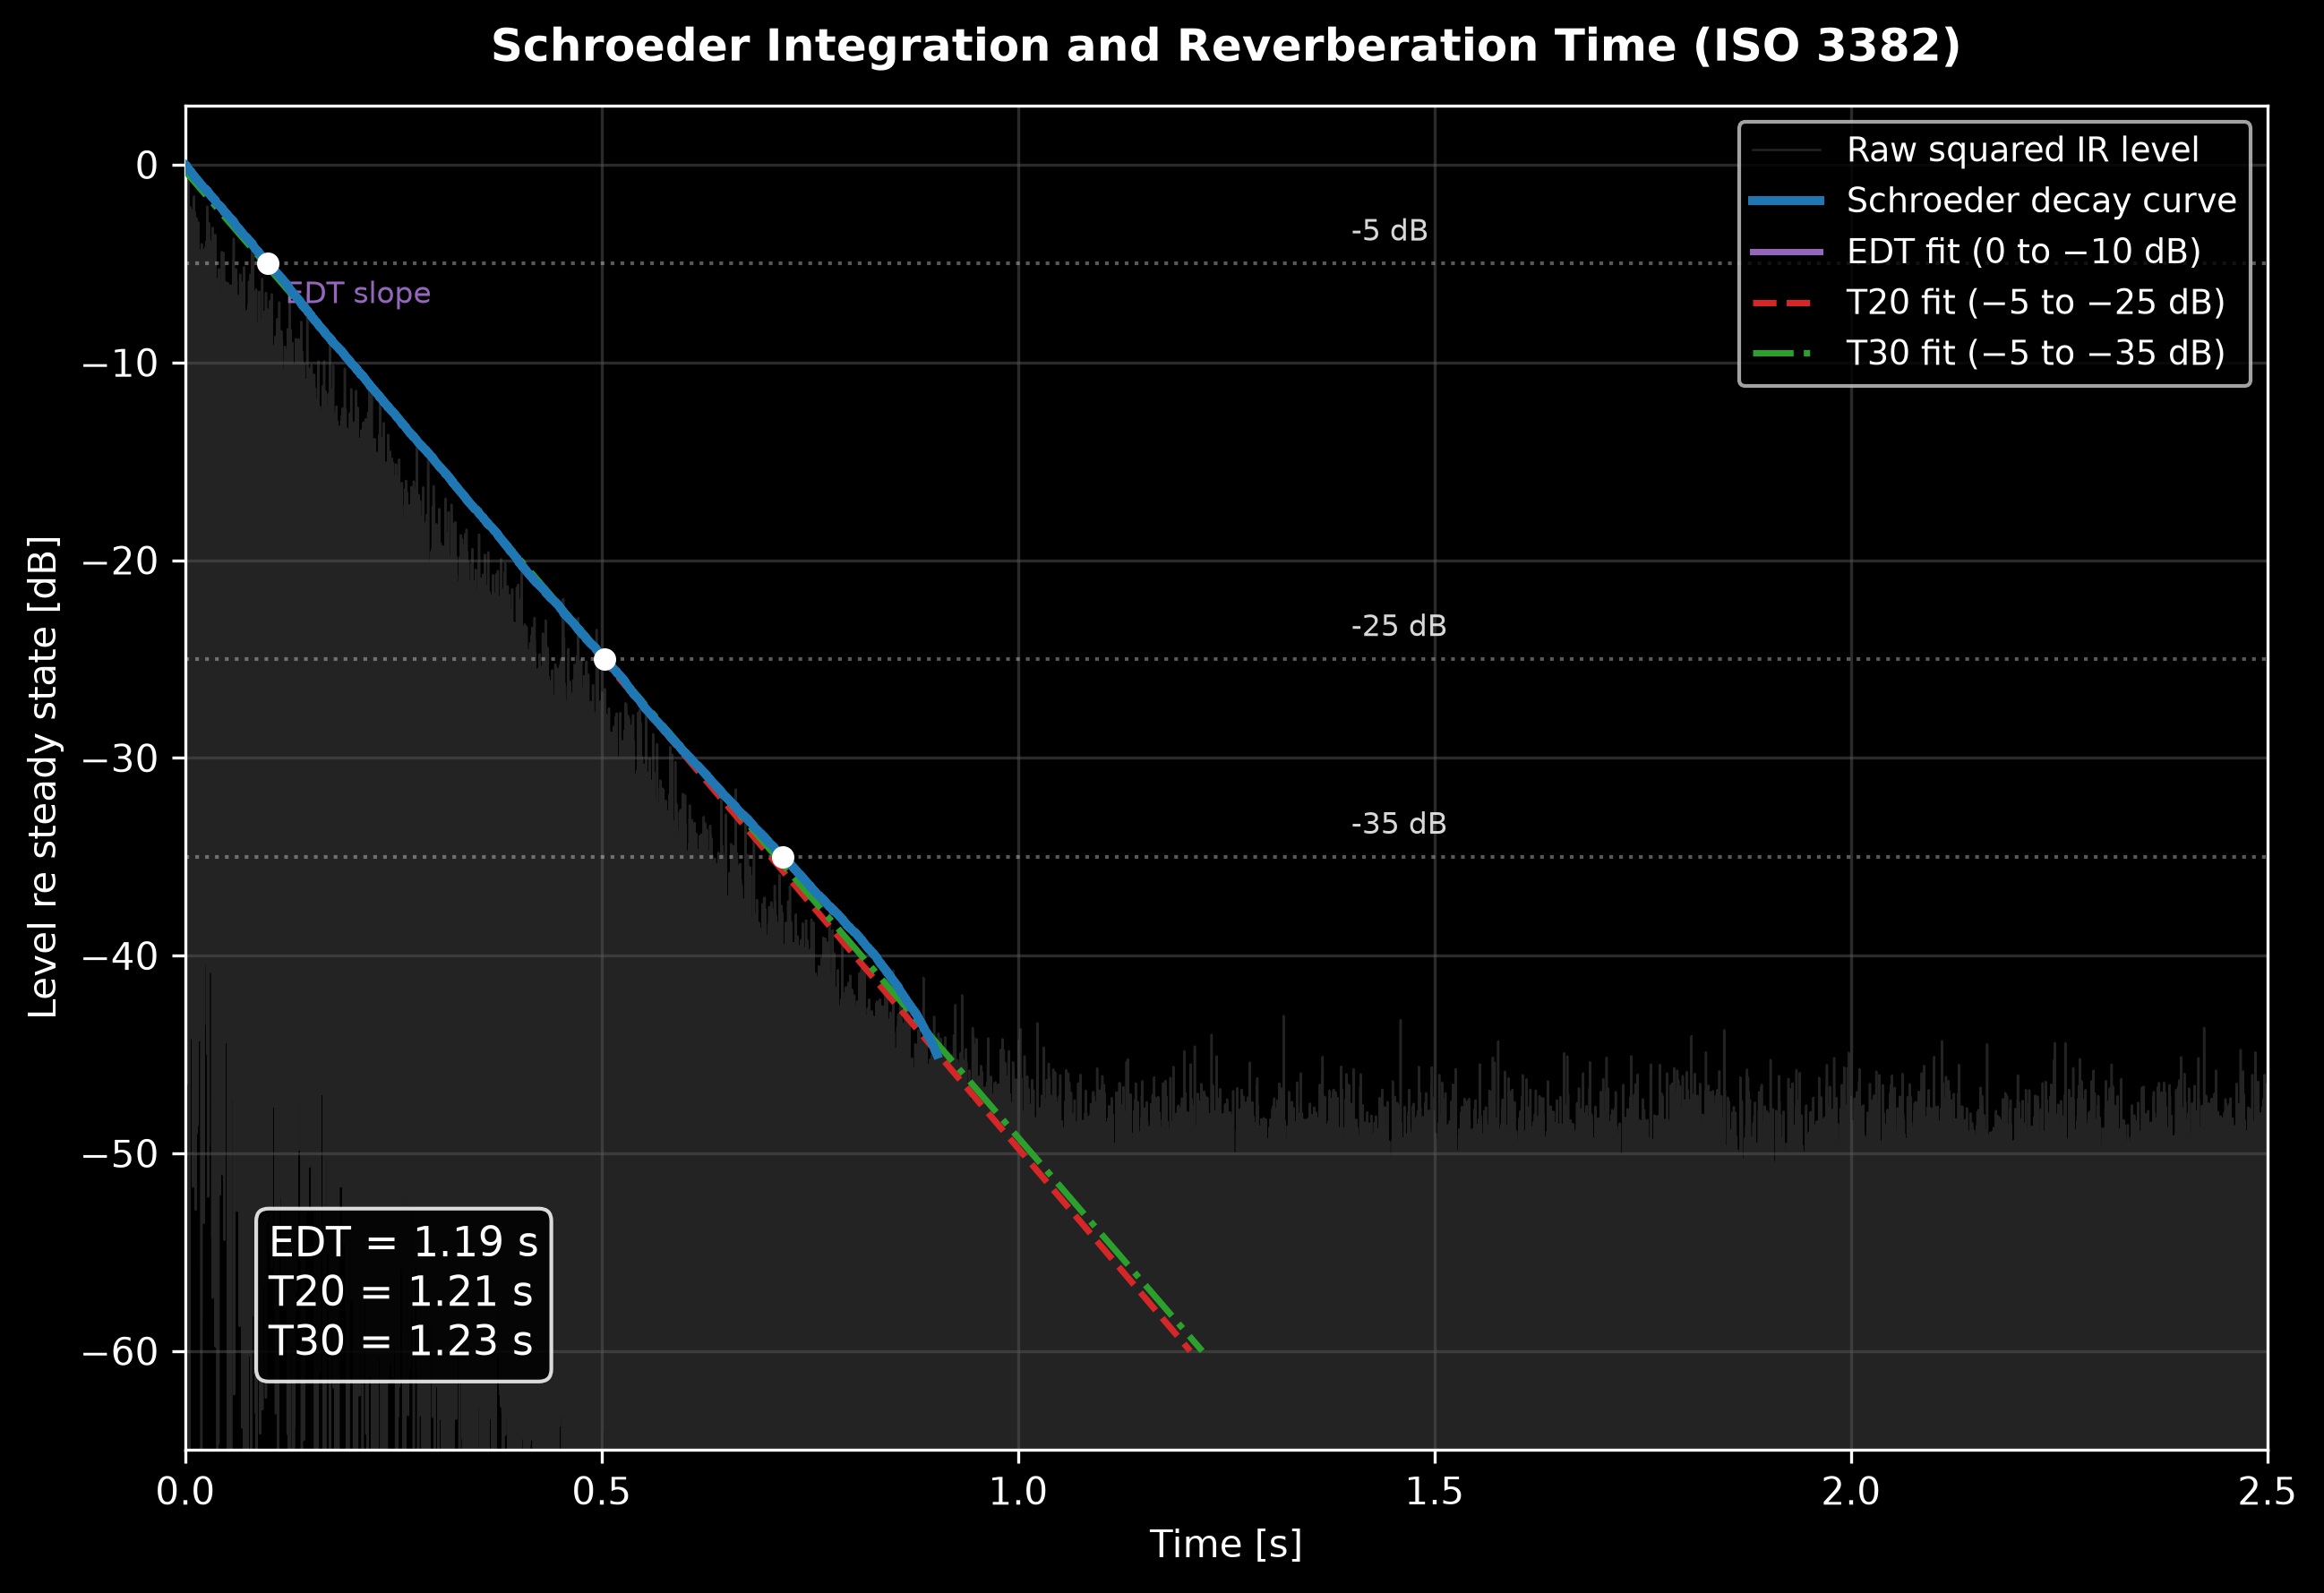 *A squared impulse response, its Schroeder backward integral and the EDT/T20/T30 regression windows of the next subsection.*
### Regression windows and validity (ISO 3382-2, Clause 6, Annex B/C)
Reverberation time is a least-squares fit $L = a + b t$ over a window, extrapolated to 60 dB via $T = -60/b$ (Annex C): **EDT** on 0 to −10 dB, **T20** on −5 to −25 dB, **T30** on −5 to −35 dB. A single-slope decay gives EDT = T20 = T30; a fast early / slow late double slope gives EDT < T30. Validity uses the dynamic-range rule of 5.3.3: the noise must sit at least 25 dB below the IR peak for EDT (evaluation span + 15 dB), tightened to 46 dB for T20 and 54 dB for T30 so the tail-compensation bias of a flagged-valid value stays within the 5 % JND. The **curvature** $C = 100\ (T_{30}/T_{20} - 1)$ % (Annex B) flags a non-straight decay above 10 %.
### Clarity, definition and centre time (ISO 3382-1, Annex A)
Splitting the energy at an early/late boundary $t_e$ gives the early-to-late index and the definition ratio:
$$
C_{te} = 10 \log_{10} \frac{\int_0^{t_e} p^2\ dt}{\int_{t_e}^{\infty} p^2\ dt}\ \text{dB}, \qquad D_{50} = \frac{\int_0^{0.05} p^2\ dt}{\int_0^{\infty} p^2\ dt}, \qquad C_{50} = 10 \log_{10} \frac{D_{50}}{1 - D_{50}},
$$
with $t_e = 50$ ms (C50, speech) or 80 ms (C80, music), and the **centre time** $T_s = \int_0^{\infty} t\ p^2\ dt / \int_0^{\infty} p^2\ dt$. For a pure exponential decay these have closed forms $C_{te} = 10 \log_{10}(e^{a t_e} - 1)$ and $T_s = 1/a$; at $T = 1$ s ($a = 13.8155$) they evaluate to C80 = 3.05 dB, C50 = −0.02 dB, D50 = 0.499 and Ts = 72.4 ms, the values the implementation reproduces. Table A.1 JNDs (EDT 5 %, C80 1 dB, D50 0.05, Ts 10 ms) bound how finely each is worth reporting.
### Open-plan spatial decay (ISO 3382-3, Clause 6)
The spatial decay rate of A-weighted speech is the ordinary least-squares slope of $L_{p,A,S}$ against $\lg(r/r_0)$ ($r_0 = 1$ m) over the 2–16 m positions, rescaled to a per-doubling figure, and the nominal level is read off the same line at 4 m:
$$
L = a + b\ \lg(r/r_0), \qquad D_{2,S} = -\lg(2)\ b, \qquad L_{p,A,S,4\text{m}} = a + b\ \lg(4/r_0).
$$
The distraction distance rD and privacy distance rP are the distances where a **linear** (not logarithmic) regression of STI against distance crosses 0.50 and 0.20; a non-negative fitted slope (STI not falling with distance) makes them undefined, realising the standard's "can prove impossible to determine" note.
### Field insulation and weighted rating (ISO 16283-1, ISO 717-1)
Per one-third-octave band the level difference $D = L_1 - L_2$ (energy-averaged over microphone positions, $L = 10 \log_{10}[(1/n) \sum_i 10^{L_i/10}]$) is normalised two ways: the standardized level difference $D_{nT} = D + 10 \log_{10}(T/T_0)$ with $T_0 = 0.5$ s (so $D_{nT} = D$ when $T = T_0$), and the apparent sound reduction index $R' = D + 10 \log_{10}(S/A)$ with the Sabine absorption area $A = 0.16\ V / T$, hence $R' = D + 10 \log_{10}[S T / (0.16\ V)]$.
The single-number rating (ISO 717-1, Clause 4.4) shifts the Table 3 **reference curve** in 1 dB steps toward the measured curve until the sum of *unfavourable* deviations $\sum_i \max(0, \text{ref}_i + k - \text{meas}_i)$ is maximal but $\le$ 32.0 dB (16 thirds) or 10.0 dB (5 octaves); the rating $R_w$ is the shifted reference at 500 Hz. The **spectrum adaptation terms** are $C = X_{A1} - X_w$ and $C_{tr} = X_{A2} - X_w$ with $X_{Aj} = -10 \log_{10} \sum_i 10^{(L_{ij} - X_i)/10}$ (Table 4 spectra No. 1 pink noise, No. 2 urban traffic), each rounded to an integer. The ISO 717-1 Annex C worked example ($R_w = 30$, $C = -2$, $C_{tr} = -3$, unfavourable sum 31.8 dB) is reproduced exactly.
*A squared impulse response, its Schroeder backward integral and the EDT/T20/T30 regression windows of the next subsection.*
### Regression windows and validity (ISO 3382-2, Clause 6, Annex B/C)
Reverberation time is a least-squares fit $L = a + b t$ over a window, extrapolated to 60 dB via $T = -60/b$ (Annex C): **EDT** on 0 to −10 dB, **T20** on −5 to −25 dB, **T30** on −5 to −35 dB. A single-slope decay gives EDT = T20 = T30; a fast early / slow late double slope gives EDT < T30. Validity uses the dynamic-range rule of 5.3.3: the noise must sit at least 25 dB below the IR peak for EDT (evaluation span + 15 dB), tightened to 46 dB for T20 and 54 dB for T30 so the tail-compensation bias of a flagged-valid value stays within the 5 % JND. The **curvature** $C = 100\ (T_{30}/T_{20} - 1)$ % (Annex B) flags a non-straight decay above 10 %.
### Clarity, definition and centre time (ISO 3382-1, Annex A)
Splitting the energy at an early/late boundary $t_e$ gives the early-to-late index and the definition ratio:
$$
C_{te} = 10 \log_{10} \frac{\int_0^{t_e} p^2\ dt}{\int_{t_e}^{\infty} p^2\ dt}\ \text{dB}, \qquad D_{50} = \frac{\int_0^{0.05} p^2\ dt}{\int_0^{\infty} p^2\ dt}, \qquad C_{50} = 10 \log_{10} \frac{D_{50}}{1 - D_{50}},
$$
with $t_e = 50$ ms (C50, speech) or 80 ms (C80, music), and the **centre time** $T_s = \int_0^{\infty} t\ p^2\ dt / \int_0^{\infty} p^2\ dt$. For a pure exponential decay these have closed forms $C_{te} = 10 \log_{10}(e^{a t_e} - 1)$ and $T_s = 1/a$; at $T = 1$ s ($a = 13.8155$) they evaluate to C80 = 3.05 dB, C50 = −0.02 dB, D50 = 0.499 and Ts = 72.4 ms, the values the implementation reproduces. Table A.1 JNDs (EDT 5 %, C80 1 dB, D50 0.05, Ts 10 ms) bound how finely each is worth reporting.
### Open-plan spatial decay (ISO 3382-3, Clause 6)
The spatial decay rate of A-weighted speech is the ordinary least-squares slope of $L_{p,A,S}$ against $\lg(r/r_0)$ ($r_0 = 1$ m) over the 2–16 m positions, rescaled to a per-doubling figure, and the nominal level is read off the same line at 4 m:
$$
L = a + b\ \lg(r/r_0), \qquad D_{2,S} = -\lg(2)\ b, \qquad L_{p,A,S,4\text{m}} = a + b\ \lg(4/r_0).
$$
The distraction distance rD and privacy distance rP are the distances where a **linear** (not logarithmic) regression of STI against distance crosses 0.50 and 0.20; a non-negative fitted slope (STI not falling with distance) makes them undefined, realising the standard's "can prove impossible to determine" note.
### Field insulation and weighted rating (ISO 16283-1, ISO 717-1)
Per one-third-octave band the level difference $D = L_1 - L_2$ (energy-averaged over microphone positions, $L = 10 \log_{10}[(1/n) \sum_i 10^{L_i/10}]$) is normalised two ways: the standardized level difference $D_{nT} = D + 10 \log_{10}(T/T_0)$ with $T_0 = 0.5$ s (so $D_{nT} = D$ when $T = T_0$), and the apparent sound reduction index $R' = D + 10 \log_{10}(S/A)$ with the Sabine absorption area $A = 0.16\ V / T$, hence $R' = D + 10 \log_{10}[S T / (0.16\ V)]$.
The single-number rating (ISO 717-1, Clause 4.4) shifts the Table 3 **reference curve** in 1 dB steps toward the measured curve until the sum of *unfavourable* deviations $\sum_i \max(0, \text{ref}_i + k - \text{meas}_i)$ is maximal but $\le$ 32.0 dB (16 thirds) or 10.0 dB (5 octaves); the rating $R_w$ is the shifted reference at 500 Hz. The **spectrum adaptation terms** are $C = X_{A1} - X_w$ and $C_{tr} = X_{A2} - X_w$ with $X_{Aj} = -10 \log_{10} \sum_i 10^{(L_{ij} - X_i)/10}$ (Table 4 spectra No. 1 pink noise, No. 2 urban traffic), each rounded to an integer. The ISO 717-1 Annex C worked example ($R_w = 30$, $C = -2$, $C_{tr} = -3$, unfavourable sum 31.8 dB) is reproduced exactly.
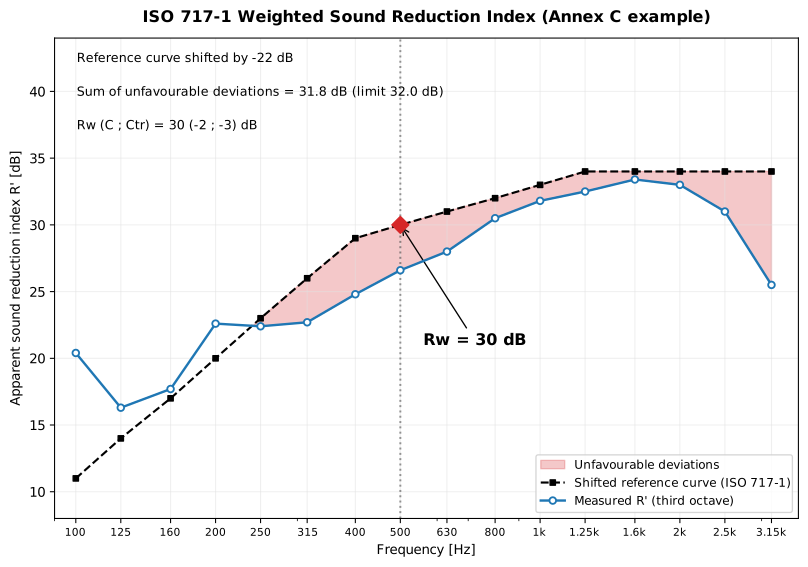
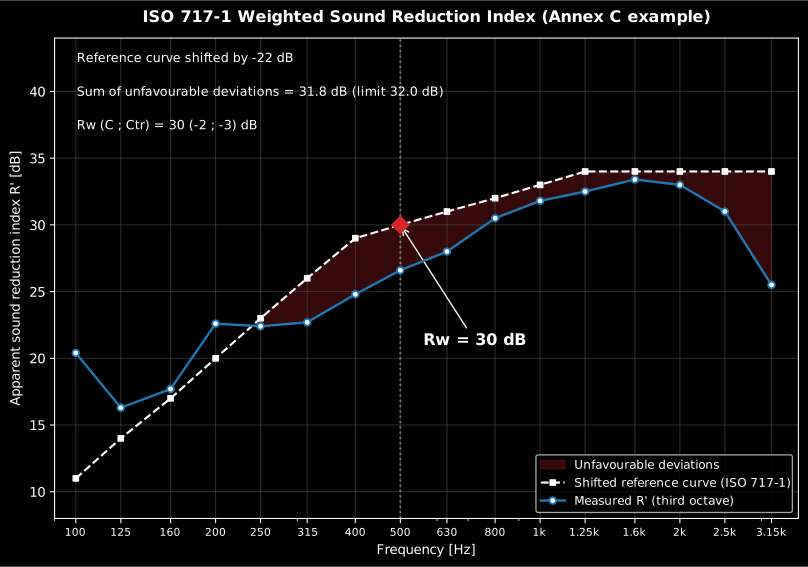 *A measured R spectrum against the shifted ISO 717-1 reference: the rating is the shifted reference read at 500 Hz.*
### Impact insulation and absorption (ISO 16283-2, ISO 717-2, ISO 354)
Impact insulation swaps the airborne source for a standardized **tapping
machine** and rates the receiving-room level, so the sign conventions flip. The
standardized and normalized impact levels are $L'_{nT} = L_i - 10 \log_{10}(T/T_0)$
(the reverberation term is *subtracted*, opposite to $D_{nT}$) and
$L'_n = L_i + 10 \log_{10}(A/A_0)$ with $A_0 = 10$ m² and $A = 0.16\ V/T$. The
ISO 717-2 rating shifts the Table 3 reference curve until $\sum_i \max(0, \text{meas}_i - (\text{ref}_i + k))$
is maximal but $\le$ 32.0 dB (16 thirds) or 10.0 dB (5 octaves); the
*unfavourable* deviation now counts where the **measurement exceeds** the
reference (impact noise is worse when louder), the mirror image of ISO 717-1.
The rating is the shifted reference at 500 Hz, reduced by a further 5 dB for
octave bands, and the adaptation term is $C_I = L_{n,\text{sum}} - 15 - L_{n,w}$
with the energetic sum $L_{n,\text{sum}} = 10 \log_{10} \sum_i 10^{L_i/10}$ over
100–2500 Hz (thirds) or 125–2000 Hz (octaves). The ISO 717-2 Annex C examples
are reproduced exactly (thirds $L_{n,w} = 79$, $C_I = -11$; octaves $54$, $0$),
via the same monotone shift search as ISO 717-1 run on the negated curves.
Sound absorption (ISO 354) measures the equivalent absorption area from
Sabine's relation applied to a reverberation room empty and with the specimen:
$A = 55.3\ V/(c\ T) - 4 V m$ (the $4 V m$ term is the air absorption, $m$ the
power attenuation coefficient in 1/m), so the specimen area is
$A_T = A_2 - A_1$ and its coefficient $\alpha_s = A_T/S$. With the speed of
sound from Eq. (6), $c = 331 + 0.6\ t$ (°C), and $m$ converted from an
ISO 9613-1 attenuation coefficient by $m = \alpha / (10 \lg e)$. Because
diffraction and edge scattering intercept more than the flat sample area,
$\alpha_s$ is left unclamped and may exceed 1.0 (Clause 3.7 NOTE 2).
### Laboratory vs field normalization (ISO 10140, ISO 16283)
The field indices carry a prime because they include flanking transmission
around the partition; the laboratory indices do not, because a qualified
facility suppresses it. The algebra is otherwise identical, differing only in
which quantity is normalised. The airborne pair is the direct laboratory sound
reduction index $R = L_1 - L_2 + 10 \log_{10}(S/A)$ (ISO 10140-2) versus the
apparent field index $R' = L_1 - L_2 + 10 \log_{10}(S/A)$ (ISO 16283-1), the
same closed form evaluated with the facility's known $A$ or the room's measured
$A = 0.16\ V/T$. The impact pair is the normalized laboratory level
$L_n = L_i + 10 \log_{10}(A/A_0)$ (ISO 10140-3) versus the field $L'_n$
(ISO 16283-2), both referenced to $A_0 = 10$ m². Before either is formed the
receiving-room level is corrected for background noise by the energy
subtraction $L = 10 \log_{10}(10^{L_{sb}/10} - 10^{L_b/10})$ for a 6–15 dB
signal-to-background margin, capped at a fixed $1.3$ dB (the limit of
measurement) at or below 6 dB and omitted at or above 15 dB (ISO 10140-4,
Clause 4.3), the laboratory analogue of the 6/10 dB rule of ISO 16283-1. The
façade extension (ISO 16283-3) replaces the source-room level by the level 2 m
in front of the façade, $D_{2m} = L_{1,2m} - L_2$, and adds a fixed
angle-of-incidence correction to the element sound reduction index, $-1.5$ dB
for the 45° loudspeaker method ($R'_{45°}$) and $-3$ dB for the all-angle
road-traffic method ($R'_{tr,s}$); all three carry the ISO 717-1 airborne
single number.
### Flanking transmission prediction (EN 12354-1/2)
The apparent field index is the energetic sum of the direct path $Dd$ and, for
each flanking element $F=f$ across its junction with the separating element, the
three paths $Ff$, $Df$ and $Fd$ (EN 12354-1, simplified single-number model,
Formula 26):
$$
R'_w = -10 \log_{10}\Big[ 10^{-R_{Dd,w}/10}
+ \sum 10^{-R_{Ff,w}/10} + \sum 10^{-R_{Df,w}/10}
+ \sum 10^{-R_{Fd,w}/10} \Big].
$$
The direct path is $R_{Dd,w} = R_{s,w} + \Delta R_{Dd,w}$ (Formula 27), the
separating-element laboratory index plus any lining improvement. Each flanking
path (Formula 28a) is
$$
R_{ij,w} = \frac{R_{i,w} + R_{j,w}}{2} + \Delta R_{ij,w} + K_{ij}
+ 10 \log_{10}\frac{S_s}{l_0\ l_f},
$$
with $R_{i,w}$, $R_{j,w}$ the laboratory indices of the two elements meeting at
the junction ($i$ source side, $j$ receiving side), $\Delta R_{ij,w}$ the
combined lining improvement, $S_s$ the separating-element area, $l_f$ the
junction coupling length and $l_0 = 1$ m the reference coupling length. $K_{ij}$
is the junction **vibration reduction index** (Annex E), an empirical function of
the mass ratio $M = \log_{10}(m'_{\perp,i}/m'_i)$: for a rigid cross-junction
$K_{13} = 8.7 + 17.1 M + 5.7 M^2$ (through) and $K_{12} = 8.7 + 5.7 M^2$
(corner), read at 500 Hz, and floored at $K_{ij,\min} = 10 \log_{10}[l_f\ l_0
(1/S_i + 1/S_j)]$ (Formula 29). Two linings combine as $\max(a,b) + \min(a,b)/2$
(Formulas 30/31). The impact counterpart (EN 12354-2, Formula 21) is the direct
subtraction $L'_{n,w} = L_{n,w,eq} - \Delta L_w + K$, with the bare-floor
equivalent level $L_{n,w,eq} = 164 - 35 \log_{10}(m'/m'_0)$ (Annex B), the
covering improvement $\Delta L_w$ (ISO 717-2) and the flanking correction $K$
from Table 1. The EN 12354-1 Annex H.3 ($R'_w = 52$ dB) and EN 12354-2 Annex E.3
($L'_{n,w} = 45$ dB) worked examples are reproduced exactly; the simplified
model is stated to have about a 2 dB standard deviation (Clause 5).
### Absorption in enclosed spaces (EN 12354-6)
EN 12354-6:2003 predicts the equivalent absorption area of a room from its
parts (the normative Clause 4 model). The total (Formula 1) sums the surfaces,
the objects and the air:
$$
A = \sum_i \alpha_{s,i}\ S_i + \sum_j A_{obj,j} + \sum_k \alpha_{s,k}\ S_k + A_{air},
\qquad A_{air} = 4\ m\ V\ (1 - \psi),
$$
with $m$ the power attenuation coefficient of air (Formula 2; Table 1
tabulates it for six temperature/humidity climates over the octave bands
125 Hz – 8 kHz), $\psi = \sum V_{obj} / V$ the volume fraction occupied by
objects (Formula 3), and a hard irregular object approximated by
$A_{obj} = V_{obj}^{2/3}$ (Formula 4). The reverberation time follows from
Sabine applied to the free volume (clause 4.4, Formula 5):
$$
T = \frac{55.3}{c_0}\ \frac{V\ (1 - \psi)}{A},
$$
with $c_0 = 345.6$ m/s chosen so that $55.3/c_0$ is the familiar $0.16$
(clause 4.4 NOTE). The three Annex E worked cases are reproduced: the
bare 29.75 m³ room gives $A = 2.26$ m² and $T = 2.1$ s at 1 kHz, and adding
hard objects ($\psi \approx 0.072$) raises $A$ to 5.03 m² and drops $T$ to
0.9 s. The informative Annex D method for irregular spaces and unevenly
distributed absorption is out of scope.
See the [Enclosed-Space Absorption guide](/phonometry/guides/enclosed-space-absorption/) for usage.
### Measurement uncertainty (ISO 12999-1)
ISO 12999-1 supplies the uncertainty of the quantities above from
inter-laboratory (ISO 5725) reproducibility and repeatability rather than a
GUM functional model. Three **measurement situations** fix the standard
uncertainty $u$: situation **A** (laboratory characterisation) uses the
reproducibility standard deviation $\sigma_R$; situation **B** (same location,
different teams) the in-situ $\sigma_{situ}$; situation **C** (same location,
operator and equipment, repeated) the repeatability $\sigma_r$. The per-band and
single-number values are tabulated for airborne $R$/$R'$/$D_n$/$D_{nT}$
(Tables 2/3), impact $L_n$/$L'_n$ (Table 4 bands, situations B/C only; Table 5
ratings adding a situation-A estimate) and the
covering reduction $\Delta L$ (Tables 6/7, situation A only). The expanded
uncertainty is $U = k\ u$ (Formula 2) with the coverage factor $k$ of Table 8
(at 95 %, $k = 1.96$ two-sided, $k = 1.65$ one-sided; a minimum $k = 1$ is
enforced). A two-sided interval $Y = y \pm U$ reports a value (Formula 3); a
one-sided factor declares conformity, $y - U > $ requirement for a lower limit
(Formula 5) or $y + U <$ requirement for an upper limit (Formula 4).
Uncorrelated components combine in quadrature $u_c = \sqrt{\sum u_i^2}$
(Formula C.2), $m$ independent measurements reduce $u$ to $u/\sqrt{m}$
(Formula A.7), and the uncorrelated single-number uncertainty is the
energy-weighted quadrature sum of the band uncertainties (Formula B.2).
See the [Room Acoustics](/phonometry/guides/room-acoustics/) and
[Field Insulation Measurement and Ratings](/phonometry/guides/insulation-field/) guides for usage.
### Predicted panel sound insulation (Bies 7.2, Hopkins 2.9/4.3.10, Cremer 5)
Where EN 12354 takes the element $R$ as a measurement, the sound reduction index
of a panel can also be **predicted** from its physical properties. A limp panel
follows the mass law $TL_0 = 10\lg[1 + (\pi f m''/\rho_0 c_0)^2]$ (Bies Eq. 7.40),
which rises 6 dB per octave and 6 dB per doubling of the surface mass $m''$; the
field-incidence value subtracts 5.5 dB (one-third octave). Stiffness adds a
**coincidence dip** at $f_c = (c_0^2/2\pi)\sqrt{m''/B'}$ (Eq. 7.3), where the free
bending wavelength matches the acoustic trace wavelength. Sharp's method holds
the mass law to $f_c/2$, drops linearly in $\log f$ to the dip
$TL = 20\lg(f_c m'') + 10\lg\eta - 44$ and rises again above $f_c$ with the loss
factor $\eta$ (Eq. 7.44). A **double wall** is a mass-spring-mass system with the
cavity as the spring: below $f_0 = 60\sqrt{(m_1+m_2)/(m_1 m_2 d)}$ (Eq. 7.62) it
follows the mass law of the combined mass, and above it the two leaves' mass laws
add plus the cavity term $20\lg(2kd)$, saturating at +6 dB beyond
$f_l = c_0/(2\pi d)$ (Eq. 7.64); a porous fill lowers $f_0$. Small air paths cap
any construction: the transmission coefficient of a straight slit (Gomperts,
Hopkins Eq. 4.99, with resonances at $d + 2e = z\lambda/2$) or a circular hole
(Wilson & Soroka, Eq. 4.102) combines with the wall in the area-weighted energy
sum $R = -10\lg[(1/\sum S_n)\sum S_n 10^{-R_n/10}]$ (Eq. 4.92), so a bare opening
of relative area $S_a/S$ limits the composite to $10\lg(S/S_a)$. The resonant
transmission path and the double-wall radiation draw on the plate radiation
efficiency and point mobilities of the
[vibration theory](/phonometry/reference/theory/vibration/).
See the [Predicting Panel Sound Insulation](/phonometry/guides/panel-sound-insulation/)
guide for usage.
*A measured R spectrum against the shifted ISO 717-1 reference: the rating is the shifted reference read at 500 Hz.*
### Impact insulation and absorption (ISO 16283-2, ISO 717-2, ISO 354)
Impact insulation swaps the airborne source for a standardized **tapping
machine** and rates the receiving-room level, so the sign conventions flip. The
standardized and normalized impact levels are $L'_{nT} = L_i - 10 \log_{10}(T/T_0)$
(the reverberation term is *subtracted*, opposite to $D_{nT}$) and
$L'_n = L_i + 10 \log_{10}(A/A_0)$ with $A_0 = 10$ m² and $A = 0.16\ V/T$. The
ISO 717-2 rating shifts the Table 3 reference curve until $\sum_i \max(0, \text{meas}_i - (\text{ref}_i + k))$
is maximal but $\le$ 32.0 dB (16 thirds) or 10.0 dB (5 octaves); the
*unfavourable* deviation now counts where the **measurement exceeds** the
reference (impact noise is worse when louder), the mirror image of ISO 717-1.
The rating is the shifted reference at 500 Hz, reduced by a further 5 dB for
octave bands, and the adaptation term is $C_I = L_{n,\text{sum}} - 15 - L_{n,w}$
with the energetic sum $L_{n,\text{sum}} = 10 \log_{10} \sum_i 10^{L_i/10}$ over
100–2500 Hz (thirds) or 125–2000 Hz (octaves). The ISO 717-2 Annex C examples
are reproduced exactly (thirds $L_{n,w} = 79$, $C_I = -11$; octaves $54$, $0$),
via the same monotone shift search as ISO 717-1 run on the negated curves.
Sound absorption (ISO 354) measures the equivalent absorption area from
Sabine's relation applied to a reverberation room empty and with the specimen:
$A = 55.3\ V/(c\ T) - 4 V m$ (the $4 V m$ term is the air absorption, $m$ the
power attenuation coefficient in 1/m), so the specimen area is
$A_T = A_2 - A_1$ and its coefficient $\alpha_s = A_T/S$. With the speed of
sound from Eq. (6), $c = 331 + 0.6\ t$ (°C), and $m$ converted from an
ISO 9613-1 attenuation coefficient by $m = \alpha / (10 \lg e)$. Because
diffraction and edge scattering intercept more than the flat sample area,
$\alpha_s$ is left unclamped and may exceed 1.0 (Clause 3.7 NOTE 2).
### Laboratory vs field normalization (ISO 10140, ISO 16283)
The field indices carry a prime because they include flanking transmission
around the partition; the laboratory indices do not, because a qualified
facility suppresses it. The algebra is otherwise identical, differing only in
which quantity is normalised. The airborne pair is the direct laboratory sound
reduction index $R = L_1 - L_2 + 10 \log_{10}(S/A)$ (ISO 10140-2) versus the
apparent field index $R' = L_1 - L_2 + 10 \log_{10}(S/A)$ (ISO 16283-1), the
same closed form evaluated with the facility's known $A$ or the room's measured
$A = 0.16\ V/T$. The impact pair is the normalized laboratory level
$L_n = L_i + 10 \log_{10}(A/A_0)$ (ISO 10140-3) versus the field $L'_n$
(ISO 16283-2), both referenced to $A_0 = 10$ m². Before either is formed the
receiving-room level is corrected for background noise by the energy
subtraction $L = 10 \log_{10}(10^{L_{sb}/10} - 10^{L_b/10})$ for a 6–15 dB
signal-to-background margin, capped at a fixed $1.3$ dB (the limit of
measurement) at or below 6 dB and omitted at or above 15 dB (ISO 10140-4,
Clause 4.3), the laboratory analogue of the 6/10 dB rule of ISO 16283-1. The
façade extension (ISO 16283-3) replaces the source-room level by the level 2 m
in front of the façade, $D_{2m} = L_{1,2m} - L_2$, and adds a fixed
angle-of-incidence correction to the element sound reduction index, $-1.5$ dB
for the 45° loudspeaker method ($R'_{45°}$) and $-3$ dB for the all-angle
road-traffic method ($R'_{tr,s}$); all three carry the ISO 717-1 airborne
single number.
### Flanking transmission prediction (EN 12354-1/2)
The apparent field index is the energetic sum of the direct path $Dd$ and, for
each flanking element $F=f$ across its junction with the separating element, the
three paths $Ff$, $Df$ and $Fd$ (EN 12354-1, simplified single-number model,
Formula 26):
$$
R'_w = -10 \log_{10}\Big[ 10^{-R_{Dd,w}/10}
+ \sum 10^{-R_{Ff,w}/10} + \sum 10^{-R_{Df,w}/10}
+ \sum 10^{-R_{Fd,w}/10} \Big].
$$
The direct path is $R_{Dd,w} = R_{s,w} + \Delta R_{Dd,w}$ (Formula 27), the
separating-element laboratory index plus any lining improvement. Each flanking
path (Formula 28a) is
$$
R_{ij,w} = \frac{R_{i,w} + R_{j,w}}{2} + \Delta R_{ij,w} + K_{ij}
+ 10 \log_{10}\frac{S_s}{l_0\ l_f},
$$
with $R_{i,w}$, $R_{j,w}$ the laboratory indices of the two elements meeting at
the junction ($i$ source side, $j$ receiving side), $\Delta R_{ij,w}$ the
combined lining improvement, $S_s$ the separating-element area, $l_f$ the
junction coupling length and $l_0 = 1$ m the reference coupling length. $K_{ij}$
is the junction **vibration reduction index** (Annex E), an empirical function of
the mass ratio $M = \log_{10}(m'_{\perp,i}/m'_i)$: for a rigid cross-junction
$K_{13} = 8.7 + 17.1 M + 5.7 M^2$ (through) and $K_{12} = 8.7 + 5.7 M^2$
(corner), read at 500 Hz, and floored at $K_{ij,\min} = 10 \log_{10}[l_f\ l_0
(1/S_i + 1/S_j)]$ (Formula 29). Two linings combine as $\max(a,b) + \min(a,b)/2$
(Formulas 30/31). The impact counterpart (EN 12354-2, Formula 21) is the direct
subtraction $L'_{n,w} = L_{n,w,eq} - \Delta L_w + K$, with the bare-floor
equivalent level $L_{n,w,eq} = 164 - 35 \log_{10}(m'/m'_0)$ (Annex B), the
covering improvement $\Delta L_w$ (ISO 717-2) and the flanking correction $K$
from Table 1. The EN 12354-1 Annex H.3 ($R'_w = 52$ dB) and EN 12354-2 Annex E.3
($L'_{n,w} = 45$ dB) worked examples are reproduced exactly; the simplified
model is stated to have about a 2 dB standard deviation (Clause 5).
### Absorption in enclosed spaces (EN 12354-6)
EN 12354-6:2003 predicts the equivalent absorption area of a room from its
parts (the normative Clause 4 model). The total (Formula 1) sums the surfaces,
the objects and the air:
$$
A = \sum_i \alpha_{s,i}\ S_i + \sum_j A_{obj,j} + \sum_k \alpha_{s,k}\ S_k + A_{air},
\qquad A_{air} = 4\ m\ V\ (1 - \psi),
$$
with $m$ the power attenuation coefficient of air (Formula 2; Table 1
tabulates it for six temperature/humidity climates over the octave bands
125 Hz – 8 kHz), $\psi = \sum V_{obj} / V$ the volume fraction occupied by
objects (Formula 3), and a hard irregular object approximated by
$A_{obj} = V_{obj}^{2/3}$ (Formula 4). The reverberation time follows from
Sabine applied to the free volume (clause 4.4, Formula 5):
$$
T = \frac{55.3}{c_0}\ \frac{V\ (1 - \psi)}{A},
$$
with $c_0 = 345.6$ m/s chosen so that $55.3/c_0$ is the familiar $0.16$
(clause 4.4 NOTE). The three Annex E worked cases are reproduced: the
bare 29.75 m³ room gives $A = 2.26$ m² and $T = 2.1$ s at 1 kHz, and adding
hard objects ($\psi \approx 0.072$) raises $A$ to 5.03 m² and drops $T$ to
0.9 s. The informative Annex D method for irregular spaces and unevenly
distributed absorption is out of scope.
See the [Enclosed-Space Absorption guide](/phonometry/guides/enclosed-space-absorption/) for usage.
### Measurement uncertainty (ISO 12999-1)
ISO 12999-1 supplies the uncertainty of the quantities above from
inter-laboratory (ISO 5725) reproducibility and repeatability rather than a
GUM functional model. Three **measurement situations** fix the standard
uncertainty $u$: situation **A** (laboratory characterisation) uses the
reproducibility standard deviation $\sigma_R$; situation **B** (same location,
different teams) the in-situ $\sigma_{situ}$; situation **C** (same location,
operator and equipment, repeated) the repeatability $\sigma_r$. The per-band and
single-number values are tabulated for airborne $R$/$R'$/$D_n$/$D_{nT}$
(Tables 2/3), impact $L_n$/$L'_n$ (Table 4 bands, situations B/C only; Table 5
ratings adding a situation-A estimate) and the
covering reduction $\Delta L$ (Tables 6/7, situation A only). The expanded
uncertainty is $U = k\ u$ (Formula 2) with the coverage factor $k$ of Table 8
(at 95 %, $k = 1.96$ two-sided, $k = 1.65$ one-sided; a minimum $k = 1$ is
enforced). A two-sided interval $Y = y \pm U$ reports a value (Formula 3); a
one-sided factor declares conformity, $y - U > $ requirement for a lower limit
(Formula 5) or $y + U <$ requirement for an upper limit (Formula 4).
Uncorrelated components combine in quadrature $u_c = \sqrt{\sum u_i^2}$
(Formula C.2), $m$ independent measurements reduce $u$ to $u/\sqrt{m}$
(Formula A.7), and the uncorrelated single-number uncertainty is the
energy-weighted quadrature sum of the band uncertainties (Formula B.2).
See the [Room Acoustics](/phonometry/guides/room-acoustics/) and
[Field Insulation Measurement and Ratings](/phonometry/guides/insulation-field/) guides for usage.
### Predicted panel sound insulation (Bies 7.2, Hopkins 2.9/4.3.10, Cremer 5)
Where EN 12354 takes the element $R$ as a measurement, the sound reduction index
of a panel can also be **predicted** from its physical properties. A limp panel
follows the mass law $TL_0 = 10\lg[1 + (\pi f m''/\rho_0 c_0)^2]$ (Bies Eq. 7.40),
which rises 6 dB per octave and 6 dB per doubling of the surface mass $m''$; the
field-incidence value subtracts 5.5 dB (one-third octave). Stiffness adds a
**coincidence dip** at $f_c = (c_0^2/2\pi)\sqrt{m''/B'}$ (Eq. 7.3), where the free
bending wavelength matches the acoustic trace wavelength. Sharp's method holds
the mass law to $f_c/2$, drops linearly in $\log f$ to the dip
$TL = 20\lg(f_c m'') + 10\lg\eta - 44$ and rises again above $f_c$ with the loss
factor $\eta$ (Eq. 7.44). A **double wall** is a mass-spring-mass system with the
cavity as the spring: below $f_0 = 60\sqrt{(m_1+m_2)/(m_1 m_2 d)}$ (Eq. 7.62) it
follows the mass law of the combined mass, and above it the two leaves' mass laws
add plus the cavity term $20\lg(2kd)$, saturating at +6 dB beyond
$f_l = c_0/(2\pi d)$ (Eq. 7.64); a porous fill lowers $f_0$. Small air paths cap
any construction: the transmission coefficient of a straight slit (Gomperts,
Hopkins Eq. 4.99, with resonances at $d + 2e = z\lambda/2$) or a circular hole
(Wilson & Soroka, Eq. 4.102) combines with the wall in the area-weighted energy
sum $R = -10\lg[(1/\sum S_n)\sum S_n 10^{-R_n/10}]$ (Eq. 4.92), so a bare opening
of relative area $S_a/S$ limits the composite to $10\lg(S/S_a)$. The resonant
transmission path and the double-wall radiation draw on the plate radiation
efficiency and point mobilities of the
[vibration theory](/phonometry/reference/theory/vibration/).
See the [Predicting Panel Sound Insulation](/phonometry/guides/panel-sound-insulation/)
guide for usage.