Source: https://jmrplens.github.io/phonometry/devices/emission/sound-power-intensity/
# Sound Power by Intensity Scanning (ISO 9614-2 / ISO 9614-3)
The pressure routes to the sound power level fail exactly where machines
live: on a factory floor where the neighbouring lines cannot be switched
off. Sound **intensity** is the net energy flux, so it distinguishes energy
*leaving* the source from steady energy merely passing through the
measurement surface, and the scanning methods built on it tolerate
extraneous noise that would defeat any pressure method. This guide covers
the two of them: the ISO 9614-2 engineering/survey determination with its
field indicators and per-band achieved grade, the ISO 9614-3 precision
(grade 1) scan with its tighter criteria, and the accredited-style test
fiche. ISO 9614-1, the discrete fixed-point method, is not one of the routes
here: its power determination is not implemented at all, and only its field
indicators are reused. The probe itself, its finite-difference bias and
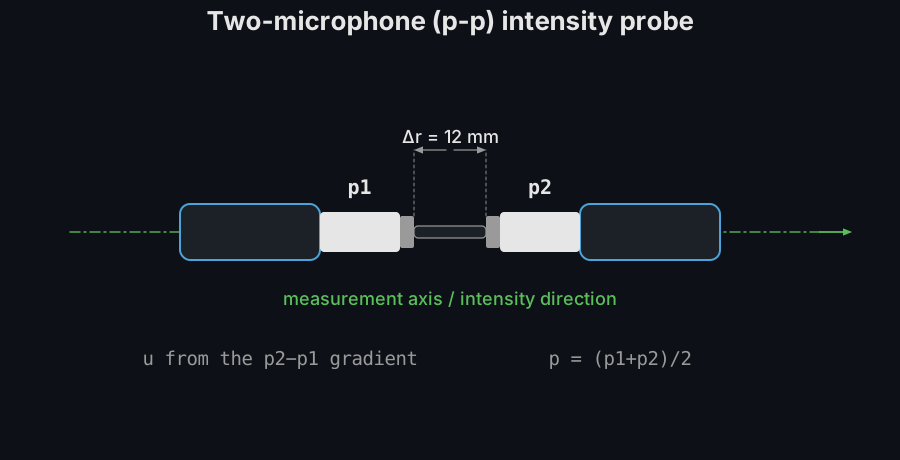
those ISO 9614-1 indicators live in [Sound Intensity (p-p)](https://jmrplens.github.io/phonometry/devices/emission/intensity/);
which route fits which job is weighed in [Sound Power](https://jmrplens.github.io/phonometry/devices/emission/sound-power/).
## 1. Intensity scanning (ISO 9614-2)
Sound **intensity** is the net energy flux, so it distinguishes energy
*leaving* the source from steady energy merely passing through the surface,
which is why the intensity method tolerates background noise that would
defeat the pressure methods. A p-p probe (see the
[Sound Intensity guide](https://jmrplens.github.io/phonometry/devices/emission/intensity/)) is swept continuously over each of
$N$ segments of a surface enclosing the source, reporting the segment-averaged
signed normal intensity $\langle I_{n,i} \rangle$.
The partial powers sum to the total:
$$
P_i = \langle I_{n,i} \rangle\ S_i, \qquad P = \sum_i P_i, \qquad
L_W = 10 \log_{10}\frac{P}{P_0},\quad P_0 = 1\ \text{pW} .
$$
[Watch the high-resolution video (WebM)](https://raw.githubusercontent.com/jmrplens/phonometry/main/.github/images/anim_intensity_scan_power.webm)
A band in which $P < 0$ (net inflow, from a stronger source outside the
surface) is **not determinable** and reported as `NaN`. Two normative field
indicators qualify each band. The **surface pressure-intensity indicator**
$F_{pI}$ measures how reactive the field is, and the **negative-partial-power
indicator** $F_{+/-}$ measures how much energy circulates in and out:
$$
F_{pI} = [L_p] - L_W + 10 \log_{10}\frac{S}{S_0}, \qquad
F_{+/-} = 10 \log_{10}\frac{\sum_i \lvert P_i \rvert}{\lvert \sum_i P_i \rvert} .
$$
The probe's **dynamic capability** $L_\mathrm{d} = \delta_{pI0} - K$ (pressure-residual
intensity index minus the bias factor $K$, 10 dB for grade 2 and 7 dB for
grade 3) must exceed $F_{pI}$ (criterion 1); $F_{+/-} \le 3\ \text{dB}$ is
criterion 2 (mandatory for grade 2); and the two repeated sweeps must agree
within the Table 2 limit $s$ per segment (criterion 3). A band is
**engineering** grade
when criteria 1, 2 and 3 hold, **survey** when 1 and 3 hold, else `none`.
An A-weighted total additionally omits the bands failing criteria 1 and/or 2
(clause 10.6 b); the result flags them in `a_weighting_omitted_bands`.
```python
import numpy as np
from phonometry import emission
# 6 surface segments x 6 octave bands: signed normal intensity (W/m^2) from two
# repeated sweeps, the segment areas, and the per-segment surface SPL (dB).
freqs = np.array([125, 250, 500, 1000, 2000, 4000], dtype=float)
areas = np.full(6, 0.5) # 0.5 m^2 per segment
rng = np.random.default_rng(0)
scan1 = np.abs(rng.normal(1e-4, 2e-5, size=(6, 6))) # (segments, bands)
scan2 = scan1 * (1.0 + rng.normal(0.0, 0.02, size=(6, 6)))
pressure = np.full((6, 6), 80.0)
res = emission.sound_power_intensity(
scan1, areas, normal_intensity_2=scan2, pressure_levels=pressure,
pressure_residual_index=12.0, frequencies=freqs,
band_type="octave", grade="engineering",
)
print(np.round(res.sound_power_level, 1)) # per-band LW
print(round(res.sound_power_level_a, 1)) # LWA, determinable + qualified bands
print(round(float(res.dynamic_capability_index[0]), 1)) # Ld = 12 - 10 = 2.0 dB
print(round(float(res.surface_pressure_intensity_index[0]), 2)) # FpI
print(list(res.achieved_grade)) # per-band grade
res.plot() # LW spectrum; non-positive (undeterminable) bands hatched (needs matplotlib)
```
*The partial powers $\langle I_{n,i} \rangle\,S_i$ of the six segments sum to
each band's $L_W$; every band here nets positive power and passes the
field-indicator criteria at engineering grade, so all six bars stand, and the
A-weighted total of 90.9 dB(A) heads the title.*
Show the code for this figure
```python
import matplotlib.pyplot as plt
import numpy as np
from phonometry import emission
# 6 surface segments x 6 octave bands: signed normal intensity (W/m^2) from two
# repeated sweeps, the segment areas, and the per-segment surface SPL (dB).
freqs = np.array([125, 250, 500, 1000, 2000, 4000], dtype=float)
areas = np.full(6, 0.5) # 0.5 m^2 per segment
rng = np.random.default_rng(0)
scan1 = np.abs(rng.normal(1e-4, 2e-5, size=(6, 6))) # (segments, bands)
scan2 = scan1 * (1.0 + rng.normal(0.0, 0.02, size=(6, 6)))
pressure = np.full((6, 6), 80.0)
res = emission.sound_power_intensity(
scan1, areas, normal_intensity_2=scan2, pressure_levels=pressure,
pressure_residual_index=12.0, frequencies=freqs,
band_type="octave", grade="engineering",
)
# res is the SoundPowerIntensityResult computed above. One line:
res.plot()
plt.show()
# By hand: a bar spectrum of LW with the A-weighted total in the title.
freqs = res.frequencies
positions = np.arange(freqs.size)
fig, ax = plt.subplots()
ax.bar(positions, res.sound_power_level, width=0.7, color="#1f77b4")
ax.set_xticks(positions)
ax.set_xticklabels([f"{f:g}" for f in freqs], rotation=45, ha="right")
ax.set_xlabel("Frequency [Hz]")
ax.set_ylabel("Sound power level LW [dB]")
ax.set_title(
f"Intensity-scanning sound power (ISO 9614-2) "
f"LWA = {res.sound_power_level_a:.1f} dB(A)")
plt.show()
```
Supplying `normal_intensity_2` (the second sweep) averages the two for the
partial powers and evaluates criterion 3; `pressure_levels` enables $F_{pI}$;
`pressure_residual_index` ($\delta_{pI0}$) plus a second sweep enables the
per-band
achieved grade. The probe's finite-difference intensity has a
frequency-dependent bias handled in the [intensity guide](https://jmrplens.github.io/phonometry/devices/emission/intensity/).
### `sound_power_intensity()` parameters
| Parameter | Type | Units | Range / default | Notes |
| :--- | :--- | :--- | :--- | :--- |
| `normal_intensity` | 2D array | W/m² | `(N_seg, N_bands)` | Signed segment-averaged normal intensity $\langle I_{n,i} \rangle$ (first sweep) |
| `areas` | 1D array | m² | > 0, `(N_seg,)` | Segment areas $S_i$ |
| `normal_intensity_2` | 2D array | W/m² | same shape | Second sweep → criterion 3 and averaging |
| `pressure_levels` | 2D array | dB | same shape | Segment SPL $L_{pi}$ → $F_{pI}$ |
| `pressure_residual_index` | float or 1D array | dB | — | $\delta_{pI0}$ → $L_\mathrm{d}$ / criterion 1 |
| `frequencies` | 1D array | Hz | nominal centres | $L_{W\mathrm{A}}$ and Table 2 limits |
| `band_type` | str | — | `'third'` (default) / `'octave'` | Table 2 lookup |
| `grade` | str | — | `'engineering'` (default) / `'survey'` | Selects $K$ |
| `repeatability_limit` | float or 1D array | dB | default Table 2 | Override criterion-3 $s$ |
Returns a `SoundPowerIntensityResult`: `partial_power`/`partial_power_level`
per segment and band, `sound_power`/`sound_power_level` (band total, `NaN`
where `negative_band`), `surface_pressure_intensity_index` ($F_{pI}$),
`negative_partial_power_index` ($F_{+/-}$), `repeatability`,
`dynamic_capability_index` ($L_\mathrm{d}$), `achieved_grade`, `surface_area`,
`sound_power_level_a` and `grade`.
## 2. Precision intensity scanning (ISO 9614-3)
ISO 9614-3 is the grade-1 scanning method: like ISO 9614-2 it integrates the
normal intensity over a surface enclosing the source, but with a continuous
scan, tighter field-indicator criteria and an explicit uncertainty budget.
**Power and level (Clause 7).** The partial power of each segment is
$P_i = I_{n,i}\,S_i$; the total $P = \sum_i P_i$ gives
$L_W = 10\log_{10}(P/P_0)$, $P_0 = 1\ \text{pW}$. A band whose net intensity is
negative (more power flowing in than out) is flagged not-applicable rather than
logged. The field indicators (temporal variability $F_\mathrm{T}$, the signed and
unsigned pressure–intensity indicators, and the non-uniformity $F_\mathrm{S}$) drive the
five acceptance criteria.
```python
import numpy as np
from phonometry import emission
# A fully enclosing surface with a uniform normal intensity In = W/S recovers
# the source power exactly: LW = 10*lg(W/P0). Here W = 100 uW -> 80 dB.
areas = np.array([0.5, 1.0, 0.25, 2.0])
w = 1.0e-4
i_n = np.full(areas.shape, w / float(areas.sum()))
res = emission.sound_power_intensity_precision(i_n, areas)
print(round(float(res.sound_power[0]), 6)) # 0.0001
print(round(float(res.sound_power_level[0]), 2)) # 80.0
```
Across several bands the result carries the per-band $L_W$ (`NaN` where the net
power is non-positive), flags those bands `not_applicable`, and draws them
with the one-line `result.plot()` of the figure below:
```python
import numpy as np
from phonometry import emission
# Four partial surfaces scanned over five one-third-octave bands. Each cell of
# partial_intensity is the signed normal intensity In_i (W/m^2); areas are the
# partial-surface areas Si. The 250 Hz band has net-negative power (a locally
# reactive field), so ISO 9614-3 flags it not-applicable (clause 9.2) -> NaN.
freqs = np.array([250, 500, 1000, 2000, 4000], float)
areas = np.array([0.5, 1.0, 0.75, 0.5])
base_intensity = np.array([2.0e-6, 8.0e-6, 2.0e-5, 1.0e-5, 3.0e-6])
partial_intensity = base_intensity[None, :] * np.array([1.0, 1.1, 0.9, 1.05])[:, None]
partial_intensity[:, 0] = [2.0e-6, -3.0e-6, -4.0e-6, -1.0e-6] # net-negative band
result = emission.sound_power_intensity_precision(partial_intensity, areas, frequencies=freqs)
print(result.not_applicable_band.tolist()) # [True, False, False, False, False]
print(round(result.sound_power_level_a, 1)) # 80.6
result.plot() # LW spectrum; the not-applicable band is hatched (needs matplotlib)
```
*The 250 Hz band nets negative (more energy flowing in than out), so ISO 9614-3
declares it not-applicable; the figure hatches and greys it while the four
determinate bands and the A-weighted total stand.*
Show the code for this figure
```python
import matplotlib.pyplot as plt
import numpy as np
from phonometry import emission
# Four partial surfaces scanned over five one-third-octave bands. Each cell of
# partial_intensity is the signed normal intensity In_i (W/m^2); areas are the
# partial-surface areas Si. The 250 Hz band has net-negative power (a locally
# reactive field), so ISO 9614-3 flags it not-applicable (clause 9.2) -> NaN.
freqs = np.array([250, 500, 1000, 2000, 4000], float)
areas = np.array([0.5, 1.0, 0.75, 0.5])
base_intensity = np.array([2.0e-6, 8.0e-6, 2.0e-5, 1.0e-5, 3.0e-6])
partial_intensity = base_intensity[None, :] * np.array([1.0, 1.1, 0.9, 1.05])[:, None]
partial_intensity[:, 0] = [2.0e-6, -3.0e-6, -4.0e-6, -1.0e-6] # net-negative band
result = emission.sound_power_intensity_precision(partial_intensity, areas, frequencies=freqs)
# result is the PrecisionIntensityResult computed above. One line:
result.plot()
plt.show()
# By hand: determinate bands as LW bars; a not-applicable band (its LW is NaN)
# is flagged by a full-height greyed, hatched span rather than a zero-height bar.
freqs = result.frequencies
positions = np.arange(freqs.size)
neg = result.not_applicable_band
lw = np.nan_to_num(result.sound_power_level)
fig, ax = plt.subplots()
ax.bar(positions[~neg], lw[~neg], width=0.7, color="#1f77b4")
for pos in positions[neg]:
ax.axvspan(pos - 0.35, pos + 0.35, facecolor="#888888", alpha=0.28,
hatch="//", edgecolor="#888888")
ax.set_xticks(positions)
ax.set_xticklabels([f"{f:g}" for f in freqs], rotation=45, ha="right")
ax.set_xlabel("Frequency [Hz]")
ax.set_ylabel("Sound power level LW [dB]")
ax.set_title(
f"Precision intensity scanning (ISO 9614-3) "
f"LWA = {result.sound_power_level_a:.1f} dB(A)")
plt.show()
```
## 3. The measurement report (`.report()`)
The intensity-scanning result (`SoundPowerIntensityResult`, ISO 9614-2)
writes a one-page PDF fiche laid out like a sound-power test sheet through
its own `.report()`, sharing the layout and the `ReportMetadata` container of
the [pressure-method fiche](https://jmrplens.github.io/phonometry/devices/emission/sound-power-pressure/#3-the-measurement-report-report).
The standard-basis line
names ISO 9614-2:1996 and the measurement grade, the per-band table lists the
intensity-derived band sound-power level $L_W$, and the boxed $L_{W\mathrm{A}}$ carries
the total $L_W$, the measurement surface $S$ and the determination grade
(the intensity result has no expanded uncertainty $U$). `verbose=True` adds the
field indicators $F_{pI}$ (surface pressure-intensity) and $F_{+/-}$
(negative partial power) and the per-band achieved grade; the basis strip
states the partial-power model (the segment partial powers $P_i = I_{n,i} S_i$
summing to $P$) and the Annex B qualification criteria. A band whose net power
is non-positive is not determinable (clause 9.2) and prints an em dash.
```python
import numpy as np
from phonometry import ReportMetadata, emission
freqs = np.array([125, 250, 500, 1000, 2000, 4000], float)
# Six equal 0.5 m^2 segments (S = 3.0 m^2); one uniform normal-intensity
# spectrum scanned twice, with the surface SPL and the instrument residual
# index that qualify every band at engineering grade.
intensity = np.array([0.6e-4, 1.0e-4, 1.5e-4, 1.4e-4, 0.9e-4, 0.5e-4])
scan = np.tile(intensity, (6, 1))
res = emission.sound_power_intensity(
scan, np.full(6, 0.5), normal_intensity_2=scan.copy(),
pressure_levels=np.full((6, 6), 80.0), pressure_residual_index=15.0,
frequencies=freqs, band_type="octave", grade="engineering",
)
res.report(
"sound_power_intensity.pdf",
metadata=ReportMetadata(
client="Example manufacturing plant",
specimen="Hydraulic power pack (floor-standing)",
test_room="Machine hall with steady background noise",
instrumentation="Class 1 p-p intensity probe (IEC 61043), s/n 0042",
laboratory="Phonometry reference example",
report_id="EXAMPLE-9614",
requirement=93.0,
),
) # LWA = 90.9 dB(A) re 1 pW -> declared limit 93 dB(A): PASS
```
The example fiche, regenerated with `make reports`, is kept rendered in the
repository. Click the preview to open the PDF:
[](https://raw.githubusercontent.com/jmrplens/phonometry/main/.github/reports/iso9614_sound_power_intensity_example.pdf)
*Sound power by intensity fiche (`SoundPowerIntensityResult.report`), an
ISO 9614-2 engineering-grade scan with the field indicators and the boxed
$L_{W\mathrm{A}}$.*
### The precision sheet (ISO 9614-3)
`PrecisionIntensityResult` writes its own fiche, and it is not the part 2
sheet with a different title: part 3 asks a report to state different things
(clause 10). The per-band table carries the normalized level $L_{W0}$ the
standard reports (Eq. 10) beside $L_W$, and the expanded uncertainty $U$ of
clause 4.3, twice the Table 1 standard deviation of reproducibility of the
band; the caption names the frequency range the determination covers, because
clause 4.3 asks for it whenever that range is narrower than 50 Hz to 6.3 kHz.
A one-third-octave set is printed in two column groups side by side, the way
an accredited sheet fits that many bands on a page. `verbose=True` tabulates
the four Annex B indicators $F_\mathrm{T}$, $F_{p|I_n|}$, $F_{pI_n}$ and $F_\mathrm{S}$ per band,
the tabulation clause 10 f) 1) asks for, over the measurement surface as
Annex B defines them, and the qualification cell the criteria decide.
Hand it an Annex C qualification and the sheet does what clause 10 f) 2)
makes mandatory: the bands whose criteria are not satisfied are dropped from
the A-weighted determination and named on the sheet, next to the bands the
method is not applicable to at all (clause 9.2). That is why the boxed
$L_{W\mathrm{A}}$ can differ from `result.sound_power_level_a`, which is computed
before any criterion is evaluated and therefore sums every applicable band.
Beside it the box states the normalized $L_{W\mathrm{A}0}$, since clause 10 f) 2)
reports the normalized quantity while the headline number is the level a
declared limit is written against.
Without `criteria` the fiche boxes the result's own value and says that no
qualification was supplied. `residual_index` puts the probe's
pressure-residual intensity index on the sheet (clause 10 d) 5)) with the
dynamic capability $L_\mathrm{d}$ it yields; the clause 10 items that are free
description rather than numbers, the scan geometry and speed, the scanning
time and the probe-reversal checks, go in the metadata `notes`.
```python
import numpy as np
from phonometry import ReportMetadata, emission
# A box measurement surface: five partial surfaces, each scanned in four
# segments, over the one-third-octave bands 200 Hz to 800 Hz. Part 3 works in
# one-third octaves, which is the band set Table 1 tabulates its uncertainty
# and its criterion-1 tolerance for.
third_octave = np.array([200, 250, 315, 400, 500, 630, 800], float)
faces = np.array([1.65, 1.575, 1.575, 1.155, 1.155])
scanned = 1.2e-5 * np.array([1.3, 1.1, 0.8, 0.9, 0.9])[:, None] * np.ones(7)
segment_intensity = np.repeat(scanned, 4, axis=0)
# The pressure-intensity margin per band: 8 dB at 200 Hz, where the hall is
# reverberant, 2 dB above it.
margin = np.array([8.0, 2.0, 2.0, 2.0, 2.0, 2.0, 2.0])
segment_levels = 10 * np.log10(segment_intensity / 1e-12) + margin
precise = emission.sound_power_intensity_precision(
scanned, faces, frequencies=third_octave,
temperature=28.0, barometric_pressure=94_000.0,
)
annex_b = emission.precision_field_indicators(segment_intensity, segment_levels)
scan_intensity = np.average(scanned, axis=0, weights=faces) # unequal faces
scan_level = 10 * np.log10(scan_intensity / 1e-12)
annex_c = emission.precision_qualification(
annex_b, scan_intensity_level_1=scan_level,
scan_intensity_level_2=scan_level + 0.1,
pressure_residual_index=15.0, # Ld = 15 - 10 = 5 dB
frequencies=third_octave,
)
print(annex_c.qualified.tolist()) # [False, True, True, True, True, True, True]
precise.report(
"sound_power_intensity_precision.pdf",
metadata=ReportMetadata(
client="Example manufacturing plant",
specimen="Hydraulic power pack (floor-standing)",
test_room="Machine hall with steady background noise",
instrumentation="Class 1 p-p intensity probe (IEC 61043), 12 mm spacer",
temperature=28.0, relative_humidity=40.0, pressure=94.0,
laboratory="Phonometry reference example",
report_id="EXAMPLE-9614-3",
requirement=98.0,
notes="Box surface at 0,25 m; five partial surfaces scanned twice.",
),
indicators=annex_b, criteria=annex_c, residual_index=15.0,
) # 200 Hz fails criterion 2 and is named as omitted from LWA
```
The example fiche in the repository is a fuller determination of the same
machine: sixteen one-third-octave bands from 100 Hz to 3150 Hz over a
five-face box surface, with the 100 Hz band failing criterion 2 and named as
omitted. Click the preview to open the PDF:
[](https://raw.githubusercontent.com/jmrplens/phonometry/main/.github/reports/iso9614_3_precision_intensity_example.pdf)
*Precision sound power by intensity fiche
(`PrecisionIntensityResult.report`), an ISO 9614-3 grade-1 scan with the
normalized levels, the per-band uncertainty and the Annex C omission stated.*
## See also
- [Sound Power](https://jmrplens.github.io/phonometry/devices/emission/sound-power/): choosing among the five determination
routes, what the accuracy grades promise, and the ISO 4871 noise-emission
declaration a measured $L_{W\mathrm{A}}$ feeds.
- [Sound Intensity (p-p)](https://jmrplens.github.io/phonometry/devices/emission/intensity/): the two-microphone probe, its
finite-difference bias and the ISO 9614-1 field indicators behind the
scanning methods.
- [Sound Power by Pressure Methods (ISO 3744 / ISO 3746 / ISO 3745)](https://jmrplens.github.io/phonometry/devices/emission/sound-power-pressure/):
the enveloping-surface and anechoic routes for quiet sites.
- [Sound Power in the Reverberation Room (ISO 3741)](https://jmrplens.github.io/phonometry/devices/emission/sound-power-reverberation/):
the precision diffuse-field route in a qualified laboratory room.
- [Theory](https://jmrplens.github.io/phonometry/reference/theory/environment-transport/): the field-indicator derivations.
- API reference: [`emission.sound_power_intensity`](https://jmrplens.github.io/phonometry/reference/api/power/sound-power-intensity/).
## References
- Fahy, F. J. (1995). *Sound intensity* (2nd ed.). E&FN Spon.
ISBN 978-0-419-19810-9.
[doi:10.4324/9780203475386](https://doi.org/10.4324/9780203475386).
The monograph on sound energy flux: why intensity separates the energy
leaving the source from steady energy passing through, behind both
scanning methods.
- International Organization for Standardization. (1996). *Acoustics —
Determination of sound power levels of noise sources using sound
intensity — Part 2: Measurement by scanning* (ISO 9614-2:1996).
[iso.org catalogue](https://www.iso.org/standard/21247.html).
The scanning method of section 1: the partial powers, the $F_{pI}$ and
$F_{+/-}$ field indicators and the grade criteria.
- International Organization for Standardization. (2002). *Acoustics —
Determination of sound power levels of noise sources using sound
intensity — Part 3: Precision method for measurement by scanning*
(ISO 9614-3:2002).
[iso.org catalogue](https://www.iso.org/standard/24012.html).
The grade-1 scanning method of section 2, its field indicators and the
clause 9.2 not-applicable flagging.
## Standards
ISO 9614-2:1996, *Acoustics — Determination of sound power levels of
noise sources using sound intensity — Part 2: Measurement by scanning*: the
partial powers, the $F_{pI}$ and $F_{+/-}$ field indicators and the grade
criteria of section 1. ISO 9614-3:2002, *… Part 3: Precision method for
measurement by scanning*: the grade-1 scanning method, its field indicators and
the
clause 9.2 not-applicable flagging of section 2.