Source: https://jmrplens.github.io/phonometry/buildings/insulation/insulation-ratings/
# Insulation Ratings (ISO 717)
Every sound-insulation quantity in this documentation ends its journey the
same way: a band spectrum walks in, a single number walks out. Whether the
spectrum is a laboratory $R$, a field $R'$ or $D_\mathrm{nT}$, a façade
$D_{2\mathrm{m,nT}}$, an impact $L_\mathrm{n}$ or $L'_\mathrm{nT}$, or a flanking $D_\mathrm{n,f}$, what
regulations quote is the weighted single number of ISO 717, and two
reference-curve engines produce all of them: **ISO 717-1** for airborne
quantities, where an unfavourable deviation is a band falling *below* the
reference, and **ISO 717-2** for impact quantities, with the sign flipped
because a higher impact level is worse. This guide covers the engines
themselves: the shifting rule, the spectrum adaptation terms $C$, $C_\mathrm{tr}$
and $C_\mathrm{I}$, the enlarged-range and one-decimal variants, and the ISO 717
fiche. The measurements that produce the spectra live in the
[field](https://jmrplens.github.io/phonometry/buildings/insulation/insulation-field/), [laboratory](https://jmrplens.github.io/phonometry/buildings/insulation/insulation-lab/),
[intensity](https://jmrplens.github.io/phonometry/buildings/insulation/insulation-intensity/), [survey](https://jmrplens.github.io/phonometry/buildings/insulation/insulation-survey/) and
[flanking](https://jmrplens.github.io/phonometry/buildings/insulation/flanking-lab/) guides; the prediction that consumes the
ratings is [EN 12354](https://jmrplens.github.io/phonometry/buildings/design/insulation-prediction/).
## Airborne ratings (ISO 717-1)
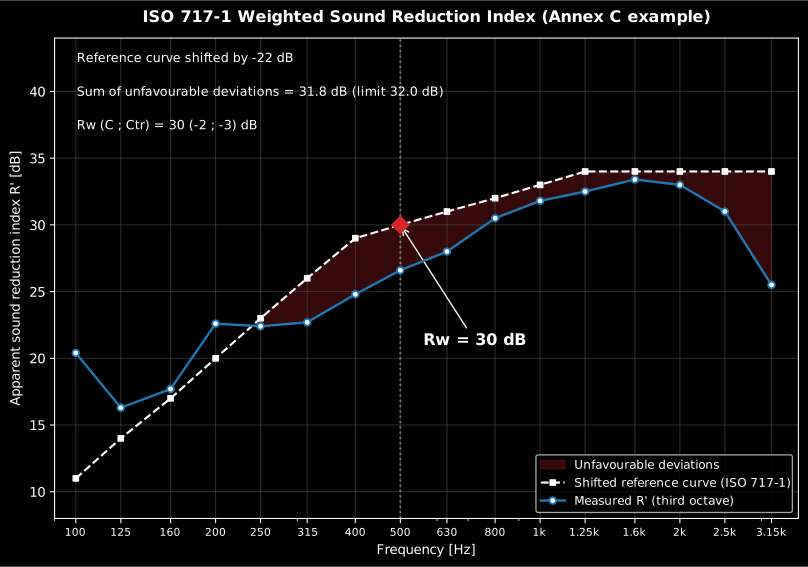
The band spectrum is collapsed to one number by the **reference-curve
method** of ISO 717-1: a fixed reference curve is shifted in 1 dB steps
toward the measured curve until the sum of *unfavourable* deviations
(where the measurement falls below the reference) is as large as possible
but not more than 32.0 dB (16 one-third-octave bands) or 10.0 dB (5 octave
bands). The rating ($R_\mathrm{w}$, $R'_\mathrm{w}$, $D_\mathrm{nT,w}$ …) is the shifted reference
read at 500 Hz. The **spectrum adaptation terms** $C$ (pink noise) and $C_\mathrm{tr}$
(urban traffic) add the low-frequency penalty of a real source.
The two terms re-rate the same measured curve against the two source spectra
of ISO 717-1 Annex A: $C$ against A-weighted pink noise, representative of
living activities (speech, music, radio, television), and $C_\mathrm{tr}$ against
A-weighted urban road traffic, whose energy sits at low frequency. They are
defined so that the rating plus the term ($R_\mathrm{w} + C$ for a laboratory index,
$R'_\mathrm{w} + C$ or $D_\mathrm{nT,w} + C$ for the quantities of the
[field guide](https://jmrplens.github.io/phonometry/buildings/insulation/insulation-field/), and
likewise with $C_\mathrm{tr}$) is the A-weighted level difference achieved against
that source. Reading them:
* $C$ stays small for most constructions (0 to −2 dB is typical): the pink
spectrum is close to the weighting already implicit in the reference
curve.
* $C_\mathrm{tr}$ punishes weak low-frequency insulation. A lightweight double leaf
with its mass-air-mass resonance near 100 Hz can carry a $C_\mathrm{tr}$ of −5 to
−10 dB, while a heavy monolithic wall with the same $R_\mathrm{w}$ loses far less:
two constructions with equal ratings can differ audibly against traffic.
* Design with the descriptor that matches the noise, carried by the field
quantity the requirement rates: $R'_\mathrm{w} + C_\mathrm{tr}$ for a façade on a busy
road, $D_\mathrm{nT,w} + C$ (or the plain rating, where the regulation says so)
between dwellings, the two example requirements of ISO 717-1, 5.3.
```python
from phonometry import building
# Single-number rating from a measured 16-band R spectrum (ISO 717-1 Annex C)
R = [20.4, 16.3, 17.7, 22.6, 22.4, 22.7, 24.8, 26.6,
28.0, 30.5, 31.8, 32.5, 33.4, 33.0, 31.0, 25.5]
w = building.weighted_rating(R)
print(w.rating, w.c, w.ctr) # 30 -2 -3 -> Rw(C;Ctr) = 30(-2;-3)
w.plot() # measured R' vs shifted ISO 717-1 reference, deviations shaded (needs matplotlib)
```
Show the code for this figure
```python
import matplotlib.pyplot as plt
from phonometry import building
# Single-number rating from a measured 16-band R spectrum (ISO 717-1 Annex C)
R = [20.4, 16.3, 17.7, 22.6, 22.4, 22.7, 24.8, 26.6,
28.0, 30.5, 31.8, 32.5, 33.4, 33.0, 31.0, 25.5]
w = building.weighted_rating(R)
# One line — measured curve vs the shifted ISO 717-1 reference, deviations shaded:
w.plot()
plt.show()
# By hand, from the band curve the result now carries:
fig, ax = plt.subplots()
ax.semilogx(w.band_centers, w.measured, "o-", label="Measured R'")
ax.semilogx(w.band_centers, w.shifted_reference, "s--", label="Shifted reference")
ax.fill_between(w.band_centers, w.measured, w.shifted_reference,
where=w.measured < w.shifted_reference, interpolate=True,
alpha=0.3, label="Unfavourable deviations")
ax.set_xlabel("Frequency [Hz]")
ax.set_ylabel("Sound reduction index [dB]")
ax.set_title(f"Rw = {w.rating} dB (C={w.c:+d}; Ctr={w.ctr:+d})")
ax.legend()
plt.show()
```
### `weighted_rating()` parameters
| Parameter | Type | Units | Range / default | Notes |
| :--- | :--- | :--- | :--- | :--- |
| `values_by_band` | 1D array | dB | 16 (thirds) or 5 (octaves) | Measured $R$, $R'$, $D_\mathrm{nT}$ … per band |
| `bands` | str or `None` | — | `'third-octave'` / `'octave'` / `None` | `None` infers from the count |
`weighted_rating()` returns a `WeightedRatingResult`
(`rating`, `c`, `ctr`, `unfavourable_sum`, all integers except the sum).
## Impact ratings (ISO 717-2)
The single-number rating (ISO 717-2) shifts the same style of reference curve,
but an **unfavourable deviation now occurs where the measurement *exceeds* the
reference** (impact noise is worse when higher), the sign opposite to
ISO 717-1. The rating ($L_\mathrm{n,w}$, $L'_\mathrm{n,w}$, $L'_\mathrm{nT,w}$) is the shifted
reference read at 500 Hz; for octave bands it is then reduced by 5 dB. The spectrum
adaptation term $C_\mathrm{I} = L_\mathrm{n,sum} - 15 - L_\mathrm{n,w}$ uses the energetic sum
over 100–2500 Hz (the first 15 thirds, excluding 3150 Hz) or 125–2000 Hz
(octaves).
For measurements extended down to 50 Hz,
`weighted_impact_rating_extended` additionally returns the enlarged-range
term $C_{\mathrm{I},50\text{–}2500}$ (A.2.1 NOTE), and with `one_decimal=True` the
0.1 dB-step rating used in uncertainty statements (it reproduces the printed
$L_\mathrm{n,r,0,w} = 77.6$ dB and $C_\mathrm{I,r,0} = -10.3$ dB of A.2.2).
```python
import numpy as np
from phonometry import building
# 16 one-third-octave impact levels (100 Hz - 3150 Hz), dB, from the
# ISO 717-2 Annex C worked example; measured with T = T0, so these are
# already the standardized L'nT values.
l_nt = np.array([62.1, 63.2, 63.5, 66.2, 68.5, 70.0, 71.7, 73.1,
73.8, 73.5, 73.8, 73.3, 73.1, 73.0, 72.4, 71.2])
# Weighted impact rating + spectrum adaptation term CI (ISO 717-2)
res_imp = building.weighted_impact_rating(l_nt)
print(res_imp.rating, res_imp.ci, res_imp.unfavourable_sum) # 79 -11 28.0 -> L'nT,w(CI)=79(-11)
# Octave-band data carry the extra -5 dB reduction (Clause 4.3.2)
octave = np.array([65.3, 64.5, 58.0, 55.8, 43.0])
print(building.weighted_impact_rating(octave).rating) # 54
res_imp.plot() # measured L'nT vs shifted ISO 717-2 reference, measured-above shaded (needs matplotlib)
```
Show the code for this figure
```python
import matplotlib.pyplot as plt
import numpy as np
from phonometry import building
# 16 standardized one-third-octave impact levels L'nT, dB (ISO 717-2
# Annex C worked example, measured with T = T0).
l_nt = np.array([62.1, 63.2, 63.5, 66.2, 68.5, 70.0, 71.7, 73.1,
73.8, 73.5, 73.8, 73.3, 73.1, 73.0, 72.4, 71.2])
# Weighted impact rating + spectrum adaptation term CI (ISO 717-2)
res_imp = building.weighted_impact_rating(l_nt)
# One line — measured L'nT vs the shifted ISO 717-2 reference (measured-above shaded):
res_imp.plot()
plt.show()
# By hand, from the band curve the result now carries (note the opposite sign:
# an unfavourable deviation is where the MEASURED level exceeds the reference).
# Here the input was l_n_t, so the rated quantity is the field level L'nT,w:
fig, ax = plt.subplots()
ax.semilogx(res_imp.band_centers, res_imp.measured, "o-", label="Measured L'nT")
ax.semilogx(res_imp.band_centers, res_imp.shifted_reference, "s--", label="Shifted reference")
ax.fill_between(res_imp.band_centers, res_imp.shifted_reference, res_imp.measured,
where=res_imp.measured > res_imp.shifted_reference, interpolate=True,
alpha=0.3, label="Unfavourable deviations")
ax.set_xlabel("Frequency [Hz]")
ax.set_ylabel("Impact sound pressure level [dB]")
ax.set_title(f"L'nT,w = {res_imp.rating} dB (CI={res_imp.ci:+d})")
ax.legend()
plt.show()
```
Feeding the standardized spectrum into `weighted_impact_rating` reproduces
the ISO 717-2 Annex C values (thirds $L'_\mathrm{nT,w} = 79$, $C_\mathrm{I} = -11$; octave
54, $C_\mathrm{I} = 0$).
### `weighted_impact_rating()` parameters
| Parameter | Type | Units | Range / default | Notes |
| :--- | :--- | :--- | :--- | :--- |
| `values_by_band` | 1D array | dB | 16 (thirds) or 5 (octaves) | Measured $L_\mathrm{n}$, $L'_\mathrm{n}$ or $L'_\mathrm{nT}$ per band |
| `bands` | str or `None` | — | `'third-octave'` / `'octave'` / `None` | `None` infers from the count |
`weighted_impact_rating()` returns an `ImpactRatingResult` (`rating`,
`ci` integers, `unfavourable_sum` in dB).
## Enlarged frequency ranges and one-decimal ratings
When the measurement covers more than the core 100–3150 Hz bands, ISO 717-1
Annex B defines additional adaptation terms with the range as a subscript
($C_{50\text{–}3150}$, $C_{50\text{–}5000}$, $C_{100\text{–}5000}$ and the
$C_\mathrm{tr}$ counterparts), computed with the Table B.1 spectra over the enlarged
range. `weighted_rating_extended` takes the band values *with their centre
frequencies* and returns the core rating plus every extended term the input
covers (the impact counterpart `weighted_impact_rating_extended` adds
$C_{\mathrm{I},50\text{–}2500}$). With `one_decimal=True` the reference curve shifts in
0.1 dB steps and all reductions keep one decimal: the variant ISO 717
prescribes "for the expression of uncertainty" and ISO 12999-1 Annex B
requires when stating the uncertainty of a single-number value.
```python
from phonometry import building
# Single-number rating from a measured 16-band R spectrum (ISO 717-1 Annex C)
R = [20.4, 16.3, 17.7, 22.6, 22.4, 22.7, 24.8, 26.6,
28.0, 30.5, 31.8, 32.5, 33.4, 33.0, 31.0, 25.5]
freqs = [50, 63, 80, 100, 125, 160, 200, 250, 315, 400, 500,
630, 800, 1000, 1250, 1600, 2000, 2500, 3150, 4000, 5000]
r_ext = [18.7, 19.2, 20.0, *R, 26.8, 29.2] # ISO 717-1 Annex C, Table C.2
ext = building.weighted_rating_extended(r_ext, freqs)
print(ext.rating, ext.c, ext.ctr, ext.c_50_5000, ext.ctr_50_5000)
# 30 -2 -3 -2 -4 -> Rw(C;Ctr;C50-5000;Ctr,50-5000) = 30(-2;-3;-2;-4)
one_dp = building.weighted_rating_extended(r_ext, freqs, one_decimal=True)
print(one_dp.rating) # 30.0, the 0.1 dB-step rating for uncertainty statements
ext.plot() # enlarged-range curve vs the shifted core reference, Annex B terms in the title (needs matplotlib)
```
*The rating itself is still evaluated on the 16 core bands (100–3150 Hz);
the enlarged bands only enter the Annex B adaptation terms, so the shifted
reference curve stops at the core-range edges while the measured curve
continues into the shaded enlarged range.*
Show the code for this figure
```python
import matplotlib.pyplot as plt
from phonometry import building
# Single-number rating from a measured 16-band R spectrum (ISO 717-1 Annex C)
R = [20.4, 16.3, 17.7, 22.6, 22.4, 22.7, 24.8, 26.6,
28.0, 30.5, 31.8, 32.5, 33.4, 33.0, 31.0, 25.5]
freqs = [50, 63, 80, 100, 125, 160, 200, 250, 315, 400, 500,
630, 800, 1000, 1250, 1600, 2000, 2500, 3150, 4000, 5000]
r_ext = [18.7, 19.2, 20.0, *R, 26.8, 29.2] # ISO 717-1 Annex C, Table C.2
ext = building.weighted_rating_extended(r_ext, freqs)
# One line — the enlarged-range curve vs the shifted core reference:
ext.plot()
plt.show()
# By hand, from the band curves the result carries (the full enlarged-range
# curve on ext, the core-band reference on ext.core):
fig, ax = plt.subplots()
ax.semilogx(ext.band_centers, ext.measured, "o-", label="Measured R")
ax.semilogx(ext.core.band_centers, ext.core.shifted_reference, "s--",
label="Shifted reference (core bands)")
ax.fill_between(ext.core.band_centers, ext.core.measured,
ext.core.shifted_reference,
where=ext.core.measured < ext.core.shifted_reference,
interpolate=True, alpha=0.3, label="Unfavourable deviations")
ax.set_xlabel("Frequency [Hz]")
ax.set_ylabel("Sound reduction index [dB]")
ax.set_title(f"Rw = {ext.rating} dB (C50-5000={ext.c_50_5000:+g}; "
f"Ctr,50-5000={ext.ctr_50_5000:+g})")
ax.legend()
plt.show()
```
## ISO 717 report (`.report()`)
Both rating results render a one-page PDF fiche laid out like an
accredited-laboratory test report through a `report(path)` method: a
standard-basis line (measurement standard plus the ISO 717 rating part), an
optional metadata header block, the one-third-octave table beside the
measured-versus-shifted-reference plot (the result's own `.plot()`), the boxed
single-number result, an optional verdict row and a footer with the fixed
disclaimer. `WeightedRatingResult.report()` labels the airborne ISO 717-1 fiche
($R_\mathrm{w}\ (C\ ;\ C_\mathrm{tr})$, deviations where the reference is above the measurement);
`ImpactRatingResult.report()` labels the impact ISO 717-2 fiche
($L_\mathrm{n,w}(C_\mathrm{I})$, deviations the opposite way).
`SoundReductionResult.report()` is a convenience that rates the predicted
$R(f)$ and writes its fiche in one call.
The report metadata is supplied as a `ReportMetadata` frozen dataclass (every
field optional; only the supplied fields are rendered, and the numeric fields
must satisfy their field-specific physical ranges, detailed in the table
below). Passing `metadata=None` produces a lightweight
prediction fiche (body, result and disclaimer only). When
`metadata.requirement` is set, a verdict row is added: an airborne rating passes
when it is at or above the requirement, an impact rating when it is at or below
it (a lower impact level is better). Setting `verbose=True` swaps the two-column
`f | value` table for the ISO 717 Annex C columns (frequency, measured value,
shifted reference, unfavourable deviation).
Rendering needs reportlab, kept out of the runtime dependencies as the optional
`phonometry[report]` extra (`pip install phonometry[report]`); a missing
reportlab raises a clear `ImportError` with the install command, and the plot
still needs matplotlib (`phonometry[plot]`). Only `engine="reportlab"` is
supported; any other engine raises `ValueError`. The fiche renders in English by
default; pass `language="es"` for a Spanish fiche (translated fixed strings and
a comma decimal separator), e.g.
`building.weighted_rating(R).report("Rw_fiche_es.pdf", language="es")`.
```python
from phonometry import building, ReportMetadata
# Airborne rating from a measured 16-band R spectrum (ISO 717-1)
R = [20.4, 16.3, 17.7, 22.6, 22.4, 22.7, 24.8, 26.6,
28.0, 30.5, 31.8, 32.5, 33.4, 33.0, 31.0, 25.5]
metadata = ReportMetadata(
specimen="200 mm reinforced-concrete wall",
client="Acoustic Test Client Ltd.",
area=10.0, mass_per_area=460.0,
source_volume=53.0, receiving_volume=51.0,
temperature=21.5, relative_humidity=45.0, pressure=101.3,
test_room="Transmission suite T1",
measurement_standard="ISO 10140-2",
test_date="2026-07-18",
laboratory="Phonometry Reference Laboratory",
operator="José Manuel Requena Plens",
report_id="PHN-2026-0042",
requirement=42.0, # adds the PASS/FAIL verdict row
)
building.weighted_rating(R).report(
"Rw_fiche.pdf", metadata=metadata
) # Rw (C; Ctr)
# Impact rating from a measured 16-band L'nT spectrum (ISO 717-2)
l_nt = [45.0, 47.0, 48.0, 49.0, 51.0, 52.0, 53.0, 54.0,
55.0, 56.0, 57.0, 58.0, 55.0, 52.0, 49.0, 46.0]
building.weighted_impact_rating(l_nt).report("Lnw_fiche.pdf") # Ln,w (CI)
```
Rendered examples of both fiches, regenerated with `make reports`, are kept in
the repository. Click either preview to open the PDF:
[](https://raw.githubusercontent.com/jmrplens/phonometry/main/.github/reports/iso717_airborne_example.pdf)
*Airborne rating fiche (`WeightedRatingResult.report`), $R_\mathrm{w}\ (C\ ;\ C_\mathrm{tr})$.*
[](https://raw.githubusercontent.com/jmrplens/phonometry/main/.github/reports/iso717_impact_example.pdf)
*Impact rating fiche (`ImpactRatingResult.report`), $L_\mathrm{n,w}(C_\mathrm{I})$.*
### Report metadata (`ReportMetadata`)
Every field is optional and only the supplied ones are rendered, so the same
object drives a full accredited fiche and a lightweight prediction fiche. The
numeric fields are validated on construction by physical range.
| Field | Type | Rendered as |
| --- | --- | --- |
| `specimen`, `client`, `mounted_by`, `manufacturer` | `str` | Header identity of the tested element and who it was tested for / mounted by |
| `area`, `mass_per_area` | `float > 0` | Sample area $S$ (m²) and measured mass per unit area (kg/m²) |
| `source_volume`, `receiving_volume` | `float > 0` | Room volumes (m³) |
| `temperature`, `relative_humidity` | `float` | Single representative climate: air temperature (°C, any sign), relative humidity (0–100 %) |
| `pressure` | `float > 0` | Ambient (static) air pressure during the test (kPa) |
| `source_temperature`, `source_relative_humidity`, `receiving_temperature`, `receiving_relative_humidity` | `float` | Per-room climate when source and receiving rooms are reported separately (same ranges as above) |
| `test_room`, `mounting`, `measurement_standard`, `test_date` | `str` | Facility, mounting condition, the measurement standard (forms the standard-basis line) and the test date |
| `laboratory`, `operator`, `report_id`, `notes` | `str` | Footer: institute, operator signature line, report number and free-form remarks |
| `requirement` | `float` | Target single number; adds the verdict row (airborne passes at or above it, impact at or below it) |
## Quick answers
### What is the difference between the C and Ctr spectrum adaptation terms?
Both re-rate the same measured curve against the two source spectra of
ISO 717-1 Annex A: $C$ against A-weighted pink noise (living activities:
speech, music, radio, television) and $C_\mathrm{tr}$ against A-weighted urban
road traffic, whose energy sits at low frequency. $C$ is typically 0 to
−2 dB, while a lightweight double leaf with a mass-air-mass resonance near
100 Hz can carry a $C_\mathrm{tr}$ of −5 to −10 dB.
## References
- Hopkins, C. (2007). *Sound insulation*. Butterworth-Heinemann.
ISBN 978-0-7506-6526-1.
[doi:10.4324/9780080550473](https://doi.org/10.4324/9780080550473).
The interpretation of the single-number ratings and what they hide about
the underlying band spectra.
- International Organization for Standardization. (2020). *Acoustics —
Rating of sound insulation in buildings and of building elements — Part 1:
Airborne sound insulation* (ISO 717-1:2020).
[iso.org catalogue](https://www.iso.org/standard/77435.html).
The airborne reference-curve rating and the spectrum adaptation terms
interpreted above.
- International Organization for Standardization. (2020). *Acoustics —
Rating of sound insulation in buildings and of building elements — Part 2:
Impact sound insulation* (ISO 717-2:2020).
[iso.org catalogue](https://www.iso.org/standard/69867.html).
The impact reference-curve rating and the CI adaptation term, with the
enlarged-range CI,50-2500.
## Standards
ISO 717-1:2020 and ISO 717-2:2020, which define the reference-curve
single-number ratings, the spectrum adaptation terms $C$, $C_\mathrm{tr}$ and $C_\mathrm{I}$,
the enlarged-range terms of Annex B / A.2.1 and the 0.1 dB-step variant used in
uncertainty statements. The spectra they rate come from ISO 16283 (field),
ISO 10140 (laboratory), ISO 15186 (intensity), ISO 10052 (survey) and
ISO 10848 (flanking); conformance is anchored on the standards' own Annex C
worked examples.
**Not covered.** Nothing here measures: every function takes an
already-measured or predicted band spectrum from the field, laboratory,
intensity, survey or flanking guides. The façade single number of
**ISO 16283-3** Annex F and the flanking $D_\mathrm{n,f,w}$ reuse these engines from
their own pages rather than duplicating them. One member of the family is
deliberately absent: the A-weighted maximum impact level of **ISO 717-2:2020
Annex D**, which rates the rubber ball and the bang machine. It shifts no curve
at all — it is an energy sum of A-weighted band levels — so it belongs with the
sources it rates, in
[Heavy and soft impact sources](https://jmrplens.github.io/phonometry/buildings/insulation/heavy-impact-sources/).
## See also
- [Field Insulation Measurement (ISO 16283)](https://jmrplens.github.io/phonometry/buildings/insulation/insulation-field/): the
airborne, impact and façade spectra these engines rate in the field.
- [Laboratory Insulation Measurement](https://jmrplens.github.io/phonometry/buildings/insulation/insulation-lab/): the laboratory
$R$ and $L_\mathrm{n}$ behind $R_\mathrm{w}$ and $L_\mathrm{n,w}$.
- [Sound Insulation by Intensity (ISO 15186)](https://jmrplens.github.io/phonometry/buildings/insulation/insulation-intensity/): the
intensity indices rated with the same airborne engine.
- [Sound Insulation Survey Method (ISO 10052)](https://jmrplens.github.io/phonometry/buildings/insulation/insulation-survey/): the
survey quantities and their automatic ratings.
- [Laboratory Flanking Transmission (ISO 10848)](https://jmrplens.github.io/phonometry/buildings/insulation/flanking-lab/): the
flanking descriptors $D_\mathrm{n,f,w}$ and $L_\mathrm{n,f,w}$.
- [Floor-Covering Impact Improvement (ISO 16251-1)](https://jmrplens.github.io/phonometry/buildings/design/impact-improvement/):
the weighted improvement $\Delta L_\mathrm{w}$ built on the ISO 717-2 reference
floor.
- [Predicting Sound Insulation (EN 12354)](https://jmrplens.github.io/phonometry/buildings/design/insulation-prediction/): the
single-number model that consumes these ratings.
- [Theory](https://jmrplens.github.io/phonometry/reference/theory/rooms-buildings/): the reference-curve derivation behind
the weighted single-number ratings.
- API reference: [`building.measurement.insulation`](https://jmrplens.github.io/phonometry/reference/api/building/insulation/).