Grafana Dashboard
A pre-built Grafana dashboard is included for monitoring the bouncer and router health.
Screenshots
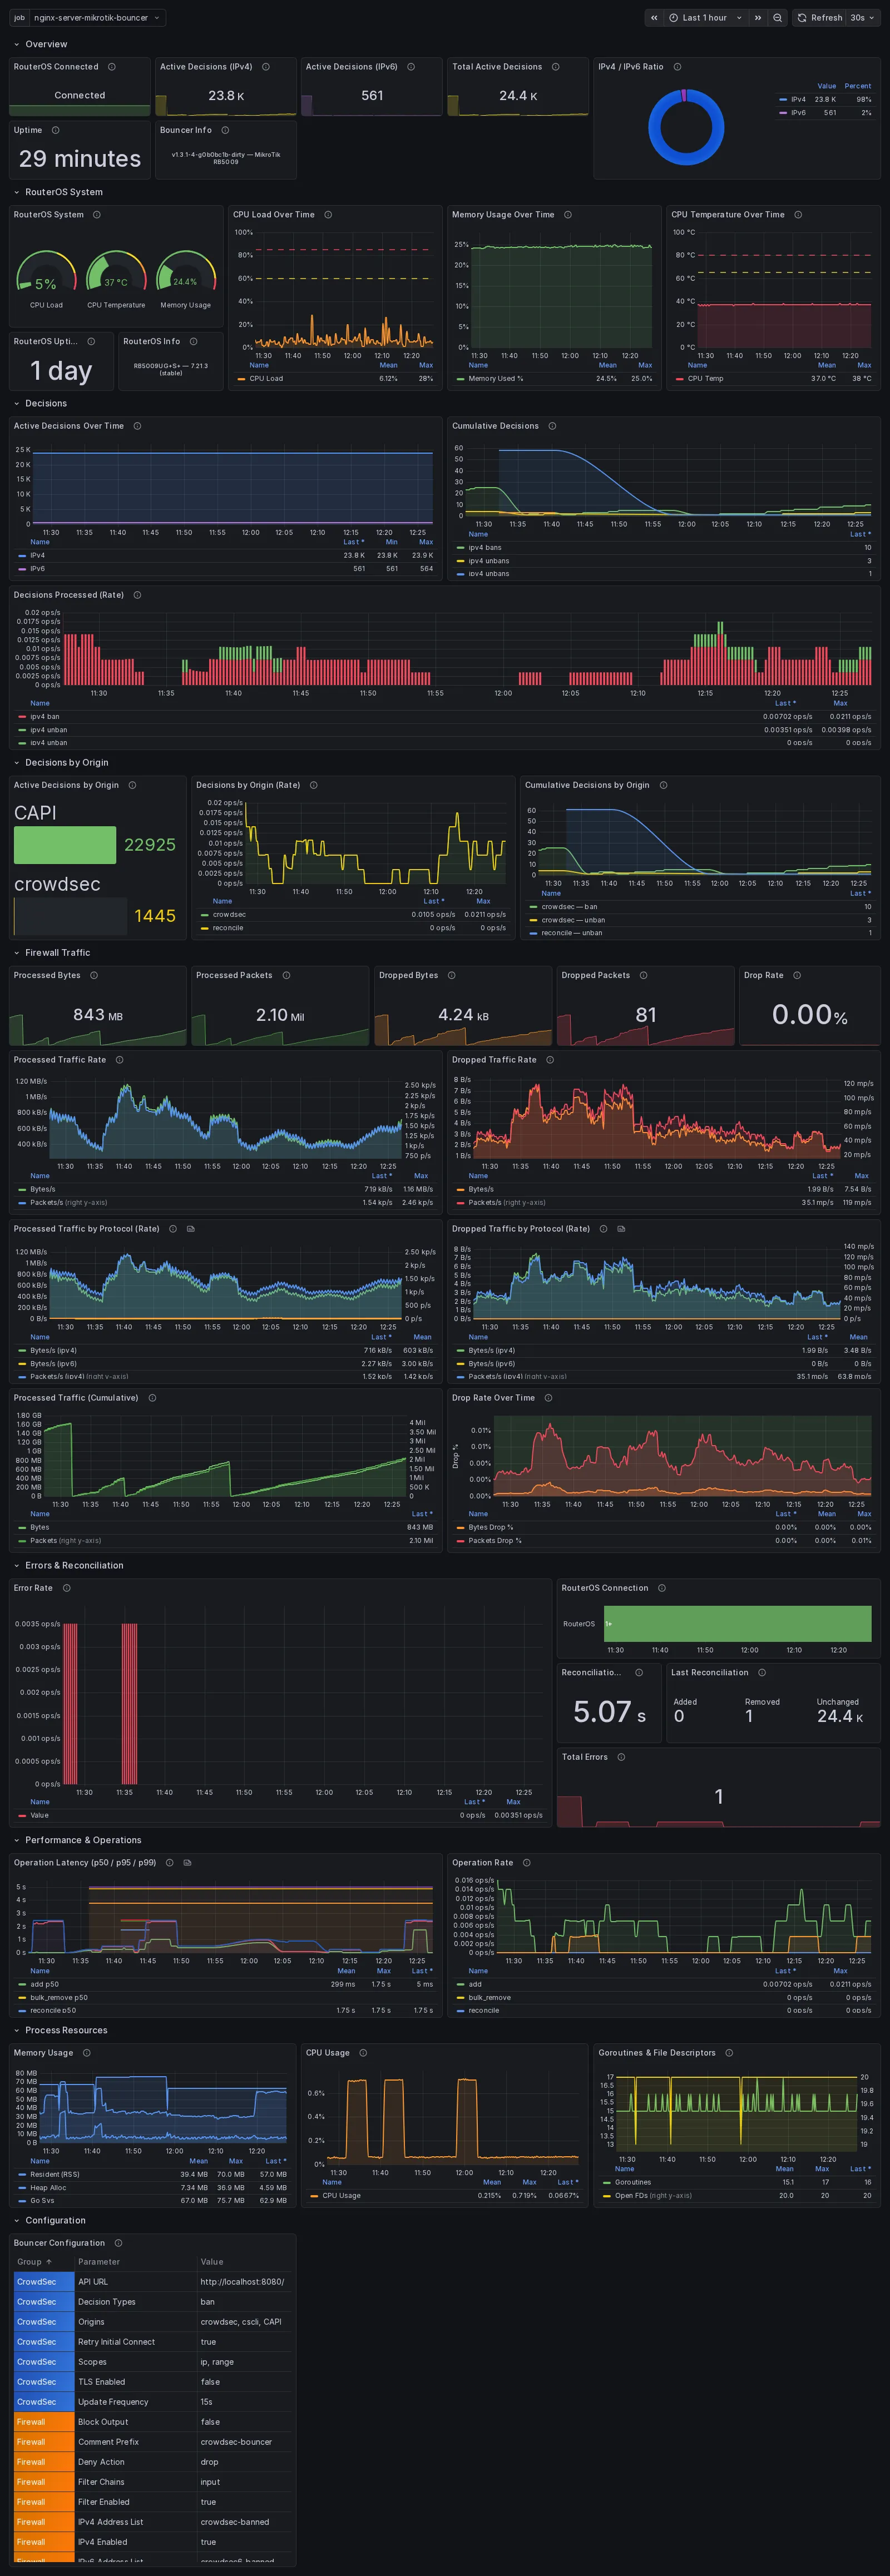
Section titled “Screenshots”Dark theme:
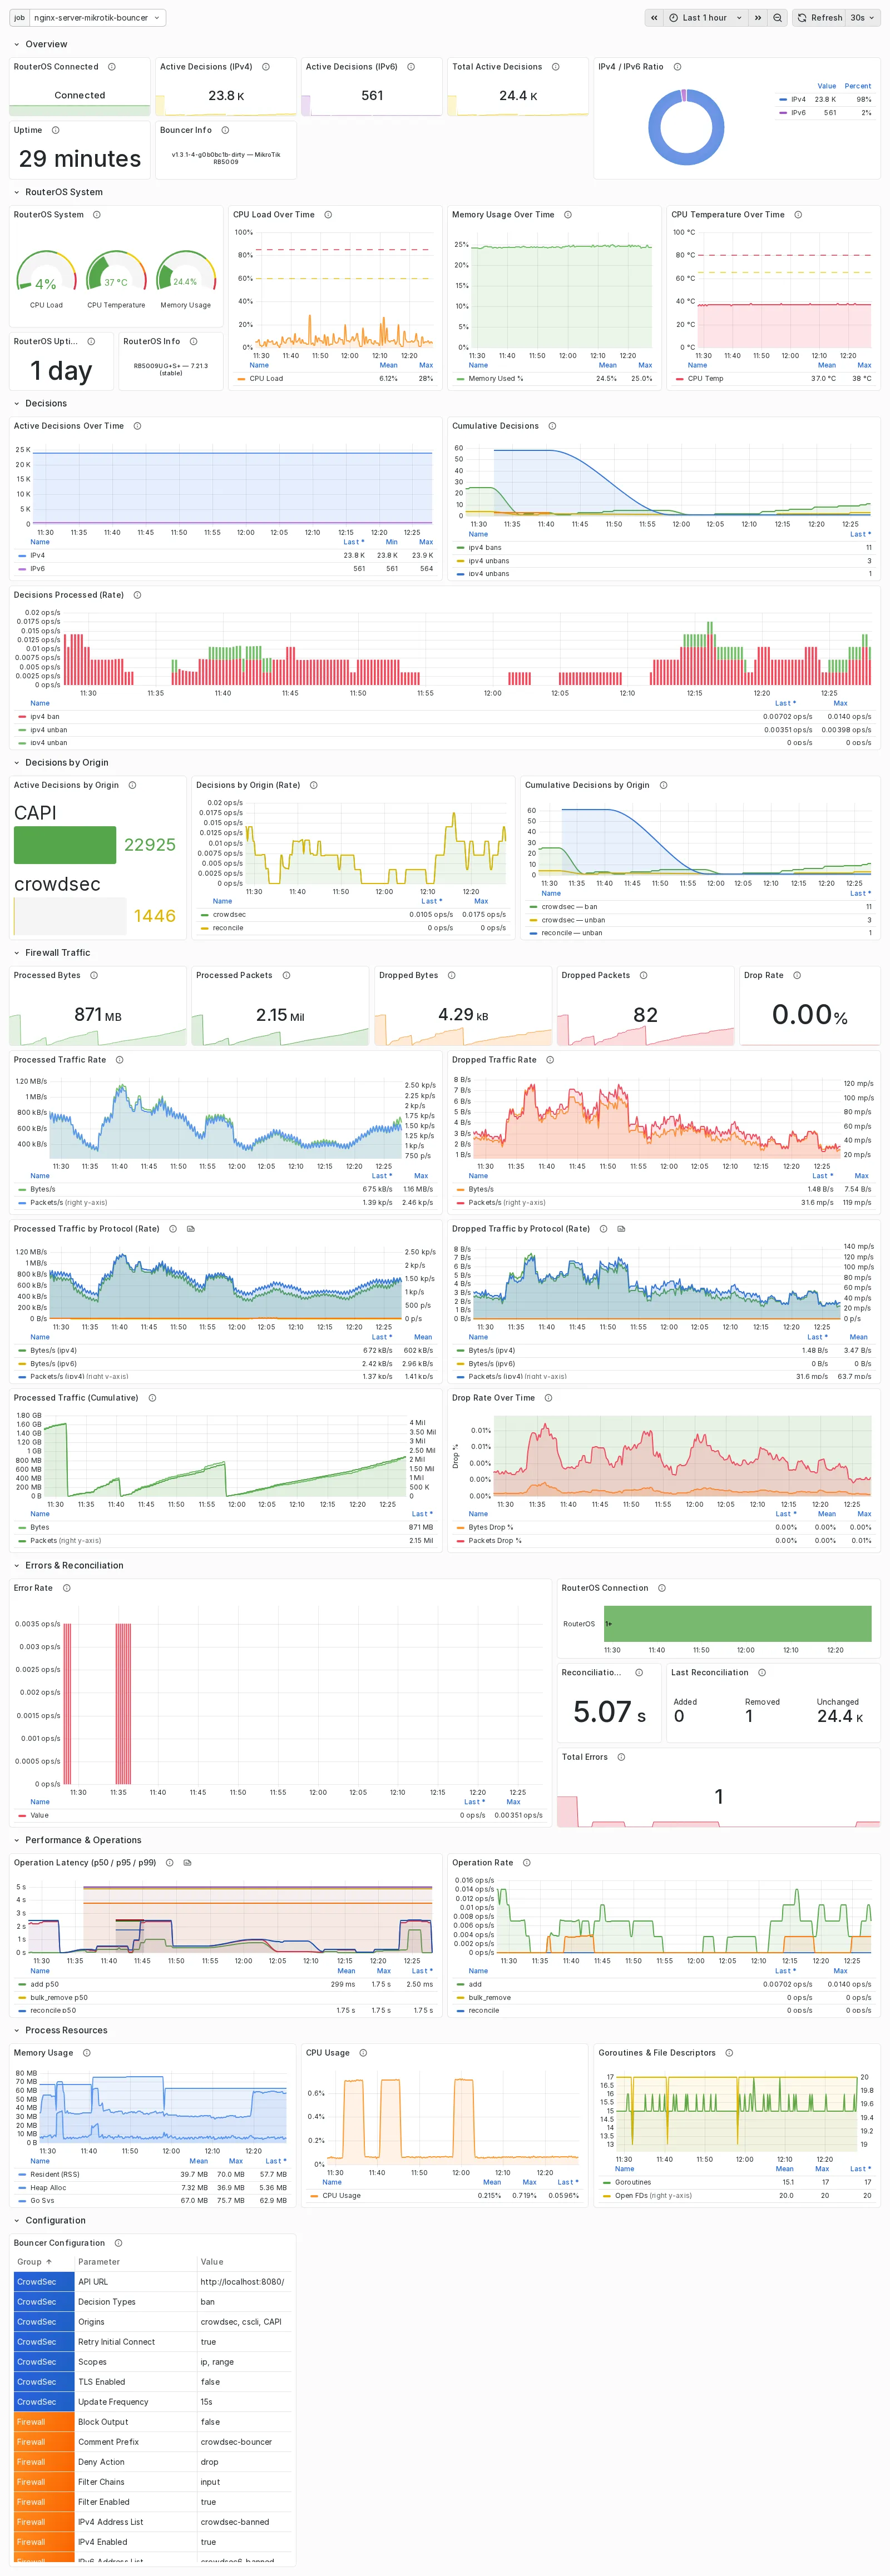
Light theme:
Prerequisites
Section titled “Prerequisites”Before importing the dashboard, you need:
- A running Grafana instance (v9.0+ recommended)
- A running Prometheus instance scraping the bouncer
- The bouncer running with
metrics.enabled: true
Setup Guide
Section titled “Setup Guide”1. Configure the Bouncer for Metrics
Section titled “1. Configure the Bouncer for Metrics”Enable Prometheus metrics in your bouncer configuration:
metrics: enabled: true listen_addr: "0.0.0.0" listen_port: 2112 routeros_poll_interval: 30s # Enables RouterOS system metricsVerify the metrics endpoint is working:
curl -s http://<bouncer-host>:2112/metrics | head -202. Configure Prometheus to Scrape the Bouncer
Section titled “2. Configure Prometheus to Scrape the Bouncer”Add a scrape job to your Prometheus configuration:
scrape_configs: - job_name: 'cs-routeros-bouncer' static_configs: - targets: ['<bouncer-host>:2112'] scrape_interval: 15sReplace <bouncer-host> with the IP or hostname where the bouncer is running.
After adding the scrape config, reload Prometheus:
# Reload via HTTP (if --web.enable-lifecycle is set)curl -X POST http://localhost:9090/-/reload
# Or restart Prometheussystemctl restart prometheus
Verify the target is healthy in Prometheus UI: Status → Targets — the cs-routeros-bouncer target should show UP.
3. Add Prometheus Data Source in Grafana
Section titled “3. Add Prometheus Data Source in Grafana”-
Open Data Sources
In Grafana, navigate to Connections → Data sources → Add data source.
-
Select Prometheus
Choose Prometheus from the list.
-
Configure the connection
Set the Prometheus server URL to your Prometheus instance (e.g.,
http://localhost:9090orhttp://prometheus:9090for Docker). -
Save & Test
Click Save & Test — you should see “Successfully queried the Prometheus API.”
4. Import the Dashboard
Section titled “4. Import the Dashboard”-
Open Grafana import
Navigate to Dashboards → New → Import.
-
Upload the dashboard JSON
Upload
grafana/cs-routeros-bouncer.jsonfrom the repository. -
Select Prometheus data source
Choose the Prometheus data source you configured in step 3.
-
Click Import
The dashboard will be created and immediately display data.
Dashboard Panels
Section titled “Dashboard Panels”The dashboard is organized into the following sections:
| Section | Panels |
|---|---|
| Overview | RouterOS Connected, Active Decisions (IPv4/IPv6/Total), Uptime, Bouncer Info |
| Active Decisions | Active Decisions Over Time, IPv4/IPv6 Ratio |
| Decision Processing | Decisions Processed (Rate), Cumulative Decisions |
| Performance & Operations | Operation Latency (p50/p95/p99), Operation Rate |
| Errors & Reconciliation | Error Rate, Total Errors, RouterOS Connection, Last Reconciliation, Reconciliation Duration |
| Dropped Traffic | Dropped Bytes, Dropped Packets, Dropped Traffic Rate, Dropped Traffic (Cumulative) |
| Processed Traffic | Processed Traffic Rate (Bytes/s, Packets/s), Drop Rate % |
| Decisions by Origin | Active Decisions by Origin, Decisions by Origin (Rate), Cumulative by Origin |
| RouterOS | RouterOS Info, RouterOS Uptime, Router CPU, Router Memory, Router Temperature |
| Configuration | Current bouncer configuration parameters |
| Process Resources | Memory Usage, CPU Usage, Goroutines & File Descriptors |